Analysis of Changes in Retinal Photoreceptors Using Optical Coherence Tomography in a Feline Model of Iodoacetic Acid-induced Retinal Degeneration
- Affiliations
-
- 1Department of Ophthalmology, Kosin University College of Medicine, Busan, Korea. hiatus@kosin.ac.kr
- 2Yangsan-si Dong-myeon Local Public Health Clinic, Busan, Korea.
- 3Department of Ophthalmology, Haeundae Paik Hospital, Inje University College of Medicine, Busan, Korea.
- KMID: 2465135
- DOI: http://doi.org/10.3341/kjo.2019.0082
Abstract
- PURPOSE
We investigated structural changes in the retina by using optical coherence tomography (OCT) in a feline model of retinal degeneration using iodoacetic acid (IAA).
METHODS
We examined 22 eyes of 11 felines over 2 years of age. The felines had fasted for 12 hours and were intravenously injected with IAA 20 mg/kg of body weight. OCT (Spectralis OCT) was performed at the point where the ends of the retinal vessels collected in the lateral direction from the optic nerve head and area centralis. Similarly, OCT was performed four times at 1-week intervals following injections, at which point the felines were sacrificed and histologic examinations were performed. Using OCT, the thickness of each layer of the retina was measured.
RESULTS
The average body weight of the three male and eight female felines investigated in this study was 1.61 ± 0.19 kg. The mean total retinal thickness of the felines before injection was 221.32 ± 9.82 µm, with a significant decrease in the retinal thickness at 2, 3, and 4 weeks following injections of 186.41 ± 35.42, 174.56 ± 31.94, and 175.35 ± 33.84 µm, respectively (p = 0.028, 0.027, and 0.027, respectively). The thickness of the outer nuclear layer was 57.49 ± 8.03 µm before injection and 29.26 ± 17.87, 25.62 ± 13.88, and 31.60 ± 18.38 µm at 2, 3, and 4 weeks, respectively, after injection (p = 0.028, 0.028, 0.046, respectively).
CONCLUSIONS
In a feline model of retinal degeneration using IAA, the total retinal thickness and the thickness of the outer nuclear layer were shown to decrease significantly on OCT.
MeSH Terms
Figure
-
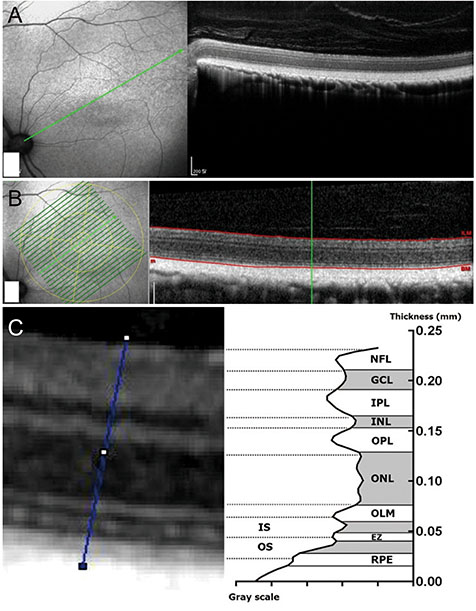
Fig. 1 Optical coherence tomography imaging. Spectralis optical coherence tomography was used to image the area centralis, where the vessel ends meet. (A) Linear scan. (B) Volume scan. Early Treatment for Diabetic Retinopathy Study circle shown in yellow line. (C) Measuring each retinal layer thickness. The thickness of each retinal layer was measured using ImageJ grayscale. The above graph was obtained using GraphPad Prism program ver. 7.02. NFL = nerve fiber layer; GCL = ganglion cell layer; IPL = inner plexiform layer; INL = inner nuclear layer; OPL = outer plexiform layer; ONL = outer nuclear layer; OLM = outer limiting membrane; IS = inner segment layer; OS = outer segment layer; EZ = ellipsoid zone; RPE = retinal pigmented epithelium.

Fig. 2 (A,B) Fluorescein angiography results from feline 4. (A) No abnormalities of the retina before iodoacetic acid (IAA) injection at 2:49, 2:26 seconds. (B) Delayed leak around the central and peripheral retina after IAA injection at 6:12, 7:08 seconds. (C,D) Fluorescein angiography results from feline 5. (C) No retinal abnormalities before IAA injection (at 3:12, 1:00 seconds after fluorescein injection). (D) No interval changes after IAA injection (at 1:09, 5:22 seconds after fluorescein injection).
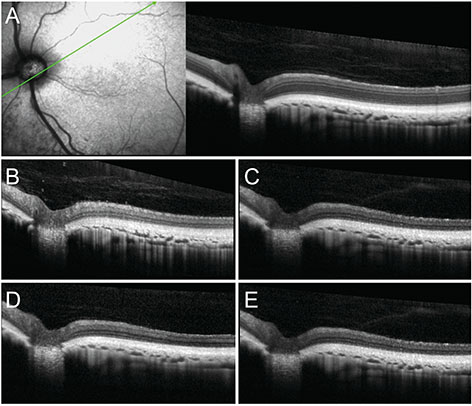
Fig. 3 Retinal changes obtained with optical coherence tomography after iodoacetic acid injection. (A) Baseline. (B) First week after injection. (C) Second week after injection. (D) Third week after injection. (E) Fourth week after injection. Note that the outer nuclear layer was substantially reduced and the photoreceptor layer was degenerated.
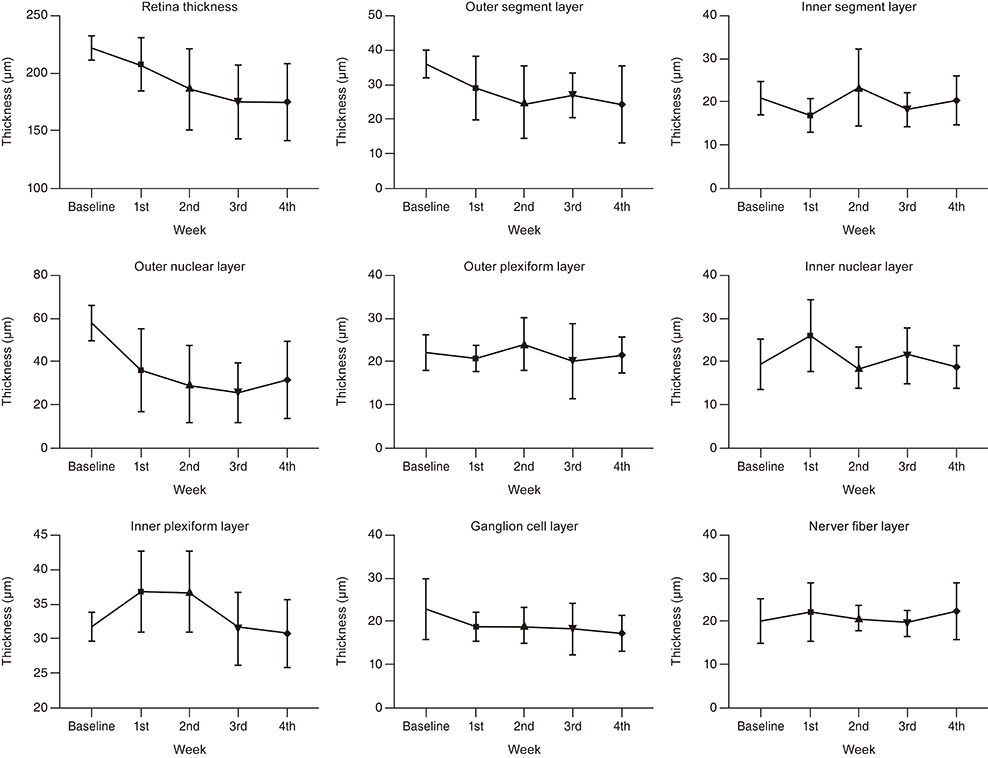
Fig. 4 Changes in retinal layer thickness after iodoacetic acid injection. *p < 0.05 versus baseline. Using methods shown in Fig. 1 and 2, retinal thicknesses were measured with optical coherence tomography and represented as a line graph.
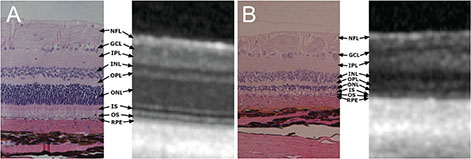
Fig. 5 Sections of normal and iodoacetic acid-treated feline retinas. A standard hematoxylin-eosin-stained retinal section matched the optical coherence tomography image. (A) Normal control. (B) An iodoacetic acid-treated feline retinal section. Outer nuclear layer thickness was reduced and outer segment/inner segment virtually disappeared. NFL = nerve fiber layer; GCL = ganglion cell layer; IPL = inner plexiform layer; INL = inner nuclear layer; OPL = outer plexiform layer; ONL = outer nuclear layer; IS = inner segment layer; OS = outer segment layer; RPE = retinal pigmented epithelium.
Reference
-
1. Berson EL. Retinitis pigmentosa. The Friedenwald lecture. Invest Ophthalmol Vis Sci. 1993; 34:1659–1676.2. Hartong DT, Berson EL, Dryja TP. Retinitis pigmentosa. Lancet. 2006; 368:1795–1809.3. Birch DG, Anderson JL, Fish GE. Yearly rates of rod and cone functional loss in retinitis pigmentosa and cone-rod dystrophy. Ophthalmology. 1999; 106:258–268.4. Clarke G, Collins RA, Leavitt BR, et al. A one-hit model of cell death in inherited neuronal degenerations. Nature. 2000; 406:195–199.5. Cheng YP, Ke CY, Kuo CC, Lee YJ. Effect of a complex lutein formula in an animal model for light-induced retinal degeneration. Chin J Physiol. 2016; 59:202–209.6. Taylor L, Arner K, Ghosh F. N-methyl-N-nitrosourea-induced neuronal cell death in a large animal model of retinal degeneration in vitro. Exp Eye Res. 2016; 148:55–64.7. Nagar S, Krishnamoorthy V, Cherukuri P, et al. Early remodeling in an inducible animal model of retinal degeneration. Neuroscience. 2009; 160:517–529.8. Yamauchi Y, Agawa T, Tsukahara R, et al. Correlation between high-resolution optical coherence tomography (OCT) images and histopathology in an iodoacetic acid-induced model of retinal degeneration in rabbits. Br J Ophthalmol. 2011; 95:1157–1160.9. Rapaport DH, Stone J. The area centralis of the retina in the cat and other mammals: focal point for function and development of the visual system. Neuroscience. 1984; 11:289–301.10. Nan Y, Zhang Q, Ren C, et al. Functional evaluation of iodoacetic acid induced photoreceptor degeneration in the cat. Sci China Life Sci. 2013; 56:524–530.11. Scott PA, Kaplan HJ, Sandell JH. Anatomical evidence of photoreceptor degeneration induced by iodoacetic acid in the porcine eye. Exp Eye Res. 2011; 93:513–527.12. Wang W, Fernandez de Castro J, Vukmanic E, et al. Selective rod degeneration and partial cone inactivation characterize an iodoacetic acid model of Swine retinal degeneration. Invest Ophthalmol Vis Sci. 2011; 52:7917–7923.13. Noel JM, Fernandez de Castro JP, Demarco PJ Jr, et al. Iodoacetic acid, but not sodium iodate, creates an inducible swine model of photoreceptor damage. Exp Eye Res. 2012; 97:137–147.14. Wang Y, Zhao L, Lu F, et al. Retinoprotective effects of bilberry anthocyanins via antioxidant, anti-inflammatory, and anti-apoptotic mechanisms in a visible light-induced retinal degeneration model in pigmented rabbits. Molecules. 2015; 20:22395–22410.15. Aplin FP, Luu CD, Vessey KA, et al. ATP-induced photoreceptor death in a feline model of retinal degeneration. Invest Ophthalmol Vis Sci. 2014; 55:8319–8329.16. Cibis PA, Noell WK. Cataract induced by iodoacetic acid; a preliminary report. Am J Ophthalmol. 1955; 40:379–382.17. Orzalesi N, Calabria GA, Grignolo A. Experimental degeneration of the rabbit retina induced by iodoacetic acid: a study of the ultrastructure, the rhodopsin cycle and the uptake of 14C-labeled iodoacetic acid. Exp Eye Res. 1970; 9:246–253.18. Toda N. Calcium independent contraction induced by iodoacetic acid in isolated cerebral arteries. Stroke. 1984; 15:475–480.19. Suna H, Arai M, Tsubotani Y, et al. Dysideamine, a new sesquiterpene aminoquinone, protects hippocampal neuronal cells against iodoacetic acid-induced cell death. Bioorg Med Chem. 2009; 17:3968–3972.20. Zhou X, Zhu L, Wang L, et al. Protective effect of edaravone in primary cerebellar granule neurons against iodoacetic acid-induced cell injury. Oxid Med Cell Longev. 2015; 2015:606981.21. Winkler BS, Sauer MW, Starnes CA. Modulation of the Pasteur effect in retinal cells: implications for understanding compensatory metabolic mechanisms. Exp Eye Res. 2003; 76:715–723.22. Noell WK. Experimentally induced toxic effects on structure and function of visual cells and pigment epithelium. Am J Ophthalmol. 1953; 36:103–116.23. Ofri R, Reilly CM, Maggs DJ, et al. Characterization of an early-onset, autosomal recessive, progressive retinal degeneration in Bengal cats. Invest Ophthalmol Vis Sci. 2015; 56:5299–5308.24. Chang B. Mouse models for studies of retinal degeneration and diseases. Methods Mol Biol. 2013; 935:27–39.25. Ehrenberg M, Ehrenberg S, Schwob O, Benny O. Murine fundus fluorescein angiography: an alternative approach using a handheld camera. Exp Eye Res. 2016; 148:74–78.26. Graymore C, Tansley K. Iodoacetate poisoning of the rat retina. II. Glycolysis in the poisoned retina. Br J Ophthalmol. 1959; 43:486–493.27. Rosch S, Johnen S, Mazinani B, et al. The effects of iodoacetic acid on the mouse retina. Graefes Arch Clin Exp Ophthalmol. 2015; 253:25–35.28. Graymore C, Tansley K. Iodoacetate poisoning of the rat retina. I. Production of retinal degeneration. Br J Ophthalmol. 1959; 43:177–185.29. Liang L, Katagiri Y, Franco LM, et al. Long-term cellular and regional specificity of the photoreceptor toxin, iodoacetic acid (IAA), in the rabbit retina. Vis Neurosci. 2008; 25:167–177.30. Thomas D, Duguid G. Optical coherence tomography: a review of the principles and contemporary uses in retinal investigation. Eye (Lond). 2004; 18:561–570.31. Huang D, Swanson EA, Lin CP, et al. Optical coherence tomography. Science. 1991; 254:1178–1181.32. Spaide RF, Curcio CA. Anatomical correlates to the bands seen in the outer retina by optical coherence tomography: literature review and model. Retina. 2011; 31:1609–1619.33. Fisher SK, Steinberg RH. Origin and organization of pigment epithelial apical projections to cones in cat retina. J Comp Neurol. 1982; 206:131–145.34. Hernandez-Merino E, Kecova H, Jacobson SJ, et al. Spectral domain optical coherence tomography (SD-OCT) assessment of the healthy female canine retina and optic nerve. Vet Ophthalmol. 2011; 14:400–405.35. Gloesmann M, Hermann B, Schubert C, et al. Histologic correlation of pig retina radial stratification with ultrahigh-resolution optical coherence tomography. Invest Ophthalmol Vis Sci. 2003; 44:1696–1703.36. Rauscher FG, Azmanis P, Korber N, et al. Optical coherence tomography as a diagnostic tool for retinal pathologies in avian ophthalmology. Invest Ophthalmol Vis Sci. 2013; 54:8259–8269.37. Hayashi M, Maehara S, Ito Y, et al. Comparison between indocyanine green angiography and fluorescein angiography in normal cats. Vet Ophthalmol. 2017; 20:310–315.38. Menghini M, Lujan BJ, Zayit-Soudry S, et al. Correlation of outer nuclear layer thickness with cone density values in patients with retinitis pigmentosa and healthy subjects. Invest Ophthalmol Vis Sci. 2014; 56:372–381.
- Full Text Links
-
- Actions
-
Cited
- CITED
-
- Close
- Share
-
- Similar articles
-
- Assessment of retinal degeneration with optical coherence tomography in a dog
- Electroretinography Changes in Feline Model of Iodoacetic Acid-induced Retinal Degeneration
- Foveal Retinal Detachment Diagnosed by Optical Coherence Tomography after Successful Retinal Detachment Surgery
- Characteristic Findings of Optical Coherence Tomography in Retinal Angiomatous Proliferation
- Fundus Autofluorescence, Fluorescein Angiography and Spectral Domain Optical Coherence Tomography Findings of Retinal Astrocytic Hamartomas in Tuberous Sclerosis
