Ultrasound Feature-Based Diagnostic Model Focusing on the “Submarine Sign” for Epidermal Cysts among Superficial Soft Tissue Lesions
- Affiliations
-
- 1Department of Radiology, Gangnam Severance Hospital, Research Institute of Radiological Science, Center for Clinical Imaging Data Science, Yonsei University College of Medicine, Seoul, Korea. agn70@yuhs.ac
- 2Department of Pathology, Gangnam Severance Hospital, Yonsei University College of Medicine, Seoul, Korea.
- 3Biostatistics Collaboration Unit, Yonsei University College of Medicine, Seoul, Korea.
- KMID: 2459160
- DOI: http://doi.org/10.3348/kjr.2019.0241
Abstract
OBJECTIVE
To develop a diagnostic model for superficial soft tissue lesions to differentiate epidermal cyst (EC) from other lesions based on ultrasound (US) features.
MATERIALS AND METHODS
This retrospective study included 205 patients who had undergone US examinations for superficial soft tissue lesions and subsequent surgical excision. The study population was divided into the derivation set (n = 112) and validation set (n = 93) according to the imaging date. The following US features were analyzed to determine those that could discriminate EC from other lesions: more-than-half-depth involvement of the dermal layer, "submarine sign" (focal projection of the hypoechoic portion to the epidermis), posterior acoustic enhancement, posterior wall enhancement, morphology, shape, echogenicity, vascularity, and perilesional fat change. Using multivariable logistic regression, a diagnostic model was constructed and visualized as a nomogram. The performance of the diagnostic model was assessed by calculating the area under the curve (AUC) of the receiver operating characteristic curve and calibration plot in both the derivation and validation sets.
RESULTS
More-than-half-depth involvement of the dermal layer (odds ratio [OR] = 3.35; p = 0.051), "submarine sign" (OR = 12.2; p < 0.001), and morphology (OR = 5.44; p = 0.002) were features that outweighed the others when diagnosing EC. The diagnostic model based on these features showed good discrimination ability in both the derivation set (AUC = 0.888, 95% confidence interval [95% CI] = 0.825-0.950) and validation set (AUC = 0.902, 95% CI = 0.832-0.972).
CONCLUSION
More-than-half-depth of involvement of the dermal layer, "submarine sign," and morphology are relatively better US features than the others for diagnosing EC.
Keyword
MeSH Terms
Figure
-
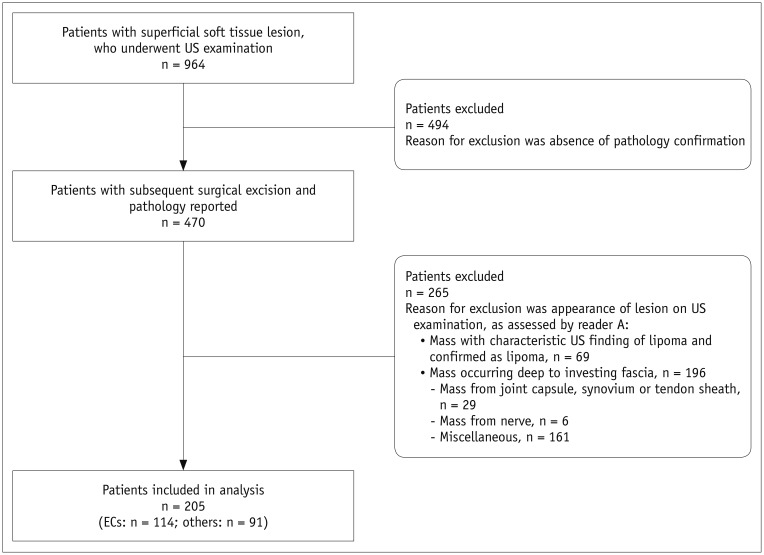
Fig. 1 Flow chart illustrating patient selection.EC = epidermal cyst, US = ultrasound
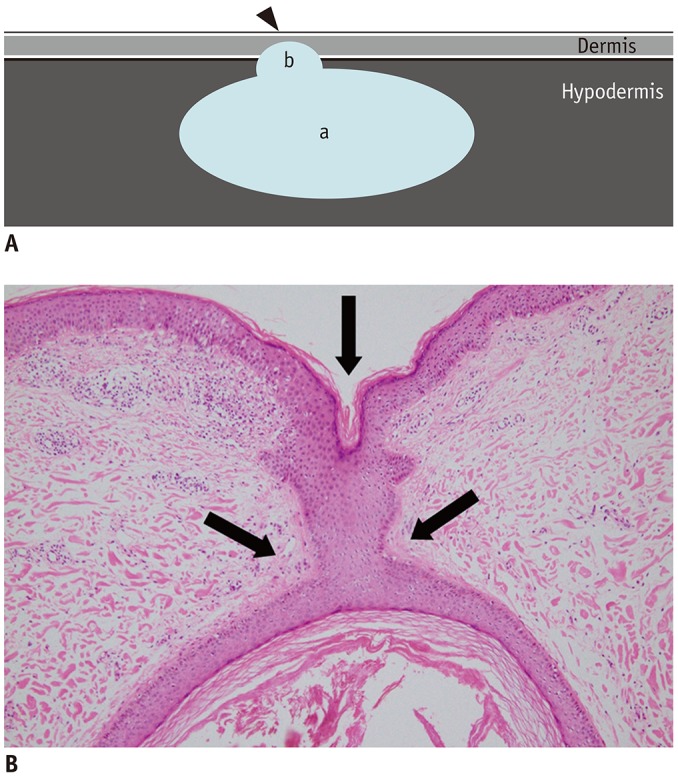
Fig. 2 “Submarine sign” of EC.A. Illustration demonstrating “submarine sign,” which is defined when lesion shows focal protrusion of hypoechoic portion (b) from main mass (a) to epidermis (arrowhead). B. Photomicrograph (original magnification, × 400; hematoxylin-eosin stain) shows focal tract-like appearance (arrows) of EC and epidermis.
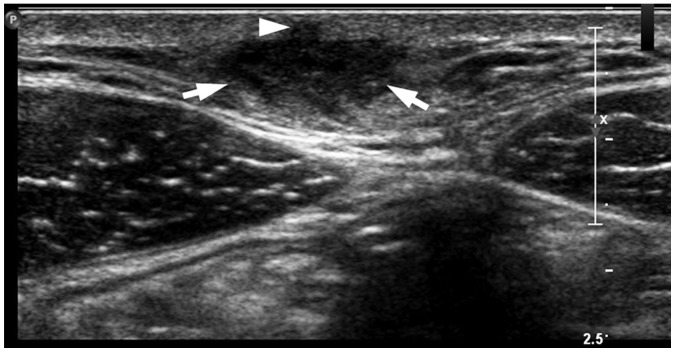
Fig. 3 Representative case of “submarine sign” in 54-year-old female with EC in back.Focal protrusion of hypoechoic portion (arrowhead) from main mass appears as “submarine sign.” Arrows indicate delineation from adjacent hypodermal fat.
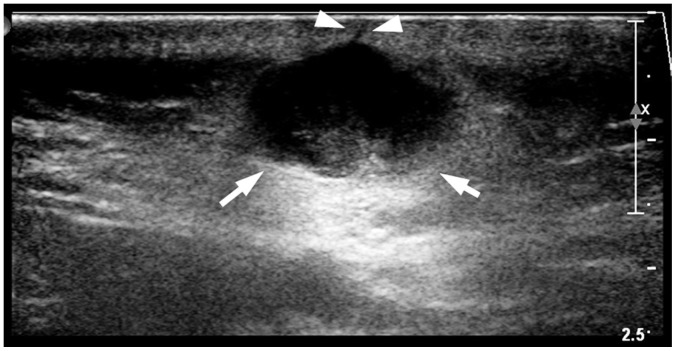
Fig. 4 Another representative case of “submarine sign” in 32-year-old male with EC in posterior neck.Focal protrusion of hypoechoic portion (arrowheads) from main mass appears like “tract-to-skin sign.” It also counted as “submarine sign.” Arrows indicate delineation from adjacent hypodermal fat.
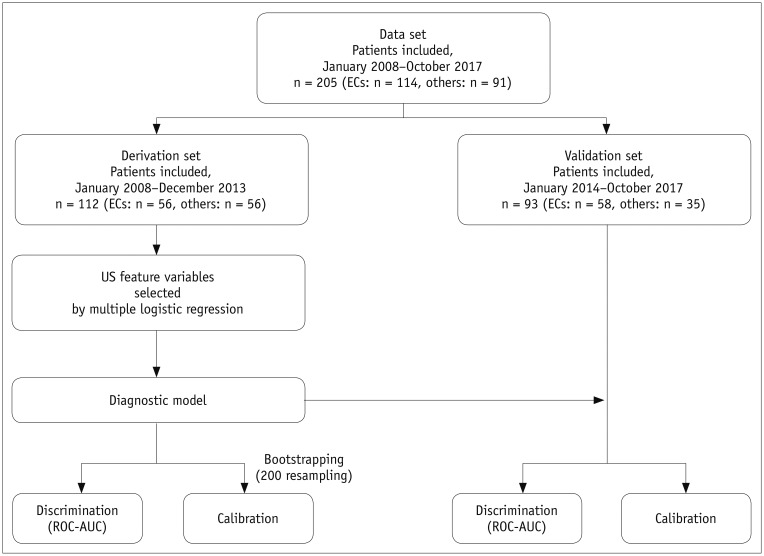
Fig. 5 Algorithm showing statistical analysis schema.AUC = area under curve, ROC = receiver operating characteristic
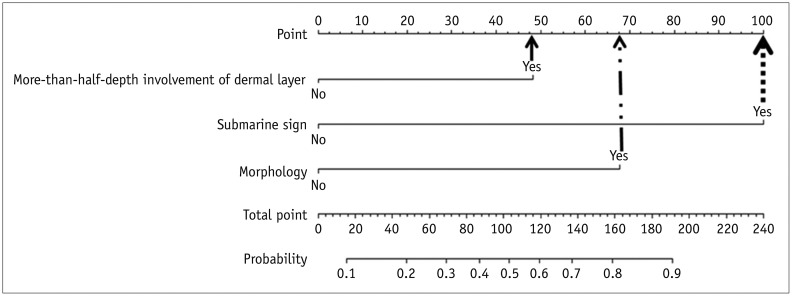
Fig. 6 Nomogram visualizing diagnostic model for predicting of EC.Point corresponding to each US feature can be determined using at uppermost scale (more-than-half-depth involvement of dermal layer = 48 [solid arrow]; “submarine sign” = 100 [dashed arrow]; and morphology = 68 [dotted and solid arrow]). Then, sum of all points is matched at scale of total point. Further, line drawn down from at that point helps calculate probability of EC. If calculated probability exceeds 0.44, it is considered highly likely to be EC.
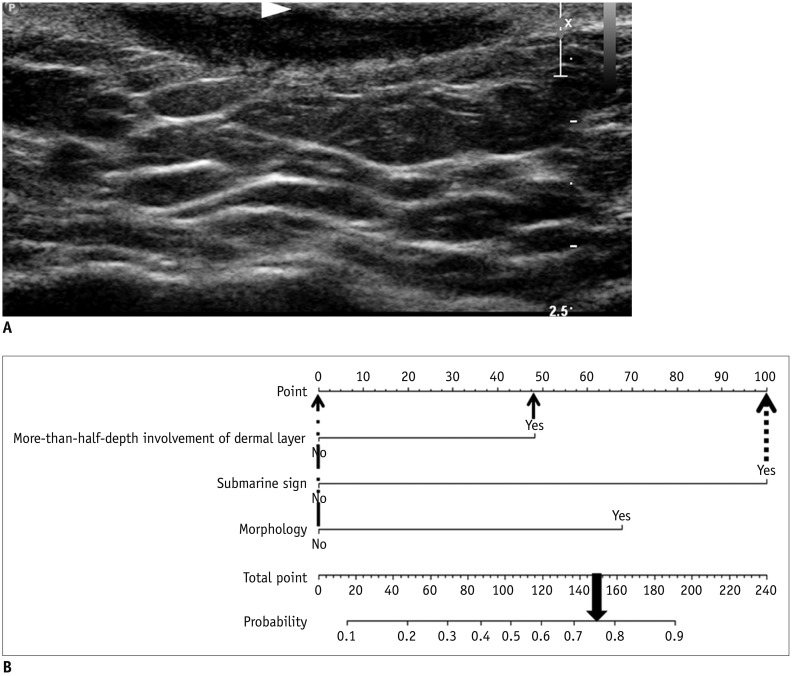
Fig. 7 True positive example identified using developed nomogram.A. US exam obtained from 26-year-old male patient revealed subcutaneous nodule in anterior chest wall involving more-than-half-depth of dermal layer, “submarine sign” (arrowhead), and no posterior acoustic enhancement. Its morphology does not fit any of morphological criteria. B. Total point which is taken from nomogram of patient is 148 (48 + 100 + 0 = 148). This point is converted to predicted probability of 0.756 by using calculation of equation. Similar numerical value is obtained via visual assessment of nomogram (bold arrow). This lesion is pathologically confirmed as EC.
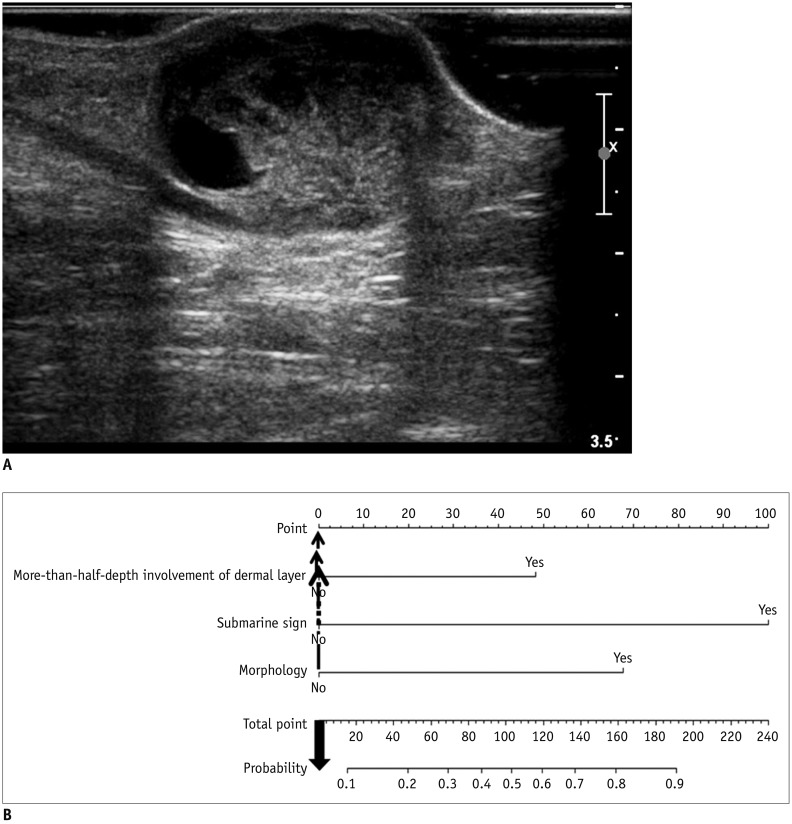
Fig. 8 True negative example identified using developed nomogram.A. Subcutaneous nodule in left calf of 30-year-old male patient is noted with internal cystic change and posterior acoustic enhancement on US exam. However, this lesion shows less than half-depth involvement of dermis and no “submarine sign.” Morphology of this lesion does not fit any of known typical morphology of EC. This mass was excised and was found to be schwannoma with cystic degeneration and hemorrhage. B. Total point obtained from nomogram of patient is 0 (0 + 0 + 0 = 0). As it yields predicted probability of 0.07 by using equation, visually assessed probability based on nomogram is less than 0.10 and lower than cut-off value of 0.44.
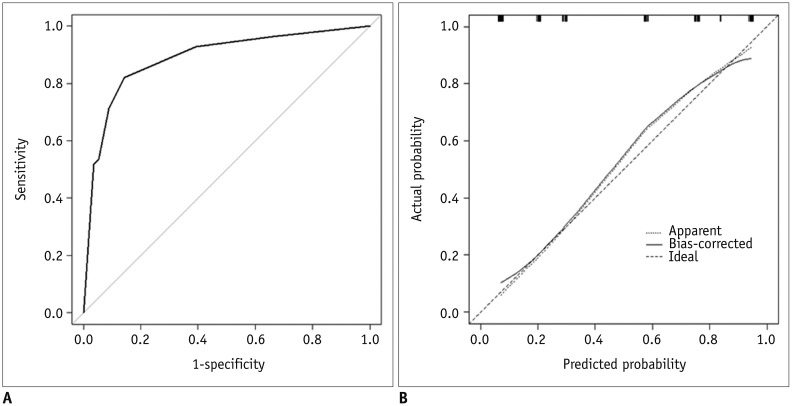
Fig. 9 Internal validation of diagnostic model.A. Discrimination performance. Following ROC curve analysis for diagnostic model of EC was obtained in derivation set. AUC was 0.888 (95% CI, 0.825–0.950). B. Calibration ability. Dashed line was reference line where ideal diagnostic model would lie. Dotted line was calibration ability of diagnostic model, while solid line corrects for bias. 95% CI = 95% confidence interval
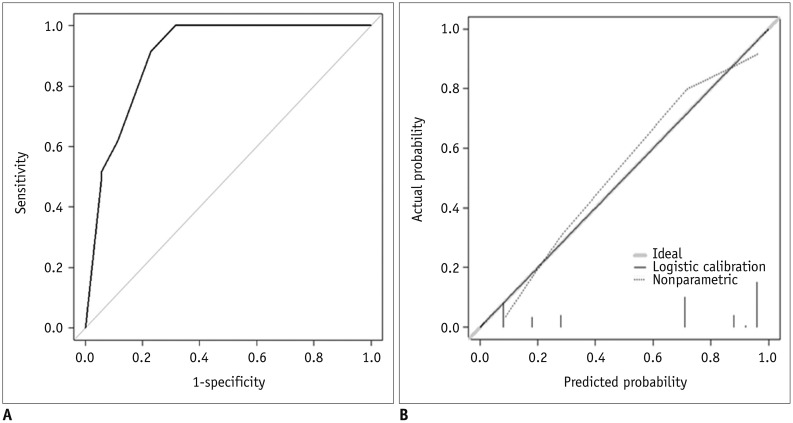
Fig. 10 External validation of diagnostic model.A. Discrimination performance. In independent validation set, it was shown as following ROC curve analysis for diagnostic model of EC. AUC was 0.902 (95% CI, 0.832–0.972). B. Calibration ability. Soft and thickly drown diagonal line represents reference line where ideal diagnostic model would lie. Lines, that stand for calibration ability of diagnostic model in independent validation set with both logistic calibration (solid line) and nonparametric calibration (dotted line, using lowess), almost coincide with ideal reference.
Reference
-
1. Vincent LM, Parker LA, Mittelstaedt CA. Sonographic appearance of an epidermal inclusion cyst. J Ultrasound Med. 1985; 4:609–611. PMID: 3908709.
Article2. Lee HS, Joo KB, Song HT, Kim YS, Park DW, Park CK, et al. Relationship between sonographic and pathologic findings in epidermal inclusion cysts. J Clin Ultrasound. 2001; 29:374–383. PMID: 11579399.
Article3. Kim HK, Kim SM, Lee SH, Racadio JM, Shin MJ. Subcutaneous epidermal inclusion cysts: ultrasound (US) and MR imaging findings. Skeletal Radiol. 2011; 40:1415–1419. PMID: 21132291.
Article4. Stone MS. Cysts. In : Bolognia JL, Schaffer JV, Cerroni L, editors. Dermatology. 4th ed. New York, NY: Elsevier;2018. p. 1917–1929.5. Benign neoplasms and hyperplasias. In : Wolff K, Johnson RA, Saavedra AP, Roh EK, editors. Fitzpatrick's color atlas and synopsis of clinical dermatology. 8th ed. New York, NY: McGraw-Hill Education;2017. p. 141–173.6. López-Ríos F, Rodríguez-Peralto JL, Castaño E, Benito A. Squamous cell carcinoma arising in a cutaneous epidermal cyst: case report and literature review. Am J Dermatopathol. 1999; 21:174–177. PMID: 10218680.7. Veenstra JJ, Choudhry S, Krajenta RJ, Eide MJ. Squamous cell carcinoma originating from cutaneous cysts: the Henry Ford experience and review of the literature. J Dermatolog Treat. 2016; 27:95–98. PMID: 26105203.
Article8. Antón-Badiola I, San Miguel-Fraile P, Peteiro-Cancelo A, Ortiz-Rey JA. [Squamous cell carcinoma arising on an epidermal inclusion cyst: a case presentation and review of the literature]. Actas Dermosifiliogr. 2010; 101:349–353. PMID: 20487691.
Article9. Hwang EJ, Yoon HS, Cho S, Park HS. The diagnostic value of ultrasonography with 5–15-MHz probes in benign subcutaneous lesions. Int J Dermatol. 2015; 54:e469–e475. PMID: 26148060.
Article10. Hung EH, Griffith JF, Ng AW, Lee RK, Lau DT, Leung JC. Ultrasound of musculoskeletal soft-tissue tumors superficial to the investing fascia. AJR Am J Roentgenol. 2014; 202:W532–W540. PMID: 24848846.
Article11. Nigam JS, Bharti JN, Nair V, Gargade CB, Deshpande AH, Dey B, et al. Epidermal cysts: a clinicopathological analysis with emphasis on unusual findings. Int J Trichology. 2017; 9:108–112. PMID: 28932061.12. Apollos JR, Ekatah GE, Ng GS, McFadyen AK, Whitelaw SC. Routine histological examination of epidermoid cysts; to send or not to send? Ann Med Surg (Lond). 2016; 13:24–28. PMID: 28053700.
Article13. Kuwano Y, Ishizaki K, Watanabe R, Nanko H. Efficacy of diagnostic ultrasonography of lipomas, epidermal cysts, and ganglions. Arch Dermatol. 2009; 145:761–764. PMID: 19620556.
Article14. Wortsman X. Common applications of dermatologic sonography. J Ultrasound Med. 2012; 31:97–111. PMID: 22215775.
Article15. Wortsman X, Wortsman J. Clinical usefulness of variable-frequency ultrasound in localized lesions of the skin. J Am Acad Dermatol. 2010; 62:247–256. PMID: 19962214.
Article16. Kleinerman R, Whang TB, Bard RL, Marmur ES. Ultrasound in dermatology: principles and applications. J Am Acad Dermatol. 2012; 67:478–487. PMID: 22285673.
Article17. Toprak H, Kiliç E, Serter A, Kocakoç E, Ozgocmen S. Ultrasound and Doppler US in evaluation of superficial soft-tissue lesions. J Clin Imaging Sci. 2014; 4:12. PMID: 24744969.
Article18. Fornage BD, Tassin GB. Sonographic appearances of superficial soft tissue lipomas. J Clin Ultrasound. 1991; 19:215–220. PMID: 1646225.
Article19. Inampudi P, Jacobson JA, Fessell DP, Carlos RC, Patel SV, Delaney-Sathy LO, et al. Soft-tissue lipomas: accuracy of sonography in diagnosis with pathologic correlation. Radiology. 2004; 233:763–767. PMID: 15486212.
Article20. Lee MH, Kim NR, Ryu JA. Cyst-like solid tumors of the musculoskeletal system: an analysis of ultrasound findings. Skeletal Radiol. 2010; 39:981–986. PMID: 20186412.
Article21. Teefey SA, Dahiya N, Middleton WD, Gelberman RH, Boyer MI. Ganglia of the hand and wrist: a sonographic analysis. AJR Am J Roentgenol. 2008; 191:716–720. PMID: 18716098.
Article22. Feldman MK, Katyal S, Blackwood MS. US artifacts. Radiographics. 2009; 29:1179–1189. PMID: 19605664.
Article23. Huang CC, Ko SF, Huang HY, Ng SH, Lee TY, Lee YW, et al. Epidermal cysts in the superficial soft tissue: sonographic features with an emphasis on the pseudotestis pattern. J Ultrasound Med. 2011; 30:11–17. PMID: 21193700.24. Mendelson EB, Böhm-Vélez M, Berg WA, Whitman GJ, Feldman MI, Madjar H, et al. ACR BI-RADS ultrasound. In : D'Orsi CJ, Sickles EA, Mendelson EB, Morris EA, editors. ACR BI-RADS atlas, breast imaging reporting and data system. 5th ed. Reston, VA: American College of Radiology;2013. p. 1–173.25. Chau CL, Griffith JF. Musculoskeletal infections: ultrasound appearances. Clin Radiol. 2005; 60:149–159. PMID: 15664569.
Article26. Chang CD, Wu JS. Imaging of musculoskeletal soft tissue infection. Semin Roentgenol. 2017; 52:55–62. PMID: 28434505.
Article27. Turecki MB, Taljanovic MS, Stubbs AY, Graham AR, Holden DA, Hunter TB, et al. Imaging of musculoskeletal soft tissue infections. Skeletal Radiol. 2010; 39:957–971. PMID: 19714328.
Article28. Chandrasekaran V, Parkash S, Raghuveer CV. Epidermal cysts - a clinicopathological and biochemical study. Postgrad Med J. 1980; 56:823–827. PMID: 7267491.
Article29. Fullen DR. Cysts and sinuses. In : Busam KJ, Goldblum JR, editors. Dermatopathology. 2nd ed. Philadelphia, PA: Saunders;2016. p. 310–336.30. Altman DG, Royston P. What do we mean by validating a prognostic model? Stat Med. 2000; 19:453–473. PMID: 10694730.
Article31. Steyerberg EW, Bleeker SE, Moll HA, Grobbee DE, Moons KG. Internal and external validation of predictive models: a simulation study of bias and precision in small samples. J Clin Epidemiol. 2003; 56:441–447. PMID: 12812818.
Article32. Yoon JH, Lee HS, Kim EK, Moon HJ, Kwak JY. A nomogram for predicting malignancy in thyroid nodules diagnosed as atypia of undetermined significance/follicular lesions of undetermined significance on fine needle aspiration. Surgery. 2014; 155:1006–1013. PMID: 24630147.
Article33. Bleeker SE, Moll HA, Steyerberg EW, Donders AR, Derksen-Lubsen G, Grobbee DE, et al. External validation is necessary in prediction research: a clinical example. J Clin Epidemiol. 2003; 56:826–832. PMID: 14505766.34. Steyerberg EW, Vickers AJ, Cook NR, Gerds T, Gonen M, Obuchowski N, et al. Assessing the performance of prediction models: a framework for traditional and novel measures. Epidemiology. 2010; 21:128–138. PMID: 20010215.35. Widmann G, Riedl A, Schoepf D, Glodny B, Peer S, Gruber H. State-of-the-art HR-US imaging findings of the most frequent musculoskeletal soft-tissue tumors. Skeletal Radiol. 2009; 38:637–649. PMID: 18846371.
Article36. Elston DM. Benign tumors and cysts of the epidermis. In : Elston DM, Ferringer T, Ko CJ, Peckham S, High WA, DiCaudo DJ, editors. Dermatopathology. 3rd ed. New York, NY: Elsevier;2019. p. 36–53.37. Stavros AT. Sonographic evaluation of breast cysts. In : Stavros AT, editor. Breast ultrasound. Philadelphia, PA: Lippincott Williams & Wilkins;2004. p. 276–350.38. Giess CS, Raza S, Birdwell RL. Distinguishing breast skin lesions from superficial breast parenchymal lesions: diagnostic criteria, imaging characteristics, and pitfalls. Radiographics. 2011; 31:1959–1972. PMID: 22084181.
Article39. Yuan WH, Hsu HC, Lai YC, Chou YH, Li AF. Differences in sonographic features of ruptured and unruptured epidermal cysts. J Ultrasound Med. 2012; 31:265–272. PMID: 22298870.
Article40. Jin W, Ryu KN, Kim GY, Kim HC, Lee JH, Park JS. Sonographic findings of ruptured epidermal inclusion cysts in superficial soft tissue: emphasis on shapes, pericystic changes, and pericystic vascularity. J Ultrasound Med. 2008; 27:171–176. quiz 177-178. PMID: 18204007.
- Full Text Links
-
- Actions
-
Cited
- CITED
-
- Close
- Share
-
- Similar articles
-
- Usefulness of strain elastography in the differential diagnosis of ruptured epidermal cyst and superficial abscess
- Superficial Soft Tissue Masses: Sonographic and Pathologic Findings
- The feasibility of shear wave elastography for diagnosing superficial benign soft tissue masses
- Clinical Situations in which Musculoskeletal Ultrasound is Helpful
- Epidermal Cyst of the Breast Simulating a Benign Solid Mass: A Case Report
