Korean J Radiol.
2019 Sep;20(9):1399-1407. 10.3348/kjr.2019.0068.
Quantitative Evaluation of Hepatic Steatosis Using Normalized Local Variance in a Rat Model: Comparison with Histopathology as the Reference Standard
- Affiliations
-
- 1Department of Radiology, Seoul National University Hospital, Seoul, Korea. leejy4u@gmail.com
- 2Department of Radiology, Seoul National University College of Medicine, Seoul, Korea.
- 3Institute of Radiation Medicine, Seoul National University Medical Research Center, Seoul, Korea.
- 4Department of Pathology, Seoul National University Hospital, Seoul, Korea.
- KMID: 2455768
- DOI: http://doi.org/10.3348/kjr.2019.0068
Abstract
OBJECTIVE
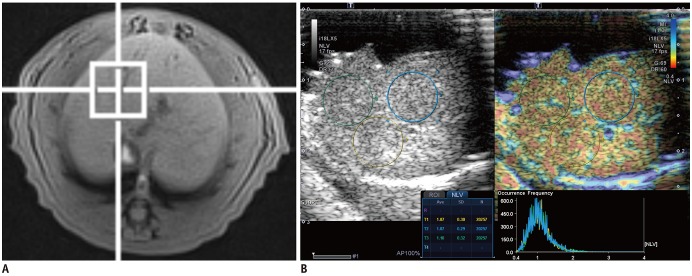
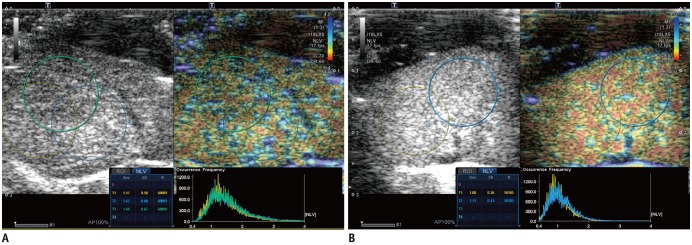
To evaluate the diagnostic performance of the normalized local variance (NLV) ultrasound technique in the assessment of hepatic steatosis, and to identify the factors that influence the NLV value using histopathological examination as the reference standard.
MATERIALS AND METHODS
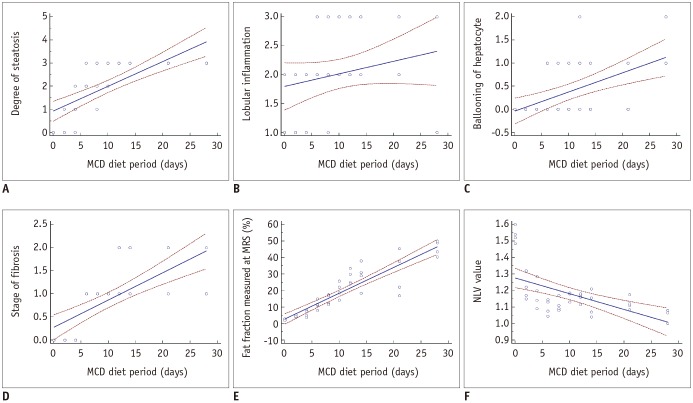
Forty male Sprague-Dawley rats were fed a methionine-choline-deficient diet for variable periods (0, 2, 4, 6, 8, 10, or 12 days or 2, 3, or 4 weeks; four rats per group). At the end of each diet duration, magnetic resonance spectroscopy (MRS) and NLV examination were performed. Thereafter, the rats were sacrificed and their livers were histopathologically evaluated. Receiver operating characteristic (ROC) curve analysis was performed to assess the diagnostic capability of the NLV value in the detection of varying degrees of hepatic steatosis. Univariate and multivariate linear regressions were used to determine the factors associated with the NLV value.
RESULTS
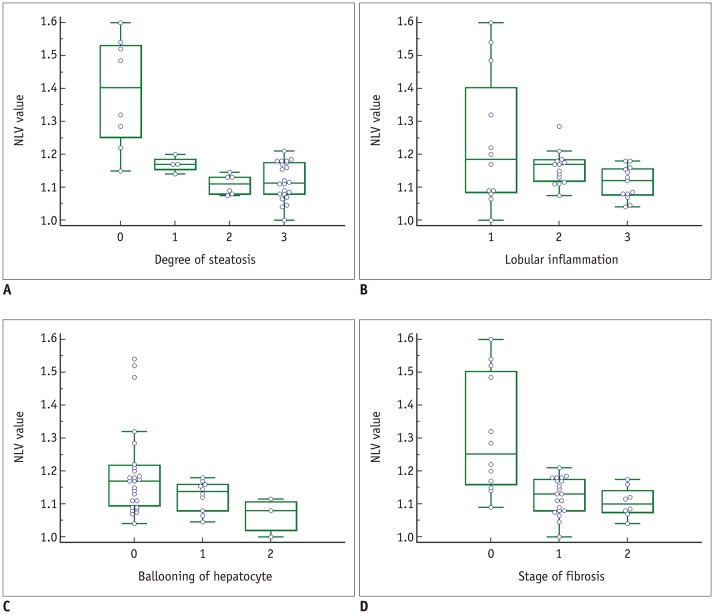
The areas under the ROC curve for the detection of mild, moderate, and severe hepatic steatosis were 0.953, 0.896, and 0.735, respectively. The NLV value showed comparable diagnostic performance to that of MRS in the detection of ≥ mild or ≥ moderate hepatic steatosis. Multivariate linear regression analysis revealed that the degree of hepatic steatosis was the only significant factor affecting the NLV value (p < 0.001).
CONCLUSION
The NLV value of ultrasound demonstrated satisfactory diagnostic performance in the assessment of varying degrees of hepatic steatosis. The degree of hepatic steatosis was the only significant factor that affected the NLV value.
MeSH Terms
Figure
Reference
-
1. Angulo P. Obesity and nonalcoholic fatty liver disease. Nutr Rev. 2007; 65(6 Pt 2):S57–S63. PMID: 17605315.
Article2. Angulo P. Nonalcoholic fatty liver disease. N Engl J Med. 2002; 346:1221–1231. PMID: 11961152.
Article3. Adams LA, Waters OR, Knuiman MW, Elliott RR, Olynyk JK. NAFLD as a risk factor for the development of diabetes and the metabolic syndrome: an eleven-year follow-up study. Am J Gastroenterol. 2009; 104:861–867. PMID: 19293782.
Article4. Schwenzer NF, Springer F, Schraml C, Stefan N, Machann J, Schick F. Non-invasive assessment and quantification of liver steatosis by ultrasound, computed tomography and magnetic resonance. J Hepatol. 2009; 51:433–445. PMID: 19604596.
Article5. Caldwell SH, Oelsner DH, Iezzoni JC, Hespenheide EE, Battle EH, Driscoll CJ. Cryptogenic cirrhosis: clinical characterization and risk factors for underlying disease. Hepatology. 1999; 29:664–669. PMID: 10051466.
Article6. Adams LA, Lymp JF, St Sauver J, Sanderson SO, Lindor KD, Feldstein A, et al. The natural history of nonalcoholic fatty liver disease: a population-based cohort study. Gastroenterology. 2005; 129:113–121. PMID: 16012941.
Article7. Bravo AA, Sheth SG, Chopra S. Liver biopsy. N Engl J Med. 2001; 344:495–500. PMID: 11172192.
Article8. Ratziu V, Charlotte F, Heurtier A, Gombert S, Giral P, Bruckert E, et al. LIDO Study Group. Sampling variability of liver biopsy in nonalcoholic fatty liver disease. Gastroenterology. 2005; 128:1898–1906. PMID: 15940625.
Article9. Rockey DC, Caldwell SH, Goodman ZD, Nelson RC, Smith AD. American Association for the Study of Liver Diseases. Liver biopsy. Hepatology. 2009; 49:1017–1044. PMID: 19243014.
Article10. Noureddin M, Lam J, Peterson MR, Middleton M, Hamilton G, Le TA, et al. Utility of magnetic resonance imaging versus histology for quantifying changes in liver fat in nonalcoholic fatty liver disease trials. Hepatology. 2013; 58:1930–1940. PMID: 23696515.
Article11. Joseph AE, Dewbury KC, McGuire PG. Ultrasound in the detection of chronic liver disease (the “bright liver”). Br J Radiol. 1979; 52:184–188. PMID: 435696.
Article12. Ricci C, Longo R, Gioulis E, Bosco M, Pollesello P, Masutti F, et al. Noninvasive in vivo quantitative assessment of fat content in human liver. J Hepatol. 1997; 27:108–113. PMID: 9252082.
Article13. Dasarathy S, Dasarathy J, Khiyami A, Joseph R, Lopez R, McCullough AJ. Validity of real time ultrasound in the diagnosis of hepatic steatosis: a prospective study. J Hepatol. 2009; 51:1061–1067. PMID: 19846234.
Article14. Strauss S, Gavish E, Gottlieb P, Katsnelson L. Interobserver and intraobserver variability in the sonographic assessment of fatty liver. AJR Am J Roentgenol. 2007; 189:W320–W323. PMID: 18029843.
Article15. Edens MA, van Ooijen PM, Post WJ, Haagmans MJ, Kristanto W, Sijens PE, et al. Ultrasonography to quantify hepatic fat content: validation by 1H magnetic resonance spectroscopy. Obesity (Silver Spring). 2009; 17:2239–2244. PMID: 19461588.
Article16. Mancini M, Prinster A, Annuzzi G, Liuzzi R, Giacco R, Medagli C, et al. Sonographic hepatic-renal ratio as indicator of hepatic steatosis: comparison with (1)H magnetic resonance spectroscopy. Metabolism. 2009; 58:1724–1730. PMID: 19716568.
Article17. Graif M, Yanuka M, Baraz M, Blank A, Moshkovitz M, Kessler A, et al. Quantitative estimation of attenuation in ultrasound video images: correlation with histology in diffuse liver disease. Invest Radiol. 2000; 35:319–324. PMID: 10803673.18. Kim SH, Lee JM, Kim JH, Kim KG, Han JK, Lee KH, et al. Appropriateness of a donor liver with respect to macrosteatosis: application of artificial neural networks to US images--initial experience. Radiology. 2005; 234:793–803. PMID: 15665225.
Article19. Acharya UR, Sree SV, Ribeiro R, Krishnamurthi G, Marinho RT, Sanches J, et al. Data mining framework for fatty liver disease classification in ultrasound: a hybrid feature extraction paradigm. Med Phys. 2012; 39:4255–4264. PMID: 22830759.
Article20. Mihăilescu DM, Gui V, Toma CI, Popescu A, Sporea I. Computer aided diagnosis method for steatosis rating in ultrasound images using random forests. Med Ultrason. 2013; 15:184–190. PMID: 23979613.
Article21. Lee DH, Lee JY, Lee KB, Han JK. Evaluation of hepatic steatosis by using acoustic structure quantification US in a rat model: comparison with pathologic examination and MR spectroscopy. Radiology. 2017; 285:445–453. PMID: 28609203.
Article22. Burckhardt CB. Speckle in ultrasound B-mode scans. IEEE Transactions on Sonics and Ultrasonics. 1978; 25:1–6.
Article23. Wagner RF, Smith SW, Sandrik JM, Lopez H. Statistics of speckle in ultrasound B-scans. IEEE Transactions on Sonics and Ultrasonics. 1983; 30:156–163.
Article24. Tuthill TA, Sperry RH, Parker KJ. Deviations from Rayleigh statistics in ultrasonic speckle. Ultrason Imaging. 1988; 10:81–89. PMID: 3057714.
Article25. Marsman HA, van Werven JR, Nederveen AJ, Ten Kate FJ, Heger M, Stoker J, et al. Noninvasive quantification of hepatic steatosis in rats using 3.0 T 1h-magnetic resonance spectroscopy. J Magn Reson Imaging. 2010; 32:148–154. PMID: 20578022.26. Veteläinen R, van Vliet A, van Gulik TM. Essential pathogenic and metabolic differences in steatosis induced by choline or methione-choline deficient diets in a rat model. J Gastroenterol Hepatol. 2007; 22:1526–1533. PMID: 17716355.
Article27. Hwang I, Lee JM, Lee KB, Yoon JH, Kiefer B, Han JK, et al. Hepatic steatosis in living liver donor candidates: preoperative assessment by using breath-hold triple-echo MR imaging and 1H MR spectroscopy. Radiology. 2014; 271:730–738. PMID: 24533869.28. Park YS, Lee CH, Kim JH, Kim BH, Kim JH, Kim KA, et al. Effect of Gd-EOB-DTPA on hepatic fat quantification using high-speed T2-corrected multi-echo acquisition in (1)H MR spectroscopy. Magn Reson Imaging. 2014; 32:886–890. PMID: 24853467.
Article29. Kleiner DE, Brunt EM, Van Natta M, Behling C, Contos MJ, Cummings OW, et al. Nonalcoholic Steatohepatitis Clinical Research Network. Design and validation of a histological scoring system for nonalcoholic fatty liver disease. Hepatology. 2005; 41:1313–1321. PMID: 15915461.
Article30. Bedossa P, Poynard T. An algorithm for the grading of activity in chronic hepatitis C. The METAVIR Cooperative Study Group. Hepatology. 1996; 24:289–293. PMID: 8690394.
- Full Text Links
- Actions
-
Cited
- CITED
-
- Close
- Share
- Similar articles
-
- Quantitative Evaluation of Hepatic Steatosis Using Advanced Imaging Techniques: Focusing on New Quantitative Ultrasound Techniques
- Imaging evaluation of non-alcoholic fatty liver disease: focused on quantification
- Assessment of Hepatic Steatosis Using Ultrasound-Based Techniques: Focus on Fat Quantification
- Quantitative ultrasound radiofrequency data analysis for the assessment of hepatic steatosis using the controlled attenuation parameter as a reference standard
- A Quantitative Morphologic Analysis of the Rat's Liver in the Postnatal Period


