Yeungnam Univ J Med.
2019 May;36(2):141-147. 10.12701/yujm.2019.00178.
Association between cadmium exposure and hearing impairment: a population-based study in Korean adults
- Affiliations
-
- 1Department of Otorhinolaryngology-Head and Neck Surgery, Kyungpook National University School of Medicine, Daegu, Korea. wjddk0731@naver.com
- KMID: 2449327
- DOI: http://doi.org/10.12701/yujm.2019.00178
Abstract
- BACKGROUND
The present study aimed to evaluate the clinical association between cadmium exposure and hearing impairment among the Korean population.
METHODS
This retrospective cross-sectional study used the data obtained from the Korean National Health and Nutrition Examination Survey were used for our study. Finally, 3,228 participants were included in our study, which were then divided into quartiles based on their blood cadmium levels: first quartile (1Q), second quartile (2Q), third quartile (3Q), and fourth quartile (4Q) groups. The hearing thresholds were measured using an automatic audiometer at 0.5, 1, 2, 3, 4, and 6 kHz. Hearing loss (HL) was defined as >25 dB average hearing threshold (AHT).
RESULTS
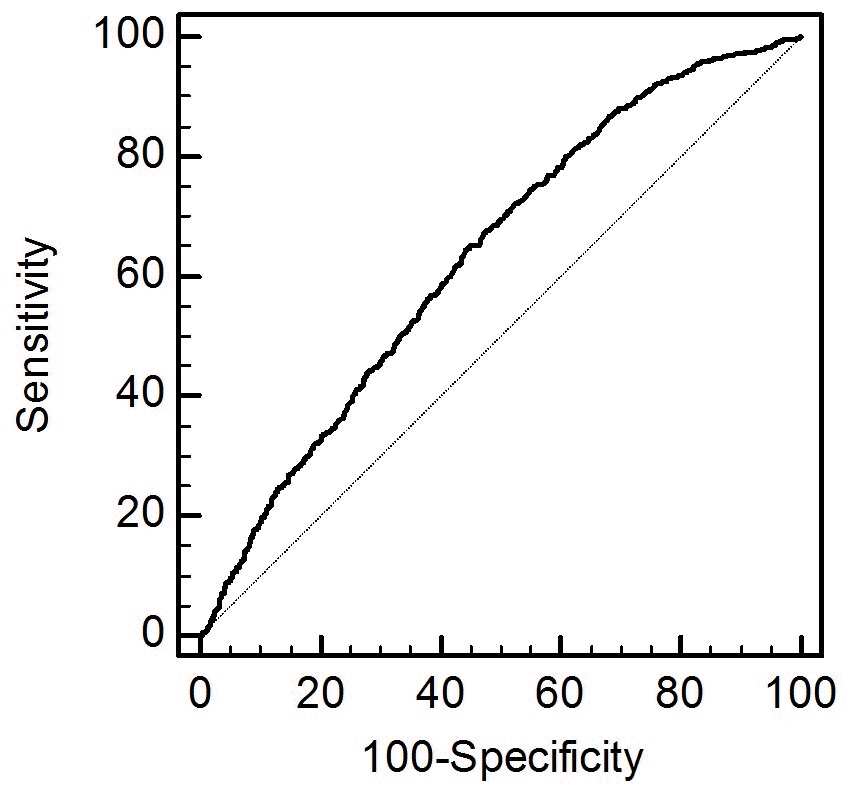
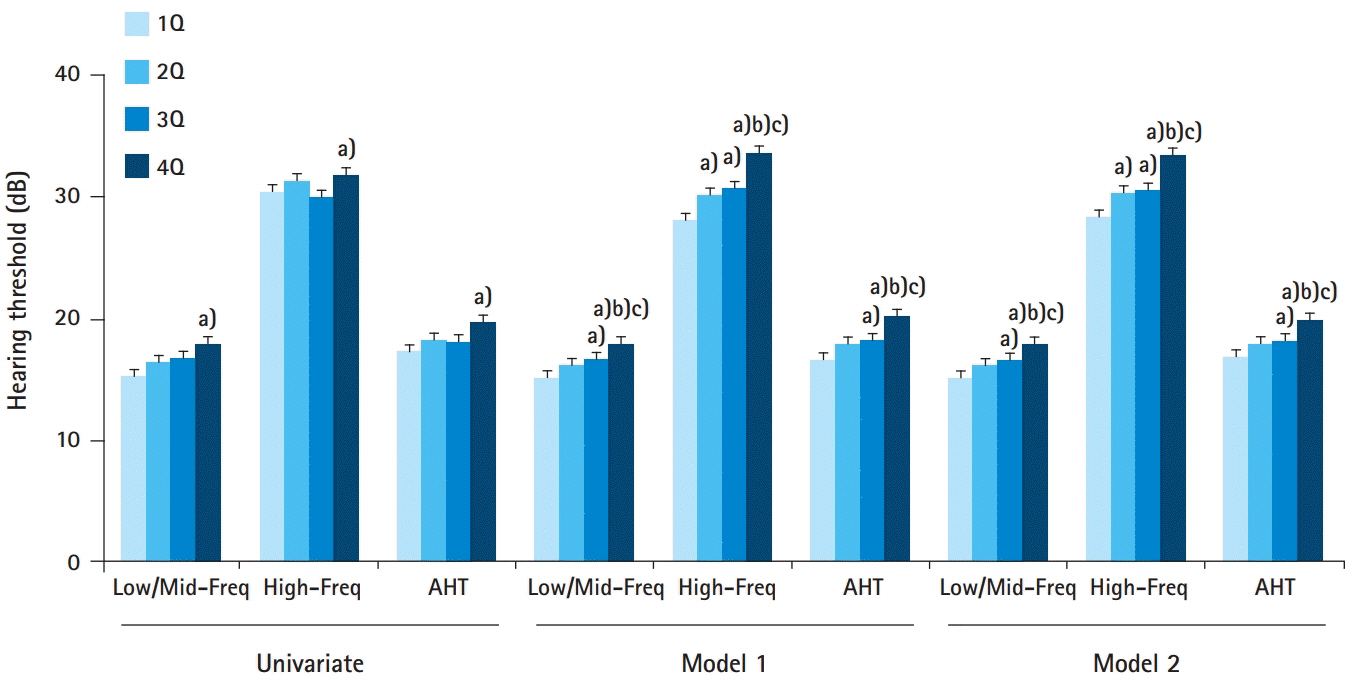
All the groups had 807 participants each. The area under the receiver operating characteristic curves of cadmium level for HL were 0.634 (95% confidence interval [CI], 0.621-0.646). The participants in the 4Q group had higher Low/Mid-Freq, High-Freq, and AHT values than those in the other groups in the multivariate analysis after adjusting for confounding factors. The logistic regression showed that the OR for HL per 1 µg/L increase in cadmium was 1.25 (95% CI, 1.09-1.44; p=0.002) on the multivariate analysis. Moreover, the multivariate logistic regression analyses revealed that the participants in the 4Q group exhibited a 1.59-, 1.38-, and 1.41-fold higher odds for HL than those in the 1Q, 2Q, and 3Q groups, respectively.
CONCLUSION
High cadmium level quartile was associated with increased hearing thresholds and HL among the Korean adult population.
Keyword
MeSH Terms
Figure
Reference
-
References
1. World Health Organization. Prevention of blindness and deafness [Internet]. Geneva: World Health Organization;2018. [cited 2018 April 15]. http://www.who.int/pbd/deafness/estimates/en/.2. Roth JA, Salvi R. Ototoxicity of divalent metals. Neurotox Res. 2016; 30:268–82.
Article3. Ozcaglar HU, Agirdir B, Dinc O, Turhan M, Kilinçarslan S, Oner G. Effects of cadmium on the hearing system. Acta Otolaryngol. 2001; 121:393–7.
Article4. Kim SJ, Jeong HJ, Myung NY, Kim MC, Lee JH, So HS, et al. The protective mechanism of antioxidants in cadmium-induced ototoxicity in vitro and in vivo. Environ Health Perspect. 2008; 116:854–62.5. Choi YH, Hu H, Mukherjee B, Miller J, Park SK. Environmental cadmium and lead exposures and hearing loss in U.S. adults: the National Health and Nutrition Examination Survey, 1999 to 2004. Environ Health Perspect. 2012; 120:1544–50.
Article6. Shiue I. Urinary environmental chemical concentrations and vitamin D are associated with vision, hearing, and balance disorders in the elderly. Environ Int. 2013; 53:41–6.
Article7. Korea Centers for Disease Control and Prevention. [Alcohol drinking] [Internet]. Osong: Korea Centers for Disease Control and Prevention;2017. [cited 2018 April 15]. http://health.mw.go.kr/HealthInfoArea/HealthInfo/View.do?idx=5800&subIdx=4&searchCate=&searchType=&searchKey=&pageNo=&category=1&category_code=301301306&dept=3&sortType=date&page=1&searchField=titleAndSummary&searchWord=.8. Kang JW, Choi HS, Kim K, Choi JY. Dietary vitamin intake correlates with hearing thresholds in the older population: the Korean National Health and Nutrition Examination Survey. Am J Clin Nutr. 2014; 99:1407–13.
Article9. Choi WJ, Han SH. Blood Cadmium is associated with osteoporosis in obese males but not in non-obese males: the Korea National Health and Nutrition Examination Survey 2008-2011. Int J Environ Res Public Health. 2015; 12:12144–57.
Article10. Agency for Toxic Substances and Disease Registry. Public health statement for dadmium [Internet]. Atlanta: Agency for Toxic Substances and Disease Registry;2012. [cited 2018 April 15]. https://www.atsdr.cdc.gov/phs/phs.asp?id=46&tid=15.11. Liu H, Ding D, Sun H, Jiang H, Wu X, Roth JA, et al. Cadmium-induced ototoxicity in rat cochlear organotypic cultures. Neurotox Res. 2014; 26:179–89.
Article12. Thatcher RW, McAlaster R, Lester ML. Evoked potentials related to hair cadmium and lead in children. Ann N Y Acad Sci. 1984; 425:384–90.
Article13. Shargorodsky J, Curhan SG, Henderson E, Eavey R, Curhan GC. Heavy metals exposure and hearing loss in US adolescents. Arch Otolaryngol Head Neck Surg. 2011; 137:1183–9.
Article14. Kang GH, Uhm JY, Choi YG, Kang EK, Kim SY, Choo WO, et al. Environmental exposure of heavy metal (lead and cadmium) and hearing loss: data from the Korea National Health and Nutrition Examination Survey (KNHANES 2010-2013). Ann Occup Environ Med. 2018; 30:22.
Article
- Full Text Links
- Actions
-
Cited
- CITED
-
- Close
- Share
- Similar articles
-
- Environmental exposure of heavy metal (lead and cadmium) and hearing loss: data from the Korea National Health and Nutrition Examination Survey (KNHANES 2010–2013)
- The Relationship between Snoring Noise and Hearing Impairment in Snorers and Their Spouses
- The Association between Involuntary Smoking Exposure with Urine Cotinine Level and Blood Cadmium Level in General Non-Smoking Populations
- New Guides to the Evaluation of Korean Hearing Impairment in 2012
- Assessment of Cadmium in Blood and Urine of Occupationally Exposed Workers and Renal Dysfunction by Cumulative Exposure Estimate


