Korean J Radiol.
2017 ;18(4):674-681. 10.3348/kjr.2017.18.4.674.
The Blood Oxygenation Tâ‚‚* Values of Resectable Esophageal Squamous Cell Carcinomas as Measured by 3T Magnetic Resonance Imaging: Association with Tumor Stage
- Affiliations
-
- 1Sichuan Key Laboratory of Medical Imaging, Affiliated Hospital of North Sichuan Medical College, Nanchong 637000, China. chentw@aliyun.com
- 2Department of Radiology, Affiliated Hospital of North Sichuan Medical College, Nanchong 637000, China.
- 3Department of Radiology, West China Hospital of Sichuan University, Chengdu 610041, China.
- 4Department of Radiology, Wayne State University, Detroit, MI 48201, USA.
- KMID: 2427236
- DOI: http://doi.org/10.3348/kjr.2017.18.4.674
Abstract
OBJECTIVE
To explore the association between the blood oxygenation Tâ‚‚* values of resectable esophageal squamous cell carcinomas (ESCCs) and tumor stages.
MATERIALS AND METHODS
This study included 48 ESCC patients and 20 healthy participants who had undergone esophageal Tâ‚‚*-weighted imaging to obtain Tâ‚‚* values of the tumors and normal esophagi. ESCC patients underwent surgical resections less than one week after imaging. Statistical analyses were performed to identify the association between Tâ‚‚* values of ESCCs and tumor stages.
RESULTS
One-way ANOVA and Student-Newman-Keuls tests revealed that the Tâ‚‚* value could differentiate stage T1 ESCCs (17.7 ± 3.3 ms) from stage T2 and T3 tumors (24.6 ± 2.7 ms and 27.8 ± 5.6 ms, respectively; all p(s) < 0.001). Receiver operating curve (ROC) analysis showed the suitable cutoff Tâ‚‚* value of 21.3 ms for either differentiation. The former statistical tests demonstrated that the Tâ‚‚* value could not differentiate between stages T2 and T3 (24.6 ± 2.7 ms vs. 27.8 ± 5.6 ms, respectively, p > 0.05) or between N stages (N1 vs. N2 vs. N3: 24.7 ± 6.9 ms vs. 25.4 ± 4.5 ms vs. 26.8 ± 3.9 ms, respectively; all p(s) > 0.05). The former tests illustrated that the Tâ‚‚* value could differentiate anatomic stages I and II (18.8 ± 4.8 ms and 26.9 ± 5.9 ms, respectively) or stages I and III (27.3 ± 3.6 ms). ROC analysis depicted the same cutoff Tâ‚‚* value of 21.3 ms for either differentiation. In addition, the Student's t test revealed that the Tâ‚‚* value could determine grouped T stages (T0 vs. T1-3: 17.0 ± 2.9 ms vs. 25.2 ± 6.2 ms; T0-1 vs. T2-3: 17.3 ± 3.0 ms vs. 27.1 ± 5.3 ms; and T0-2 vs. T3: 18.8 ± 4.2 ms vs. 27.8 ± 5.6 ms, all p(s) < 0.001). ROC analysis indicated that the Tâ‚‚* value could detect ESCCs (cutoff, 20 ms), and discriminate between stages T0-1 and T2-3 (cutoff, 21.3 ms) and between T0-2 and T3 (cutoff, 20.4 ms).
CONCLUSION
The Tâ‚‚* value can be an additional quantitative indicator for detecting ESCC except for stage T1 cancer, and can preoperatively discriminate between some T stages and between anatomic stages of this tumor.
Keyword
MeSH Terms
-
Aged
Area Under Curve
Carcinoma, Squamous Cell/*diagnostic imaging/pathology
Case-Control Studies
Esophageal Neoplasms/*diagnostic imaging/pathology
Female
Humans
Image Processing, Computer-Assisted
*Magnetic Resonance Imaging
Male
Middle Aged
Neoplasm Staging
Oxygen/*blood
ROC Curve
Oxygen
Esophageal Squamous Cell Carcinoma
Figure
-
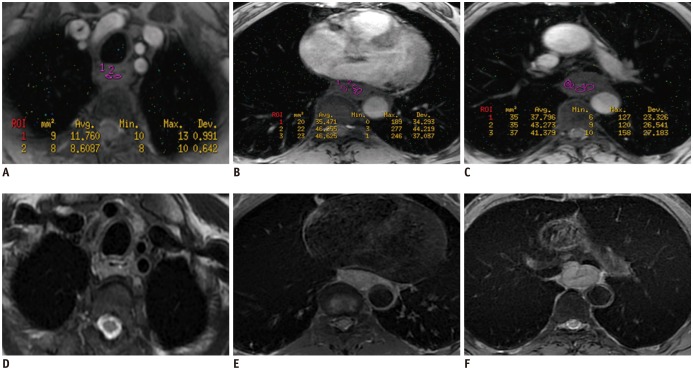
Fig. 1 Representative T2* and T2-weighted images of esophageal squamous cell carcinoma.T2* weighted imaging (T2*WI) (A-C) and T2-weighted imaging (D-F) of stages T1, T2, and T3 esophageal squamous cell carcinoma in 62-year-old male, 67-year-old female and 57-year-old male, respectively. Regions of interest are drawn on T2*WI within each tumor to obtain T2* value.
Reference
-
1. Enzinger PC, Mayer RJ. Esophageal cancer. N Engl J Med. 2003; 349:2241–2252. PMID: 14657432.
Article2. van Hagen P, Hulshof MC, van Lanschot JJ, Steyerberg EW, van Berge Henegouwen MI, Wijnhoven BP, et al. Preoperative chemoradiotherapy for esophageal or junctional cancer. N Engl J Med. 2012; 366:2074–2084. PMID: 22646630.
Article3. Cao LY, Yin Y, Li H, Jiang Y, Zhang HF. Expression and clinical significance of S100A2 and p63 in esophageal carcinoma. World J Gastroenterol. 2009; 15:4183–4188. PMID: 19725154.
Article4. Jemal A, Bray F, Center MM, Ferlay J, Ward E, Forman D. Global cancer statistics. CA Cancer J Clin. 2011; 61:69–90. PMID: 21296855.
Article5. Fitzgerald RC. Review article: Barrett's oesophagus and associated adenocarcinoma--a UK perspective. Aliment Pharmacol Ther. 2004; 20(Suppl 8):45–49.6. Nomura M, Oze I, Kodaira T, Abe T, Komori A, Narita Y, et al. Comparison between surgery and definitive chemoradiotherapy for patients with resectable esophageal squamous cell carcinoma: a propensity score analysis. Int J Clin Oncol. 2016; 21:890–898. PMID: 26980212.
Article7. Kitagawa Y. [Therapeutic strategies for advanced respectable esophageal cancer]. Nihon Geka Gakkai Zasshi. 2008; 109:333–337. PMID: 19068714.8. Fokas E, Rödel C. Definitive, preoperative, and palliative radiation therapy of esophageal cancer. Viszeralmedizin. 2015; 31:347–353. PMID: 26989391.
Article9. Ripley RT, Sarkaria IS, Grosser R, Sima CS, Bains MS, Jones DR, et al. Pretreatment dysphagia in esophageal cancer patients may eliminate the need for staging by endoscopic ultrasonography. Ann Thorac Surg. 2016; 101:226–230. PMID: 26603024.
Article10. Puli SR, Reddy JB, Bechtold ML, Antillon D, Ibdah JA, Antillon MR. Staging accuracy of esophageal cancer by endoscopic ultrasound: a meta-analysis and systematic review. World J Gastroenterol. 2008; 14:1479–1490. PMID: 18330935.
Article11. Rice TW. Clinical staging of esophageal carcinoma. CT, EUS, and PET. Chest Surg Clin N Am. 2000; 10:471–485. PMID: 10967751.12. Riddell AM, Allum WH, Thompson JN, Wotherspoon AC, Richardson C, Brown G. The appearances of oesophageal carcinoma demonstrated on high-resolution, T2-weighted MRI, with histopathological correlation. Eur Radiol. 2007; 17:391–399. PMID: 16941094.
Article13. Riddell AM, Hillier J, Brown G, King DM, Wotherspoon AC, Thompson JN, et al. Potential of surface-coil MRI for staging of esophageal cancer. AJR Am J Roentgenol. 2006; 187:1280–1287. PMID: 17056917.
Article14. Tang MY, Chen TW, Zhang XM, Huang XH. GRE T2*-weighted MRI: principles and clinical applications. Biomed Res Int. 2014; 2014:312142. PMID: 24987676.15. Li Y, Song QW, Sun MY, Wang HQ, Wang S, Wei Q, et al. Use of enhanced T2 star-weighted angiography (ESWAN) and R2* values to distinguish ovarian cysts due to endometriosis from other causes. Abdom Imaging. 2015; 40:1733–1741. PMID: 25504223.16. Howe FA, Robinson SP, Rodrigues LM, Stubbs M, Griffiths JR. Issues in GRE & SE magnetic resonance imaging to probe tumor oxygenation. Adv Exp Med Biol. 2003; 530:441–448. PMID: 14562739.17. Chavhan GB, Babyn PS, Thomas B, Shroff MM, Haacke EM. Principles, techniques, and applications of T2*-based MR imaging and its special applications. Radiographics. 2009; 29:1433–1449. PMID: 19755604.18. Rodrigues LM, Howe FA, Griffiths JR, Robinson SP. Tumor R2* is a prognostic indicator of acute radiotherapeutic response in rodent tumors. J Magn Reson Imaging. 2004; 19:482–488. PMID: 15065173.19. Zhang LJ, Zhang Z, Xu J, Jin N, Luo S, Larson AC, et al. Carbogen gas-challenge blood oxygen level-dependent magnetic resonance imaging in hepatocellular carcinoma: initial results. Oncol Lett. 2015; 10:2009–2014. PMID: 26622788.
Article20. Li D, Wang X, Wang S, Cheng J. Correlation between BOLD-MRI and HIF expression level in renal carcinoma. Int J Clin Exp Pathol. 2015; 8:13759–13763. PMID: 26722605.21. Rakow-Penner R, Daniel B, Glover GH. Detecting blood oxygen level-dependent (BOLD) contrast in the breast. J Magn Reson Imaging. 2010; 32:120–129. PMID: 20578018.
Article22. Alonzi R, Padhani AR, Maxwell RJ, Taylor NJ, Stirling JJ, Wilson JI, et al. Carbogen breathing increases prostate cancer oxygenation: a translational MRI study in murine xenografts and humans. Br J Cancer. 2009; 100:644–648. PMID: 19190629.
Article23. Pennathur A, Gibson MK, Jobe BA, Luketich JD. Oesophageal carcinoma. Lancet. 2013; 381:400–412. PMID: 23374478.
Article24. Li Z, Rice TW. Diagnosis and staging of cancer of the esophagus and esophagogastric junction. Surg Clin North Am. 2012; 92:1105–1126. PMID: 23026272.
Article25. Bland JM, Altman DG. Statistical methods for assessing agreement between two methods of clinical measurement. Lancet. 1986; 1:307–310. PMID: 2868172.
Article26. Quint LE, Bogot NR. Staging esophageal cancer. Cancer Imaging. 2008; 8:S33–S42. PMID: 18852079.
Article27. Butler JM, Kobayashi H, Rafii S. Instructive role of the vascular niche in promoting tumour growth and tissue repair by angiocrine factors. Nat Rev Cancer. 2010; 10:138–146. PMID: 20094048.
Article28. Hanahan D, Weinberg RA. Hallmarks of cancer: the next generation. Cell. 2011; 144:646–674. PMID: 21376230.
Article29. Gholamin M, Moaven O, Memar B, Farshchian M, Naseh H, Malekzadeh R, et al. Overexpression and interactions of interleukin-10, transforming growth factor beta, and vascular endothelial growth factor in esophageal squamous cell carcinoma. World J Surg. 2009; 33:1439–1445. PMID: 19440651.30. Wang W, Sun QK, He YF, Ma DC, Xie MR, Ji CS, et al. Overexpression of periostin is significantly correlated to the tumor angiogenesis and poor prognosis in patients with esophageal squamous cell carcinoma. Int J Clin Exp Pathol. 2014; 7:593–601. PMID: 24551279.31. Koga T, Shibahara K, Kabashima A, Sumiyoshi Y, Kimura Y, Takahashi I, et al. Overexpression of cyclooxygenase-2 and tumor angiogenesis in human gastric cancer. Hepatogastroenterology. 2004; 51:1626–1630. PMID: 15532792.32. Kumagai Y, Sobajima J, Higashi M, Ishiguro T, Fukuchi M, Ishibashi K, et al. Coexpression of COX-2 and iNOS in angiogenesis of superficial esophageal squamous cell carcinoma. Int Surg. 2015; 100:733–743. PMID: 25875558.
Article33. Pedersen M, Dissing TH, Mørkenborg J, Stødkilde-Jørgensen H, Hansen LH, Pedersen LB, et al. Validation of quantitative BOLD MRI measurements in kidney: application to unilateral ureteral obstruction. Kidney Int. 2005; 67:2305–2312. PMID: 15882272.
Article34. Van Meir E. Hypoxia-mediated selection of cells with diminished apoptotic potential to solid tumours. Neurosurgery. 1996; 39:878–879. PMID: 8880787.35. He Q, Xu RZ, Shkarin P, Pizzorno G, Lee-French CH, Rothman DL, et al. Magnetic resonance spectroscopic imaging of tumor metabolic markers for cancer diagnosis, metabolic phenotyping, and characterization of tumor microenvironment. Dis Markers. 2003-2004; 19:69–94.
Article36. Arakelyan L, Vainstein V, Agur Z. A computer algorithm describing the process of vessel formation and maturation, and its use for predicting the effects of anti-angiogenic and anti-maturation therapy on vascular tumor growth. Angiogenesis. 2002; 5:203–214. PMID: 12831061.37. Boucher Y, Jain RK. Microvascular pressure is the principal driving force for interstitial hypertension in solid tumors: implications for vascular collapse. Cancer Res. 1992; 52:5110–5114. PMID: 1516068.
- Full Text Links
-
- Actions
-
Cited
- CITED
-
- Close
- Share
-
- Similar articles
-
- Squamous Cell Carcinoma of the Pancreas: A Case Report
- High field strength magnetic resonance imaging of abdominal diseases
- Cutaneous Metastasis of Esophageal Squamous Cell Carcinoma Mimicking Benign Soft Tissue Tumor
- Introduction to high field strength magnetic resonance imaging
- A study on the comparision of various imaging methods for the staging of renal cell carcinoma
