Improved Diagnostic Accuracy of Alzheimer's Disease by Combining Regional Cortical Thickness and Default Mode Network Functional Connectivity: Validated in the Alzheimer's Disease Neuroimaging Initiative Set
- Affiliations
-
- 1Department of Radiology and Research Institute of Radiology, University of Ulsan College of Medicine, Asan Medical Center, Seoul 05505, Korea. sjkimjb@amc.seoul.kr
- 2Biomedical Engineering, Ulsan National Institute of Science and Technology, Ulsan 44919, Korea.
- 3Department of Neurology, University of Ulsan College of Medicine, Asan Medical Center, Seoul 05505, Korea.
- KMID: 2427208
- DOI: http://doi.org/10.3348/kjr.2017.18.6.983
Abstract
OBJECTIVE
To identify potential imaging biomarkers of Alzheimer's disease by combining brain cortical thickness (CThk) and functional connectivity and to validate this model's diagnostic accuracy in a validation set.
MATERIALS AND METHODS
Data from 98 subjects was retrospectively reviewed, including a study set (n = 63) and a validation set from the Alzheimer's Disease Neuroimaging Initiative (n = 35). From each subject, data for CThk and functional connectivity of the default mode network was extracted from structural T1-weighted and resting-state functional magnetic resonance imaging. Cortical regions with significant differences between patients and healthy controls in the correlation of CThk and functional connectivity were identified in the study set. The diagnostic accuracy of functional connectivity measures combined with CThk in the identified regions was evaluated against that in the medial temporal lobes using the validation set and application of a support vector machine.
RESULTS
Group-wise differences in the correlation of CThk and default mode network functional connectivity were identified in the superior temporal (p < 0.001) and supramarginal gyrus (p = 0.007) of the left cerebral hemisphere. Default mode network functional connectivity combined with the CThk of those two regions were more accurate than that combined with the CThk of both medial temporal lobes (91.7% vs. 75%).
CONCLUSION
Combining functional information with CThk of the superior temporal and supramarginal gyri in the left cerebral hemisphere improves diagnostic accuracy, making it a potential imaging biomarker for Alzheimer's disease.
Keyword
MeSH Terms
Figure
-
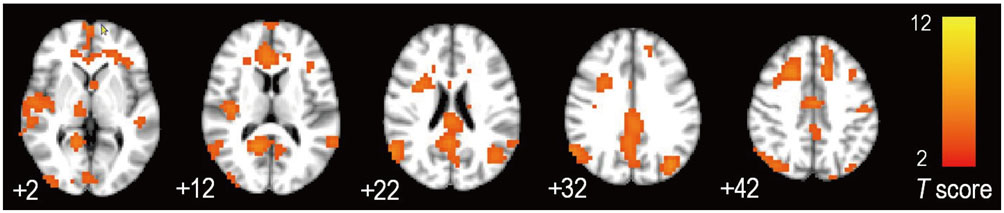
Fig. 1 Group-difference map of default mode network between AD and HC. Axial images revealing default mode network identified as network with differences between patients with AD and HCs, using independent component analysis. Numbers beneath each image refer to z coordinates in Talairach space. T score bars are shown on right. AD = Alzheimer's disease, HC = healthy control
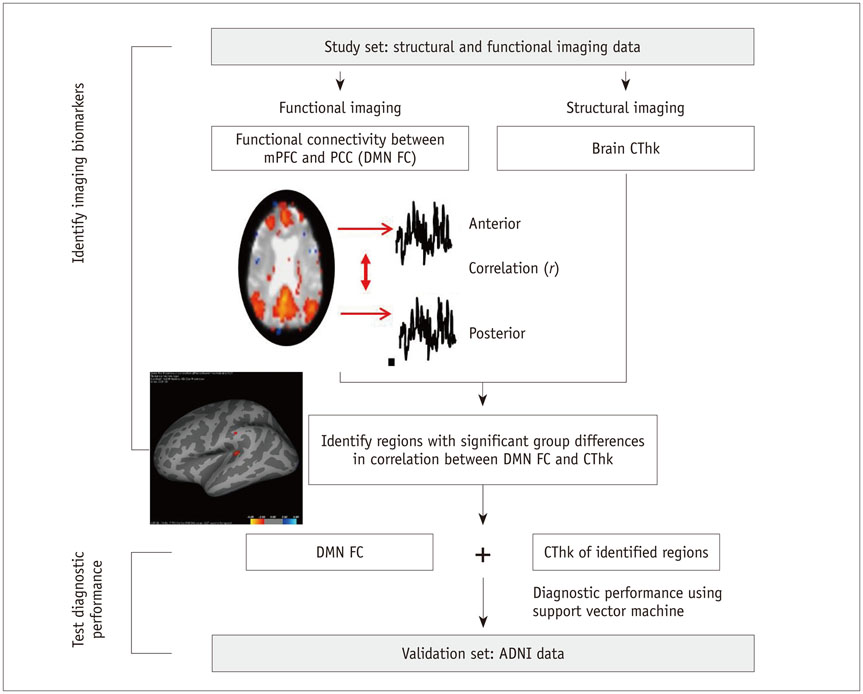
Fig. 2 Schematic diagram for identifying regions with group-differences between AD and HC. For each subject, correlation coefficient (r) between mPFC and PCC FC was extracted. Group analysis was performed to identify locations with significant differences between patients with AD and HC in terms of correlation of 1) r value of mPFC-PCC FC and 2) CThk. Diagnostic performance of combining mPFC-PCC FC and CThk of identified locations was then tested in validation set using support vector machine. ADNI = Alzheimer's Disease Neuroimaging Initiative, CThk = cortical thickness, DMN = default mode network, FC = functional connectivity, mPFC = medial prefrontal cortex, PCC = posterior cingulate cortex
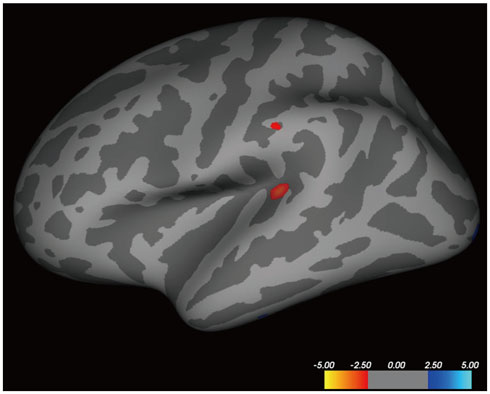
Fig. 3 Regions with significant differences between AD and HC groups. Inflated atlas brain image shows regions of left hemisphere with significant differences in cortical thickness between patients with AD and HCs, after accounting for mPFC-PCC FC and brain cortical thickness.
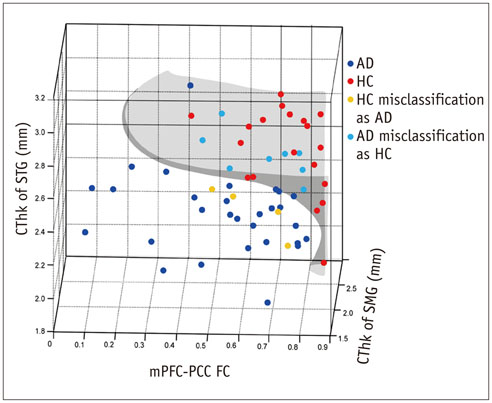
Fig. 4 Support vector machine model in study set. Plots represent support vectors for discriminating between patients with AD and HCs in study set. Subjects and hyperplane (gray plane) are projected in three dimensions. Resulting hyperplane is optimal tradeoff between high model generalization and discrimination accuracy. SMG = supramarginal gyrus, STG = superior temporal gyrus
Cited by 1 articles
-
Age of Data in Contemporary Research Articles Published in Representative General Radiology Journals
Ji Hun Kang, Dong Hwan Kim, Seong Ho Park, Jung Hwan Baek
Korean J Radiol. 2018;19(6):1172-1178. doi: 10.3348/kjr.2018.19.6.1172.
Reference
-
1. Buckner RL, Snyder AZ, Shannon BJ, LaRossa G, Sachs R, Fotenos AF, et al. Molecular, structural, and functional characterization of Alzheimer’s disease: evidence for a relationship between default activity, amyloid, and memory. J Neurosci. 2005; 25:7709–7717.2. Gili T, Cercignani M, Serra L, Perri R, Giove F, Maraviglia B, et al. Regional brain atrophy and functional disconnection across Alzheimer’s disease evolution. J Neurol Neurosurg Psychiatry. 2011; 82:58–66.3. Noh Y, Jeon S, Lee JM, Seo SW, Kim GH, Cho H, et al. Anatomical heterogeneity of Alzheimer disease: based on cortical thickness on MRIs. Neurology. 2014; 83:1936–1944.4. Chhatwal JP, Schultz AP, Johnson K, Benzinger TL, Jack C Jr, Ances BM, et al. Impaired default network functional connectivity in autosomal dominant Alzheimer disease. Neurology. 2013; 81:736–744.5. Liu Y, Yu C, Zhang X, Liu J, Duan Y, Alexander-Bloch AF, et al. Impaired long distance functional connectivity and weighted network architecture in Alzheimer’s disease. Cereb Cortex. 2014; 24:1422–1435.6. Toussaint PJ, Maiz S, Coynel D, Doyon J, Messé A, de Souza LC, et al. Characteristics of the default mode functional connectivity in normal ageing and Alzheimer’s disease using resting state fMRI with a combined approach of entropybased and graph theoretical measurements. Neuroimage. 2014; 101:778–786.7. Bozzali M, Parker GJ, Serra L, Embleton K, Gili T, Perri R, et al. Anatomical connectivity mapping: a new tool to assess brain disconnection in Alzheimer’s disease. Neuroimage. 2011; 54:2045–2051.8. Zhao X, Liu Y, Wang X, Liu B, Xi Q, Guo Q, et al. Disrupted small-world brain networks in moderate Alzheimer’s disease: a resting-state FMRI study. PLoS One. 2012; 7:e33540.9. Hafkemeijer A, van der Grond J, Rombouts SA. Imaging the default mode network in aging and dementia. Biochim Biophys Acta. 2012; 1822:431–441.10. Petrella JR, Sheldon FC, Prince SE, Calhoun VD, Doraiswamy PM. Default mode network connectivity in stable vs progressive mild cognitive impairment. Neurology. 2011; 76:511–517.11. Shaffer JL, Petrella JR, Sheldon FC, Choudhury KR, Calhoun VD, Coleman RE, et al. Predicting cognitive decline in subjects at risk for Alzheimer disease by using combined cerebrospinal fluid, MR imaging, and PET biomarkers. Radiology. 2013; 266:583–591.12. Greicius MD, Krasnow B, Reiss AL, Menon V. Functional connectivity in the resting brain: a network analysis of the default mode hypothesis. Proc Natl Acad Sci U S A. 2003; 100:253–258.13. Kenny ER, Blamire AM, Firbank MJ, O’Brien JT. Functional connectivity in cortical regions in dementia with Lewy bodies and Alzheimer’s disease. Brain. 2012; 135(Pt 2):569–581.14. McKhann GM, Knopman DS, Chertkow H, Hyman BT, Jack CR Jr, Kawas CH, et al. The diagnosis of dementia due to Alzheimer’s disease: recommendations from the National Institute on Aging-Alzheimer’s Association workgroups on diagnostic guidelines for Alzheimer’s disease. Alzheimers Dement. 2011; 7:263–269.15. Fischl B, Salat DH, Busa E, Albert M, Dieterich M, Haselgrove C, et al. Whole brain segmentation: automated labeling of neuroanatomical structures in the human brain. Neuron. 2002; 33:341–355.16. Calhoun VD, Adali T, Pearlson GD, Pekar JJ. A method for making group inferences from functional MRI data using independent component analysis. Hum Brain Mapp. 2001; 14:140–151.17. Greicius MD, Srivastava G, Reiss AL, Menon V. Default-mode network activity distinguishes Alzheimer’s disease from healthy aging: evidence from functional MRI. Proc Natl Acad Sci U S A. 2004; 101:4637–4642.18. Capparuccia R, De Leone R, Marchitto E. Integrating support vector machines and neural networks. Neural Netw. 2007; 20:590–597.19. Akbari H, Macyszyn L, Da X, Wolf RL, Bilello M, Verma R, et al. Pattern analysis of dynamic susceptibility contrast-enhanced MR imaging demonstrates peritumoral tissue heterogeneity. Radiology. 2014; 273:502–510.20. Salas-Gonzalez D, Górriz JM, Ramírez J, López M, Alvarez I, Segovia F, et al. Computer-aided diagnosis of Alzheimer’s disease using support vector machines and classification trees. Phys Med Biol. 2010; 55:2807–2817.21. Sepulcre J, Liu H, Talukdar T, Martincorena I, Yeo BT, Buckner RL. The organization of local and distant functional connectivity in the human brain. PLoS Comput Biol. 2010; 6:e1000808.22. Tomasi D, Volkow ND. Functional connectivity density mapping. Proc Natl Acad Sci U S A. 2010; 107:9885–9890.23. Prescott JW, Guidon A, Doraiswamy PM, Roy Choudhury K, Liu C, Petrella JR. Alzheimer's Disease Neuroimaging Initiative. The Alzheimer structural connectome: changes in cortical network topology with increased amyloid plaque burden. Radiology. 2014; 273:175–184.24. Salthouse TA. Neuroanatomical substrates of age-related cognitive decline. Psychol Bull. 2011; 137:753–784.25. Ward AM, Mormino EC, Huijbers W, Schultz AP, Hedden T, Sperling RA. Relationships between default-mode network connectivity, medial temporal lobe structure, and age-related memory deficits. Neurobiol Aging. 2015; 36:265–272.26. Kahn I, Andrews-Hanna JR, Vincent JL, Snyder AZ, Buckner RL. Distinct cortical anatomy linked to subregions of the medial temporal lobe revealed by intrinsic functional connectivity. J Neurophysiol. 2008; 100:129–139.27. Lacy JW, Stark CE. Intrinsic functional connectivity of the human medial temporal lobe suggests a distinction between adjacent MTL cortices and hippocampus. Hippocampus. 2012; 22:2290–2302.28. Ward AM, Schultz AP, Huijbers W, Van Dijk KR, Hedden T, Sperling RA. The parahippocampal gyrus links the defaultmode cortical network with the medial temporal lobe memory system. Hum Brain Mapp. 2014; 35:1061–1073.29. Pasquini L, Scherr M, Tahmasian M, Myers NE, Ortner M, Kurz A, et al. Increased intrinsic activity of medial-temporal lobe subregions is associated with decreased cortical thickness of medial-parietal areas in patients with Alzheimer’s disease dementia. J Alzheimers Dis. 2016; 51:313–326.30. Alstott J, Breakspear M, Hagmann P, Cammoun L, Sporns O. Modeling the impact of lesions in the human brain. PLoS Comput Biol. 2009; 5:e1000408.31. Gazzaniga MS. Cerebral specialization and interhemispheric communication: does the corpus callosum enable the human condition? Brain. 2000; 123(Pt 7):1293–1326.32. Vecchio F, Miraglia F, Curcio G, Altavilla R, Scrascia F, Giambattistelli F, et al. Cortical brain connectivity evaluated by graph theory in dementia: a correlation study between functional and structural data. J Alzheimers Dis. 2015; 45:745–756.33. Ramírez J, Górriz JM, Salas-Gonzalez D, Romero A, López M, Álvarez I, et al. Computer-aided diagnosis of Alzheimer’s type dementia combining support vector machines and discriminant set of features. Inf Sci. 2013; 237:59–72.34. Wollman DE, Prohovnik I. Sensitivity and specificity of neuroimaging for the diagnosis of Alzheimer’s disease. Dialogues Clin Neurosci. 2003; 5:89–99.
- Full Text Links
-
- Actions
-
Cited
- CITED
-
- Close
- Share
-
- Similar articles
-
- The Relationship between Neuropsychiatric Symptoms and Default-Mode Network Connectivity in Alzheimer’s Disease
- Neuroimaging Markers for Alzheimer's Disease and Mild Cognitive Impairment in Alzheimer's Disease Neuroimaging Initiative (ADNI)
- Functional Connectivity Change Associated With Apolipoprotein E Allotypes Precedes Structural Connectivity and Neurodegeneration in Cognitive Normal Older Adults Without Cerebral Aβ Deposition
- Functional Connectivity of the Hippocampus in Early- and vs. Late-Onset Alzheimer's Disease
- Three Large-Scale Functional Brain Networks from Resting-State Functional MRI in Subjects with Different Levels of Cognitive Impairment
