Impact of Liver Fibrosis and Fatty Liver on T1rho Measurements: A Prospective Study
- Affiliations
-
- 1Department of Radiology, Tianjin First Center Hospital, Tianjin 300192, China. shenwen66happy@163.com
- 2Clinical Science, Philips Healthcare, Beijing 100600, China.
- 3Department of Hepatology, Tianjin Second People's Hospital, Tianjin 300192, China.
- KMID: 2427199
- DOI: http://doi.org/10.3348/kjr.2017.18.6.898
Abstract
OBJECTIVE
To investigate the liver T1rho values for detecting fibrosis, and the potential impact of fatty liver on T1rho measurements.
MATERIALS AND METHODS
This study included 18 healthy subjects, 18 patients with fatty liver, and 18 patients with liver fibrosis, who underwent T1rho MRI and mDIXON collections. Liver T1rho, proton density fat fraction (PDFF) and T2* values were measured and compared among the three groups. Receiver operating characteristic (ROC) curve analysis was performed to evaluate the T1rho values for detecting liver fibrosis. Liver T1rho values were correlated with PDFF, T2* values and clinical data.
RESULTS
Liver T1rho and PDFF values were significantly different (p < 0.001), whereas the T2* (p = 0.766) values were similar, among the three groups. Mean liver T1rho values in the fibrotic group (52.6 ± 6.8 ms) were significantly higher than those of healthy subjects (44.9 ± 2.8 ms, p < 0.001) and fatty liver group (45.0 ± 3.5 ms, p < 0.001). Mean liver T1rho values were similar between healthy subjects and fatty liver group (p = 0.999). PDFF values in the fatty liver group (16.07 ± 10.59%) were significantly higher than those of healthy subjects (1.43 ± 1.36%, p < 0.001) and fibrosis group (1.07 ± 1.06%, p < 0.001). PDFF values were similar in healthy subjects and fibrosis group (p = 0.984). Mean T1rho values performed well to detect fibrosis at a threshold of 49.5 ms (area under the ROC curve, 0.855), had a moderate correlation with liver stiffness (r = 0.671, p = 0.012), and no correlation with PDFF, T2* values, subject age, or body mass index (p > 0.05).
CONCLUSION
T1rho MRI is useful for noninvasive detection of liver fibrosis, and may not be affected with the presence of fatty liver.
Keyword
MeSH Terms
-
Adult
Aged
Area Under Curve
Body Mass Index
Female
Healthy Volunteers
Humans
Image Processing, Computer-Assisted
Liver Cirrhosis/*diagnosis/diagnostic imaging
*Magnetic Resonance Imaging
Male
Middle Aged
Non-alcoholic Fatty Liver Disease/*diagnosis/diagnostic imaging
Prospective Studies
ROC Curve
Sensitivity and Specificity
Young Adult
Figure
-
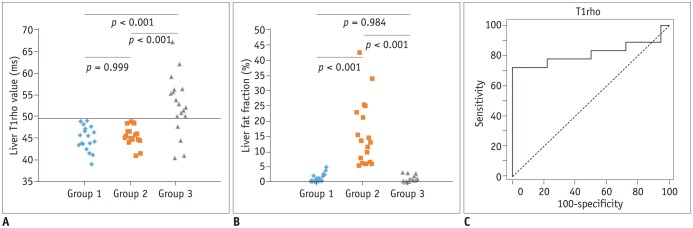
Fig. 1 Liver T1rho value, liver fat fraction comparison among three groups and ROC curve of T1rho for predicting liver fibrosis.A. T1rho values of group 1 (healthy control subjects) were similar to those of group 2 (patients with simple fatty liver, p = 0.999). T1rho values in group 3 (patients with liver fibrosis) were significantly higher than those of group 1 (p < 0.001) and group 2 (p < 0.001). In group 3, T1rho measurements of 4 patients overlapped with those of group 1 or 2. B. Liver fat fraction of group 1 were similar to those of group 3 (p = 0.984). Liver fat fraction in group 2 were significantly higher than those of group 1 (p < 0.001) and group 3 (p < 0.001). C. According to ROC analysis at threshold of 49.5 ms, sensitivity and specificity of T1rho in predicting liver fibrosis were 77.8% and 100%, respectively. Area under ROC curve was 0.855. ROC = receiver operating characteristic
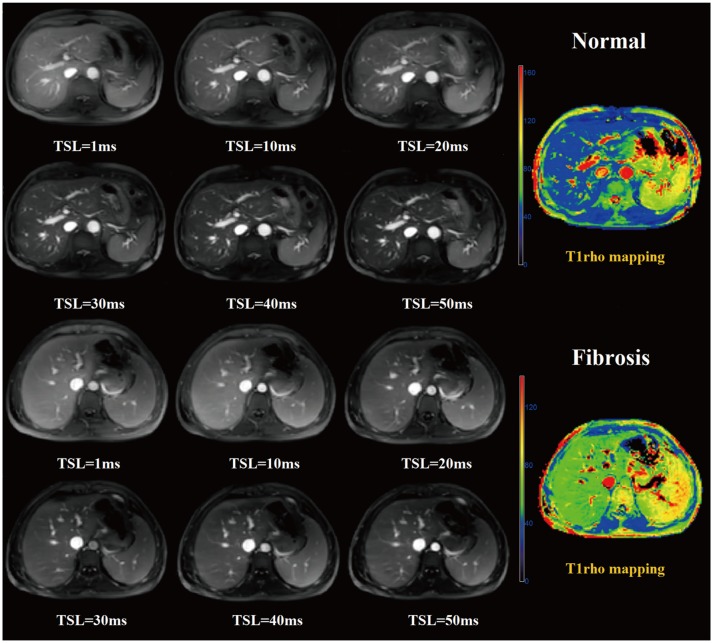
Fig. 2 Examples of healthy subject and fibrosis patient T1rho-weighted images and T1rho map.Upper (row 1 and 2) and lower (row 3 and 4) two rows show liver T1rho-weighted images acquired with times of spin lock pulse (TSL) of 1–50 ms, and T1rho map in 61-year-old normal control subject and 21-year-old patient with fibrosis. Fibrosis liver tissue demonstrates higher signal intensity in T1rho-weighted images and T1rho values in T1rho map, than normal liver tissue.
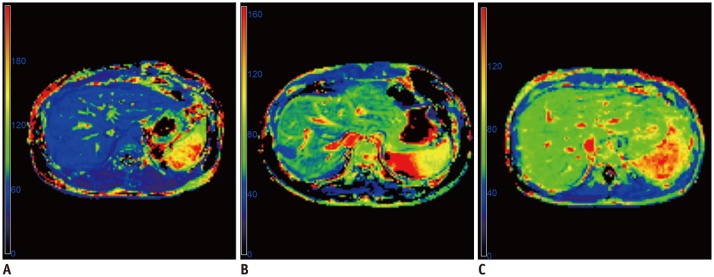
Fig. 3 Example of T1rho map in fibrosis patients with different liver stiffness measurement (LSM).A. T1rho map in 35-year-old male: mean T1rho value is 50.6 ms, LSM is 7.2 kPa. B. T1rho map in 33-year-old male: mean T1rho value is 54.1 ms, LSM is 10.6 kPa. C. T1rho map in 28-year-old female: mean T1rho value is 62.7 ms, LSM is 17.3 kPa.
Cited by 4 articles
-
Age of Data in Contemporary Research Articles Published in Representative General Radiology Journals
Ji Hun Kang, Dong Hwan Kim, Seong Ho Park, Jung Hwan Baek
Korean J Radiol. 2018;19(6):1172-1178. doi: 10.3348/kjr.2018.19.6.1172.The Diagnostic Performance of Liver MRI without Intravenous Contrast for Detecting Hepatocellular Carcinoma: A Case-Controlled Feasibility Study
Seunghee Han, Joon-Il Choi, Michael Yong Park, Moon Hyung Choi, Sung Eun Rha, Young Joon Lee
Korean J Radiol. 2018;19(4):568-577. doi: 10.3348/kjr.2018.19.4.568.Histogram Analysis of Diffusion Kurtosis Magnetic Resonance Imaging for Diagnosis of Hepatic Fibrosis
Ruo-Fan Sheng, Kai-Pu Jin, Li Yang, He-Qing Wang, Hao Liu, Yuan Ji, Cai-Xia Fu, Meng-Su Zeng
Korean J Radiol. 2018;19(5):916-922. doi: 10.3348/kjr.2018.19.5.916.Correlation between Non-Alcoholic Fatty Liver Disease and Visceral Adipose Tissue in Non-Obese Chinese Adults: A CT Evaluation
Ai-Hong Yu, Yang-Yang Duan-Mu, Yong Zhang, Ling Wang, Zhe Guo, Yong-Qiang Yu, Yu-Sheng Wang, Xiao-Guang Cheng
Korean J Radiol. 2018;19(5):923-929. doi: 10.3348/kjr.2018.19.5.923.
Reference
-
1. Su TH, Kao JH, Liu CJ. Molecular mechanism and treatment of viral hepatitis-related liver fibrosis. Int J Mol Sci. 2014; 15:10578–10604. PMID: 24927147.
Article2. Wallace K, Burt AD, Wright MC. Liver fibrosis. Biochem J. 2008; 411:1–18. PMID: 18333835.
Article3. Marcellin P, Gane E, Buti M, Afdhal N, Sievert W, Jacobson IM, et al. Regression of cirrhosis during treatment with tenofovir disoproxil fumarate for chronic hepatitis B: a 5-year open-label follow-up study. Lancet. 2013; 381:468–475. PMID: 23234725.
Article4. Sarin SK, Kumar M, Lau GK, Abbas Z, Chan HL, Chen CJ, et al. Asian-Pacific clinical practice guidelines on the management of hepatitis B: a 2015 update. Hepatol Int. 2016; 10:1–98.
Article5. Bedossa P, Dargère D, Paradis V. Sampling variability of liver fibrosis in chronic hepatitis C. Hepatology. 2003; 38:1449–1457. PMID: 14647056.
Article6. Standish RA, Cholongitas E, Dhillon A, Burroughs AK, Dhillon AP. An appraisal of the histopathological assessment of liver fibrosis. Gut. 2006; 55:569–578. PMID: 16531536.
Article7. Venkatesh SK, Wang G, Lim SG, Wee A. Magnetic resonance elastography for the detection and staging of liver fibrosis in chronic hepatitis B. Eur Radiol. 2014; 24:70–78. PMID: 23928932.
Article8. Sagir A, Erhardt A, Schmitt M, Häussinger D. Transient elastography is unreliable for detection of cirrhosis in patients with acute liver damage. Hepatology. 2008; 47:592–595. PMID: 18098325.
Article9. Calvaruso V, Cammà C, Di Marco V, Maimone S, Bronte F, Enea M, et al. Fibrosis staging in chronic hepatitis C: analysis of discordance between transient elastography and liver biopsy. J Viral Hepat. 2010; 17:469–474. PMID: 19780940.
Article10. Tsochatzis EA, Gurusamy KS, Ntaoula S, Cholongitas E, Davidson BR, Burroughs AK. Elastography for the diagnosis of severity of fibrosis in chronic liver disease: a meta-analysis of diagnostic accuracy. J Hepatol. 2011; 54:650–659. PMID: 21146892.
Article11. Ronot M, Asselah T, Paradis V, Michoux N, Dorvillius M, Baron G, et al. Liver fibrosis in chronic hepatitis C virus infection: differentiating minimal from intermediate fibrosis with perfusion CT. Radiology. 2010; 256:135–142. PMID: 20574090.
Article12. Wang L, Fan J, Ding X, Sun J, Zhang M. Assessment of liver fibrosis in the early stages with perfusion CT. Int J Clin Exp Med. 2015; 8:15276–15282. PMID: 26629014.13. Oğul H, Kantarcı M, Genç B, Pirimoğlu B, Cullu N, Kızrak Y, et al. Perfusion CT imaging of the liver: review of clinical applications. Diagn Interv Radiol. 2014; 20:379–389. PMID: 24834487.
Article14. Ding Y, Rao S, Yang L, Chen C, Zeng M. Comparison of the effect of region-of-interest methods using gadoxetic acid-enhanced MR imaging with diffusion-weighted imaging on staging hepatic fibrosis. Radiol Med. 2016; 121:821–827. PMID: 27449761.
Article15. Watanabe H, Kanematsu M, Goshima S, Kondo H, Onozuka M, Moriyama N, et al. Staging hepatic fibrosis: comparison of gadoxetate disodium-enhanced and diffusion-weighted MR imaging--preliminary observations. Radiology. 2011; 259:142–150. PMID: 21248234.
Article16. Kim H, Park SH, Kim EK, Kim MJ, Park YN, Park HJ, et al. Histogram analysis of gadoxetic acid-enhanced MRI for quantitative hepatic fibrosis measurement. PLoS One. 2014; 9:e114224. PMID: 25460180.
Article17. Wang QB, Zhu H, Liu HL, Zhang B. Performance of magnetic resonance elastography and diffusion-weighted imaging for the staging of hepatic fibrosis: a meta-analysis. Hepatology. 2012; 56:239–247. PMID: 22278368.
Article18. Yeom SK, Lee CH, Cha SH, Park CM. Prediction of liver cirrhosis, using diagnostic imaging tools. World J Hepatol. 2015; 7:2069–2079. PMID: 26301049.
Article19. Shi Y, Guo Q, Xia F, Dzyubak B, Glaser KJ, Li Q, et al. MR elastography for the assessment of hepatic fibrosis in patients with chronic hepatitis B infection: does histologic necroinflammation influence the measurement of hepatic stiffness? Radiology. 2014; 273:88–98. PMID: 24893048.
Article20. Liu J, Ji Y, Ai H, Ning B, Zhao J, Zhang Y, et al. Liver shear-wave velocity and serum fibrosis markers to diagnose hepatic fibrosis in patients with chronic viral hepatitis B. Korean J Radiol. 2016; 17:396–404. PMID: 27134527.
Article21. Yoo H, Lee JM, Yoon JH, Lee DH, Chang W, Han JK. Prospective comparison of liver stiffness measurements between two point shear wave elastography methods: virtual touch quantification and elastography point quantification. Korean J Radiol. 2016; 17:750–757. PMID: 27587964.
Article22. Markkola AT, Aronen HJ, Paavonen T, Hopsu E, Sipilä LM, Tanttu JI, et al. Spin lock and magnetization transfer imaging of head and neck tumors. Radiology. 1996; 200:369–375. PMID: 8685328.
Article23. Santyr GE, Henkelman RM, Bronskill MJ. Spin locking for magnetic resonance imaging with application to human breast. Magn Reson Med. 1989; 12:25–37. PMID: 2607958.
Article24. Sepponen RE, Pohjonen JA, Sipponen JT, Tanttu JI. A method for T1 rho imaging. J Comput Assist Tomogr. 1985; 9:1007–1011. PMID: 4056129.25. Wang YX, Yuan J, Chu ES, Go MY, Huang H, Ahuja AT, et al. T1rho MR imaging is sensitive to evaluate liver fibrosis: an experimental study in a rat biliary duct ligation model. Radiology. 2011; 259:712–719. PMID: 21436087.26. Zhao F, Wang YX, Yuan J, Deng M, Wong HL, Chu ES, et al. MR T1ρ as an imaging biomarker for monitoring liver injury progression and regression: an experimental study in rats with carbon tetrachloride intoxication. Eur Radiol. 2012; 22:1709–1716. PMID: 22752522.
Article27. Jiang J, Huang B, Bin G, Chen S, Feng F, Zou L. An experimental study on the assessment of rabbit hepatic fibrosis by using magnetic resonance T1ρ imaging. Magn Reson Imaging. 2016; 34:308–311. PMID: 26597838.
Article28. Rauscher I, Eiber M, Ganter C, Martirosian P, Safi W, Umgelter A, et al. Evaluation of T1ρ as a potential MR biomarker for liver cirrhosis: comparison of healthy control subjects and patients with liver cirrhosis. Eur J Radiol. 2014; 83:900–904. PMID: 24661616.29. Allkemper T, Sagmeister F, Cicinnati V, Beckebaum S, Kooijman H, Kanthak C, et al. Evaluation of fibrotic liver disease with whole-liver T1ρ MR imaging: a feasibility study at 1.5 T. Radiology. 2014; 271:408–415. PMID: 24475807.
Article30. Singh A, Reddy D, Haris M, Cai K, Rajender Reddy K, Hariharan H, et al. T1ρ MRI of healthy and fibrotic human livers at 1.5 T. J Transl Med. 2015; 13:292. PMID: 26350896.31. Takayama Y, Nishie A, Asayama Y, Ushijima Y, Okamoto D, Fujita N, et al. T1ρ relaxation of the liver: a potential biomarker of liver function. J Magn Reson Imaging. 2015; 42:188–195. PMID: 25155810.
Article32. Marino L, Jornayvaz FR. Endocrine causes of nonalcoholic fatty liver disease. World J Gastroenterol. 2015; 21:11053–11076. PMID: 26494962.
Article33. Kim SU, Park JY, Kim DY, Ahn SH, Choi EH, Seok JY, et al. Non-invasive assessment of changes in liver fibrosis via liver stiffness measurement in patients with chronic hepatitis B: impact of antiviral treatment on fibrosis regression. Hepatol Int. 2010; 4:673–680. PMID: 21286337.
Article34. Kukuk GM, Hittatiya K, Sprinkart AM, Eggers H, Gieseke J, Block W, et al. Comparison between modified Dixon MRI techniques, MR spectroscopic relaxometry, and different histologic quantification methods in the assessment of hepatic steatosis. Eur Radiol. 2015; 25:2869–2879. PMID: 25903702.
Article35. Fallatah HI, Akbar HO, Fallatah AM. Fibroscan compared to FIB-4, APRI, and AST/ALT ratio for assessment of liver fibrosis in Saudi patients with nonalcoholic fatty liver disease. Hepat Mon. 2016; 16:e38346. PMID: 27642348.
Article36. Lăpădat AM, Jianu IR, Ungureanu BS, Florescu LM, Gheonea DI, Sovaila S, et al. Non-invasive imaging techniques in assessing non-alcoholic fatty liver disease: a current status of available methods. J Med Life. 2017; 10:19–26. PMID: 28255371.
Article37. Deng M, Zhao F, Yuan J, Ahuja AT, Wang YX. Liver T1ρ MRI measurement in healthy human subjects at 3 T: a preliminary study with a two-dimensional fast-field echo sequence. Br J Radiol. 2012; 85:e590–e595. PMID: 22422392.38. Kim DY, Kim SU, Ahn SH, Park JY, Lee JM, Park YN, et al. Usefulness of FibroScan for detection of early compensated liver cirrhosis in chronic hepatitis B. Dig Dis Sci. 2009; 54:1758–1763. PMID: 19005758.
Article39. Kumar R, Rastogi A, Sharma MK, Bhatia V, Tyagi P, Sharma P, et al. Liver stiffness measurements in patients with different stages of nonalcoholic fatty liver disease: diagnostic performance and clinicopathological correlation. Dig Dis Sci. 2013; 58:265–274. PMID: 22790906.
Article40. Koon CM, Zhang X, Chen W, Chu ES, San Lau CB, Wáng YX. Black blood T1rho MR imaging may diagnose early stage liver fibrosis: a proof-of-principle study with rat biliary duct ligation model. Quant Imaging Med Surg. 2016; 6:353–363. PMID: 27709071.
Article41. Chen W, Chan Q, Wáng YX. Breath-hold black blood quantitative T1rho imaging of liver using single shot fast spin echo acquisition. Quant Imaging Med Surg. 2016; 6:168–177. PMID: 27190769.
Article42. Yuan J, Zhao F, Griffith JF, Chan Q, Wang YX. Optimized efficient liver T(1ρ) mapping using limited spin lock times. Phys Med Biol. 2012; 57:1631–1640. PMID: 22398137.
- Full Text Links
-
- Actions
-
Cited
- CITED
-
- Close
- Share
-
- Similar articles
-
- Hepatic and Splenic Volumetry Could Be Used as an Imaging Parameter to Evaluate Fibrosis Grades of the Diffuse Liver Disease Including Nonalcoholic Fatty Liver Disease
- The diagnosis of nonalcoholic fatty liver disease
- Non-invasive imaging biomarkers for liver steatosis in non-alcoholic fatty liver disease: present and future
- Chasing after novel non-invasive markers to identify advanced fibrosis in NAFLD
- Fatty Liver
