Contrast reference values in panoramic radiographic images using an arch-form phantom stand
- Affiliations
-
- 1Department of Oral and Maxillofacial Surgery, Ilsan Paik Hospital, Inje University College of Medicine, Goyang, Republic of Korea.
- 2Department of Oral and Maxillofacial Radiology and Dental Research Institute, School of Dentistry, Seoul National University, Seoul, Republic of Korea. raylee@snu.ac.kr
- KMID: 2408252
- DOI: http://doi.org/10.5624/isd.2016.46.3.203
Abstract
- PURPOSE
The purpose of this study was to investigate appropriate contrast reference values (CRVs) by comparing the contrast in phantom and clinical images.
MATERIALS AND METHODS
Phantom contrast was measured using two methods: (1) counting the number of visible pits of different depths in an aluminum plate, and (2) obtaining the contrast-to-noise ratio (CNR) for 5 tissue-equivalent materials (porcelain, aluminum, polytetrafluoroethylene [PTFE], polyoxymethylene [POM], and polymethylmethacrylate [PMMA]). Four panoramic radiographs of the contrast phantom, embedded in the 4 different regions of the arch-form stand, and 1 real skull phantom image were obtained, post-processed, and compared. The clinical image quality evaluation chart was used to obtain the cut-off values of the phantom CRV corresponding to the criterion of being adequate for diagnosis.
RESULTS
The CRVs were obtained using 4 aluminum pits in the incisor and premolar region, 5 aluminum pits in the molar region, and 2 aluminum pits in the temporomandibular joint (TMJ) region. The CRVs obtained based on the CNR measured in the anterior region were: porcelain, 13.95; aluminum, 9.68; PTFE, 6.71; and POM, 1.79. The corresponding values in the premolar region were: porcelain, 14.22; aluminum, 8.82; PTFE, 5.95; and POM, 2.30. In the molar region, the following values were obtained: porcelain, 7.40; aluminum, 3.68; PTFE, 1.27; and POM, - 0.18. The CRVs for the TMJ region were: porcelain, 3.60; aluminum, 2.04; PTFE, 0.48; and POM, - 0.43.
CONCLUSION
CRVs were determined for each part of the jaw using the CNR value and the number of pits observed in phantom images.
MeSH Terms
Figure
-

Fig. 1 The contrast phantom id composed of 2 parts. Five tissue-equivalent materials are contained in an acrylic block on the top. From the top, the materials are polymethylmethacrylate, polyoxymethylene, polytetrafluoroethylene, aluminum, and porcelain. The bottom contains an aluminum block with pits of various depths.

Fig. 2 A. X-ray phantom head (transparent, product number 7280; Erler Zimmer Co., Lauf, Germay). B. The reconstructed 3-dimensional computed tomography image of the phantom was used for the central arch curve of the mandible.
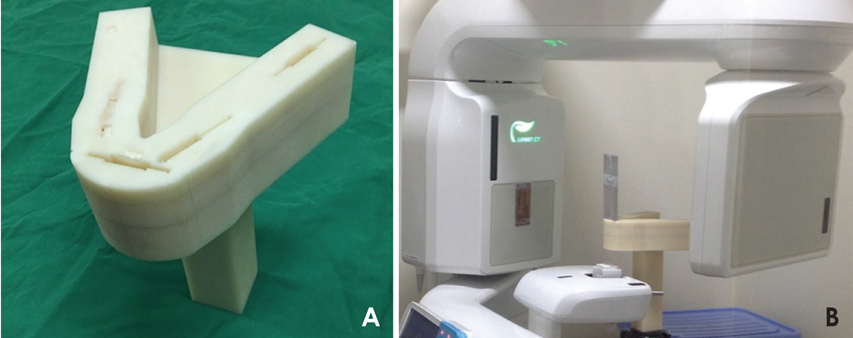
Fig. 3 A. A fabricated phantom stand for this study. The phantom has slits in the incisor, right premolar, left molar, and right temporomandibular joint regions to insert the contrast phantom. B. The phantom is inserted in the contrast phantom to obtain X-rays.
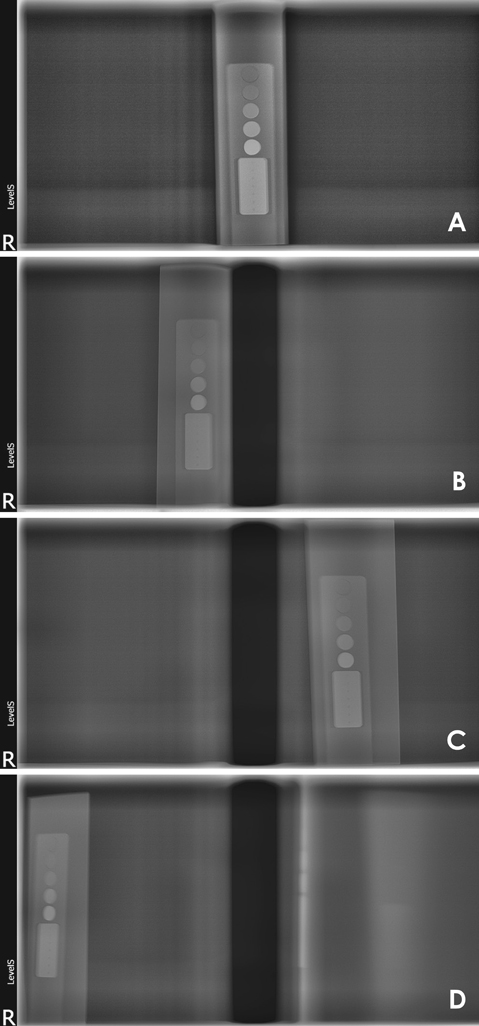
Fig. 4 Contrast phantom images. A. Anterior area. B. Premolar area. C. Molar area. D. Temporomandibular joint area.
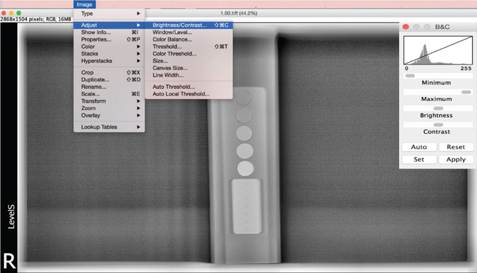
Fig. 5 Each phantom image obtained was modified into 18 different images with proportionally different contrast values using Aperture (Apple Inc., San Francisco, CA, USA).
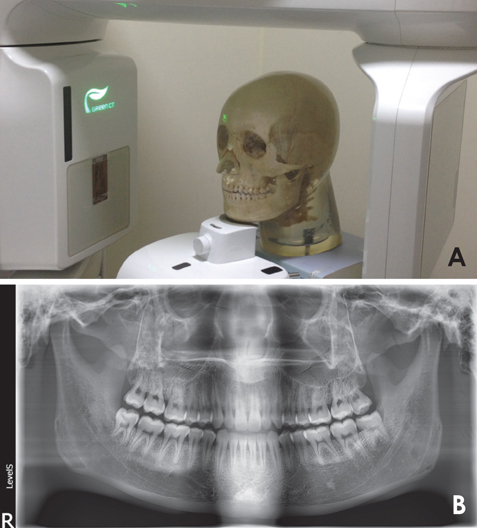
Fig. 6 A. The skull X-ray phantom head is positioned to take a clinical image. B. The panoramic image of the skull phantom.
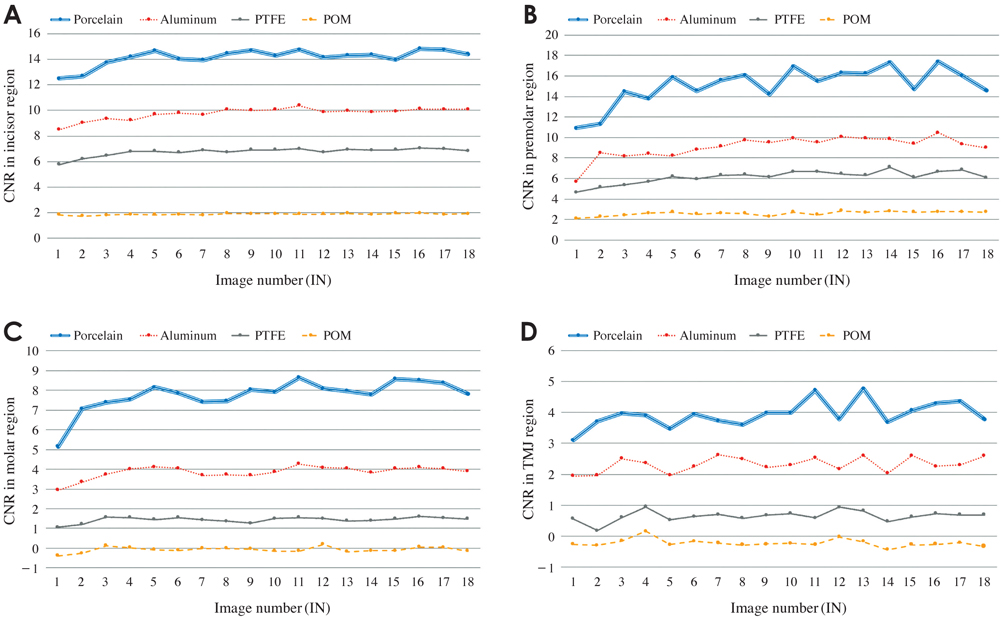
Fig. 7 The contrast-to-noise ratio (CNR) of the tissue-equivalent material of the phantom in each dental arch region. A. Incisor region. B. Premolar region. C. Molar region. D. Temporomandibular joint region. POM: polyoxymethylene, PTFE: polytetrafluoroethylene.
Reference
-
1. Institute of Physics and Engineering in Medicine. Recommended standards for the routine performance testing of diagnostic X-ray imaging systems. IPEM Report 91. York: Institute of Physics and Engineering in Medicine;2005.2. Yoo S, Kim GY, Hammoud R, Elder E, Pawlicki T, Guan H, et al. A quality assurance program for the on-board imagers. Med Phys. 2006; 33:4431–4447.3. International Electrotechnical Commission. Evaluation and routine testing in medical imaging departments - Part 3-4: Acceptance tests - Imaging performance of dental X-ray equipment. IEC 61223-3-4. Geneva: International Electrotechnical Commission;2000.4. Choi DH, Choi BR, Choi JW, Huh KH, Yi WJ, Heo MS, et al. Reference line-pair values of panoramic radiographs using an arch-form phantom stand to assess clinical image quality. Imaging Sci Dent. 2013; 43:7–15.
Article5. International Commission on Radiation Units and Measurements. Tissue substitutes in radiation dosimetry and measurement. ICRU Report 44. Bethesda: International Commission on Radiation Units and Measurements;1989.6. Schneider U, Pedroni E, Lomax A. The calibration of CT Hounsfield units for radiotherapy treatment planning. Phys Med Biol. 1996; 41:111–124.
Article7. Midgley SM. A method for estimating radiation interaction coefficients for tissues from single energy CT. Phys Med Biol. 2014; 59:7479–7499.
Article8. Lee SW, Choi YN, Cho HM, Lee YJ, Ryu HJ, Kim HJ. Feasibility of photon-counting K-edge imaging in X-ray and computed tomographic systems: Monte Carlo simulation studies. J Korean Phys Soc. 2011; 59:2833–2839.
Article9. Choi BR, Choi DH, Huh KH, Yi WJ, Heo MS, Choi SC, et al. Clinical image quality evaluation for panoramic radiography in Korean dental clinics. Imaging Sci Dent. 2012; 42:183–190.
Article
- Full Text Links
-
- Actions
-
Cited
- CITED
-
- Close
- Share
-
- Similar articles
-
- Reference line-pair values of panoramic radiographs using an arch-form phantom stand to assess clinical image quality
- Correlation between sagittal condylar guidance angles obtained using radiographic and protrusive occlusal record methods
- A study of panoramic focal trough for the six-year-old child
- Development of a new ball-type phantom for evaluation of the image layer of panoramic radiography
- Effective dose from direct and indirect digital panoramic units
