Metabolic Activity of Normal Glandular Tissue on ¹â¸F-Fluorodeoxyglucose Positron Emission Tomography/Computed Tomography: Correlation with Menstrual Cycles and Parenchymal Enhancements
- Affiliations
-
- 1Department of Nuclear Medicine and Molecular Imaging, Ajou University School of Medicine, Suwon, Korea.
- 2Department of Surgery, Ajou University School of Medicine, Suwon, Korea.
- 3Department of Radiology, Ajou University School of Medicine, Suwon, Korea. h219435@gmail.com
- KMID: 2398209
- DOI: http://doi.org/10.4048/jbc.2017.20.4.386
Abstract
- PURPOSE
The aims of our study were to correlate the degree of metabolic activity in normal glandular tissue measured on 18F-fluorodeoxyglucose positron emission tomography/computed tomography (18F-FDG PET/CT) with qualitative background parenchymal enhancement (BPE) grades on magnetic resonance imaging (MRI), and to investigate the change in standardized uptake value (SUV) according to the patients' menstrual cycles.
METHODS
From January 2013 to December 2015, 298 consecutive premenopausal patients with breast cancer who underwent both breast MRI and 18F-FDG PET/CT were identified. BPE was evaluated in the contralateral breast of cancer patients and categorized as minimal, mild, moderate, or marked based on Breast Imaging Reporting and Data System criteria. We analyzed the correlation between BPE and maximum SUV (SUVmax) and mean SUV (SUVmean) values. We also analyzed the metabolic activity of normal glandular tissue according to the patients' menstrual cycles.
RESULTS
The mean SUVmax and SUVmean values differed significantly according to BPE grade (p < 0001), with the lowest values occurring in the minimal group and the highest values occurring in the marked group. Spearman's correlation coefficients revealed moderate correlations between BPE grade and SUVmax (r=0.472, p < 0.001) and BPE and SUVmean (r=0.498, p < 0.001). The mean SUVmax and SUVmean values differed significantly according to the patients' menstrual cycles, with the highest values in the 3rd week and the lowest value in the 2nd week. Of 29 patients with low metabolic parenchyma (high BPE but low SUVmean values), 17 (58.6%) were in the 4th week of their menstrual cycle.
CONCLUSION
The metabolic activity of normal breast parenchyma, which is highest in the 3rd week and lowest in the 2nd week of the menstrual cycle, correlates moderately with BPE on MRI. Metabolic activity tends to be lower than blood flow and vessel permeability in the 4th week of the menstrual cycle.
Keyword
MeSH Terms
Figure
-
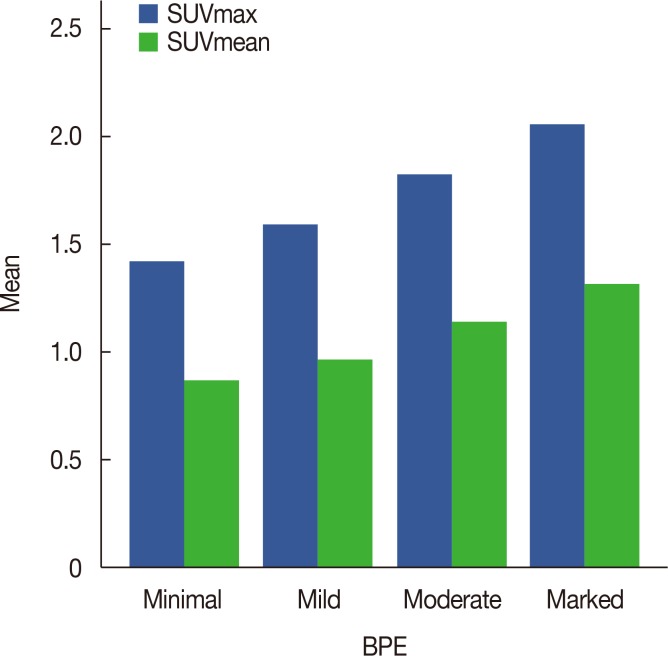
Figure 1 Mean values of maximum standardized uptake value (SUVmax) and SUVmean according to the background parenchymal enhancement (BPE) grade on magnetic resonance imaging.
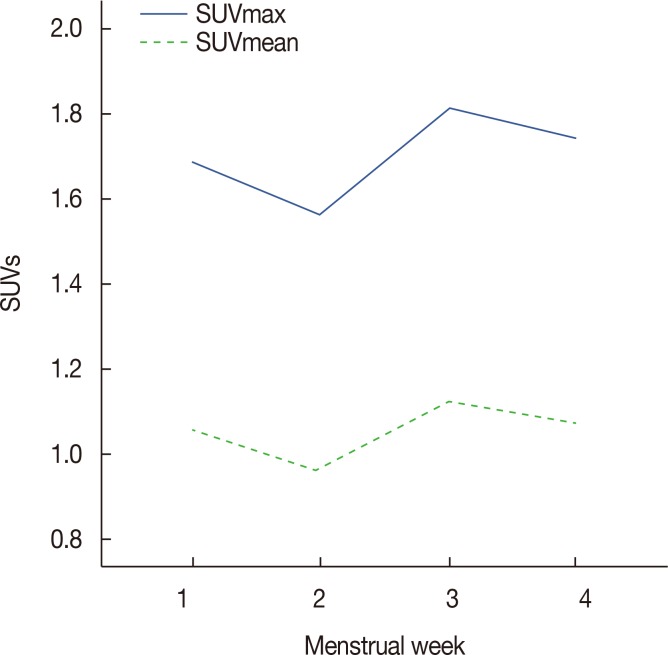
Figure 2 Mean values of maximum standardized uptake value (SUVmax) and SUVmean according to the patients' menstrual cycles.
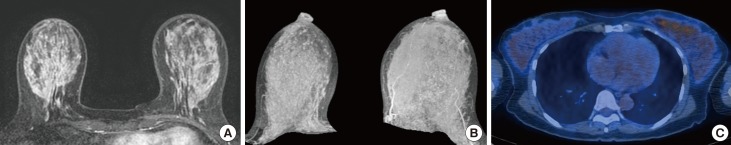
Figure 3 A 47-year-old female who has been diagnosed as breast cancer in her left breast. The patient underwent breast magnetic resonance imaging at the 3rd week of menstrual cycle. (A, B) Contrast-enhanced axial image and maximum intensity projection image show marked background parenchymal enhancement in the contralateral normal breast. (C) 18F-FDG PET/CT shows high values of SUVmax (2.6) and SUVmean (1.6).SUV=standardized uptake value; 18F-FDG PET/CT=18F-fluorodeoxyglucose positron emission tomography/computed tomography.
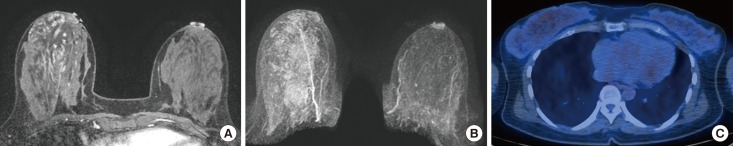
Figure 4 A 42-year-old female who has been diagnosed as breast cancer in her right breast. The patient underwent breast magnetic resonance imaging at the 2nd week of menstrual cycle. (A, B) Contrast-enhanced axial image and maximum intensity projection image show minimal background parenchymal enhancement in the contralateral normal breast. (C) 18F-FDG PET/CT shows high values of SUVmax (2.0) and SUVmean (1.3).SUV=standardized uptake value; 18F-FDG PET/CT=18F-fluorodeoxyglucose positron emission tomography/computed tomography.
Reference
-
1. Rossouw JE, Anderson GL, Prentice RL, LaCroix AZ, Kooperberg C, Stefanick ML, et al. Risks and benefits of estrogen plus progestin in healthy postmenopausal women: principal results From the Women's Health Initiative randomized controlled trial. JAMA. 2002; 288:321–333. PMID: 12117397.2. Chlebowski RT, Hendrix SL, Langer RD, Stefanick ML, Gass M, Lane D, et al. Influence of estrogen plus progestin on breast cancer and mammography in healthy postmenopausal women: the women's health initiative RANDOMIZED trial. JAMA. 2003; 289:3243–3253. PMID: 12824205.
Article3. Antoniou A, Pharoah PD, Narod S, Risch HA, Eyfjord JE, Hopper JL, et al. Average risks of breast and ovarian cancer associated with BRCA1 or BRCA2 mutations detected in case series unselected for family history: a combined analysis of 22 studies. Am J Hum Genet. 2003; 72:1117–1130. PMID: 12677558.
Article4. Begg CB, Haile RW, Borg A, Malone KE, Concannon P, Thomas DC, et al. Variation of breast cancer risk among BRCA1/2 carriers. JAMA. 2008; 299:194–201. PMID: 18182601.
Article5. Kuchenbaecker KB, Hopper JL, Barnes DR, Phillips KA, Mooij TM, Roos-Blom MJ, et al. Risks of breast, ovarian, and contralateral breast cancer for BRCA1 and BRCA2 mutation carriers. JAMA. 2017; 317:2402–2416. PMID: 28632866.6. Wolfe JN, Saftlas AF, Salane M. Mammographic parenchymal patterns and quantitative evaluation of mammographic densities: a case-control study. AJR Am J Roentgenol. 1987; 148:1087–1092. PMID: 3495132.
Article7. Byrne C, Schairer C, Wolfe J, Parekh N, Salane M, Brinton LA, et al. Mammographic features and breast cancer risk: effects with time, age, and menopause status. J Natl Cancer Inst. 1995; 87:1622–1629. PMID: 7563205.
Article8. Saftlas AF, Hoover RN, Brinton LA, Szklo M, Olson DR, Salane M, et al. Mammographic densities and risk of breast cancer. Cancer. 1991; 67:2833–2838. PMID: 2025849.
Article9. Boyd NF, Byng JW, Jong RA, Fishell EK, Little LE, Miller AB, et al. Quantitative classification of mammographic densities and breast cancer risk: results from the Canadian National Breast Screening Study. J Natl Cancer Inst. 1995; 87:670–675. PMID: 7752271.
Article10. Pike MC, Pearce CL. Mammographic density, MRI background parenchymal enhancement and breast cancer risk. Ann Oncol. 2013; 24(Suppl 8):viii37–viii41. PMID: 24131968.
Article11. Huo CW, Chew GL, Britt KL, Ingman WV, Henderson MA, Hopper JL, et al. Mammographic density-a review on the current understanding of its association with breast cancer. Breast Cancer Res Treat. 2014; 144:479–502. PMID: 24615497.
Article12. Dontchos BN, Rahbar H, Partridge SC, Korde LA, Lam DL, Scheel JR, et al. Are qualitative assessments of background parenchymal enhancement, amount of fibroglandular tissue on mr images, and mammographic density associated with breast cancer risk? Radiology. 2015; 276:371–380. PMID: 25965809.
Article13. King V, Brooks JD, Bernstein JL, Reiner AS, Pike MC, Morris EA. Background parenchymal enhancement at breast MR imaging and breast cancer risk. Radiology. 2011; 260:50–60. PMID: 21493794.
Article14. van der Velden BH, Dmitriev I, Loo CE, Pijnappel RM, Gilhuijs KG. Association between parenchymal enhancement of the contralateral breast in dynamic contrast-enhanced MR imaging and outcome of patients with unilateral invasive breast cancer. Radiology. 2015; 276:675–685. PMID: 25811614.
Article15. Lim Y, Ko ES, Han BK, Ko EY, Choi JS, Lee JE, et al. Background parenchymal enhancement on breast MRI: association with recurrence-free survival in patients with newly diagnosed invasive breast cancer. Breast Cancer Res Treat. 2017; 163:573–586. PMID: 28349273.
Article16. Kim SA, Cho N, Ryu EB, Seo M, Bae MS, Chang JM, et al. Background parenchymal signal enhancement ratio at preoperative MR imaging: association with subsequent local recurrence in patients with ductal carcinoma in situ after breast conservation surgery. Radiology. 2014; 270:699–707. PMID: 24126372.
Article17. Preibsch H, Wanner L, Bahrs SD, Wietek BM, Siegmann-Luz KC, Oberlecher E, et al. Background parenchymal enhancement in breast MRI before and after neoadjuvant chemotherapy: correlation with tumour response. Eur Radiol. 2016; 26:1590–1596. PMID: 26382845.
Article18. Choi JS, Ko ES, Ko EY, Han BK, Nam SJ. Background parenchymal enhancement on preoperative magnetic resonance imaging: association with recurrence-free survival in breast cancer patients treated with neoadjuvant chemotherapy. Medicine (Baltimore). 2016; 95:e3000. PMID: 26945421.19. Baek JE, Kim SH, Lee AW. Background parenchymal enhancement in breast MRIs of breast cancer patients: impact on tumor size estimation. Eur J Radiol. 2014; 83:1356–1362. PMID: 24882786.
Article20. Park SY, Kang DK, Kim TH. Does background parenchymal enhancement on MRI affect the rate of positive resection margin in breast cancer patients? Br J Radiol. 2015; 88:20140638. PMID: 25429418.
Article21. Leithner D, Baltzer PA, Magometschnigg HF, Wengert GJ, Karanikas G, Helbich TH, et al. Quantitative assessment of breast parenchymal uptake on 18F-FDG PET/CT: correlation with age, background parenchymal enhancement, and amount of fibroglandular tissue on MRI. J Nucl Med. 2016; 57:1518–1522. PMID: 27230924.
Article22. Mema E, Mango VL, Guo X, Karcich J, Yeh R, Wynn RT, et al. Does breast MRI background parenchymal enhancement indicate metabolic activity? Qualitative and 3D quantitative computer imaging analysis. J Magn Reson Imaging. 2017; 6. 24. Epub. DOI: 10.1002/jmri.25798.
Article23. Morris EA, Comstock CE, Lee CH, Lehman CD, Ikeda DM, Newstead GM, et al. ACR BI-RADS magnetic resonance imaging. ACR BIRADS Atlas, Breast Imaging Reporting and Data System. Reston: American College of Radiology;2013. p. 124–176.24. Wu S, Zuley ML, Berg WA, Kurland BF, Jankowitz RC, Sumkin JH, et al. DCE-MRI background parenchymal enhancement quantified from an early versus delayed post-contrast sequence: association with breast cancer presence. Sci Rep. 2017; 7:2115. PMID: 28522877.
Article25. Telegrafo M, Rella L, Stabile Ianora AA, Angelelli G, Moschetta M. Breast MRI background parenchymal enhancement (BPE) correlates with the risk of breast cancer. Magn Reson Imaging. 2016; 34:173–176. PMID: 26597834.
Article26. Vogel PM, Georgiade NG, Fetter BF, Vogel FS, McCarty KS Jr. The correlation of histologic changes in the human breast with the menstrual cycle. Am J Pathol. 1981; 104:23–34. PMID: 7258295.27. Going JJ, Anderson TJ, Battersby S, MacIntyre CC. Proliferative and secretory activity in human breast during natural and artificial menstrual cycles. Am J Pathol. 1988; 130:193–204. PMID: 3337211.
- Full Text Links
-
- Actions
-
Cited
- CITED
-
- Close
- Share
-
- Similar articles
-
- Fluorine-18 Fluorodeoxyglucose Positron Emission Tomography/Computed Tomography Findings of Post Traumatic Lymphangioma in a Young Adult Male
- â¶â¸Gallium-Arginine-Glycine-Aspartic Acid and ¹â¸F-Fluorodeoxyglucose Positron Emission Tomography/Computed Tomography in Chondroblastic Osteosarcoma of the Skull
- Transient ¹â¸F-Fluorodeoxyglucose Activity on PET/CT of Herniation Pit in Thyroid Cancer Patient: A Case Report
- The role of ¹â¸F-fluorodeoxyglucose positron emission tomography in the assessment of disease activity of adult-onset Still’s disease
- Pulmonary Actinomycosis Imitating Lung Cancer on ¹â¸F-FDG PET/CT: A Case Report and Literature Review
