Investig Magn Reson Imaging.
2017 Sep;21(3):148-153. 10.13104/imri.2017.21.3.148.
Magnetic Resonance Enhancement Pattern as a Predictor of Cement Volume in Vertebroplasty Procedures for Osteoporotic Fractures
- Affiliations
-
- 1Department of Radiology, Dankook University Hospital, Cheonan, Korea. sun0255@hanmail.net
- KMID: 2392685
- DOI: http://doi.org/10.13104/imri.2017.21.3.148
Abstract
- PURPOSE
To identify the differences between injected cement volumes during vertebroplasty procedures according to the enhancement pattern of pre-procedure magnetic resonance imaging (MRI) findings.
MATERIALS AND METHODS
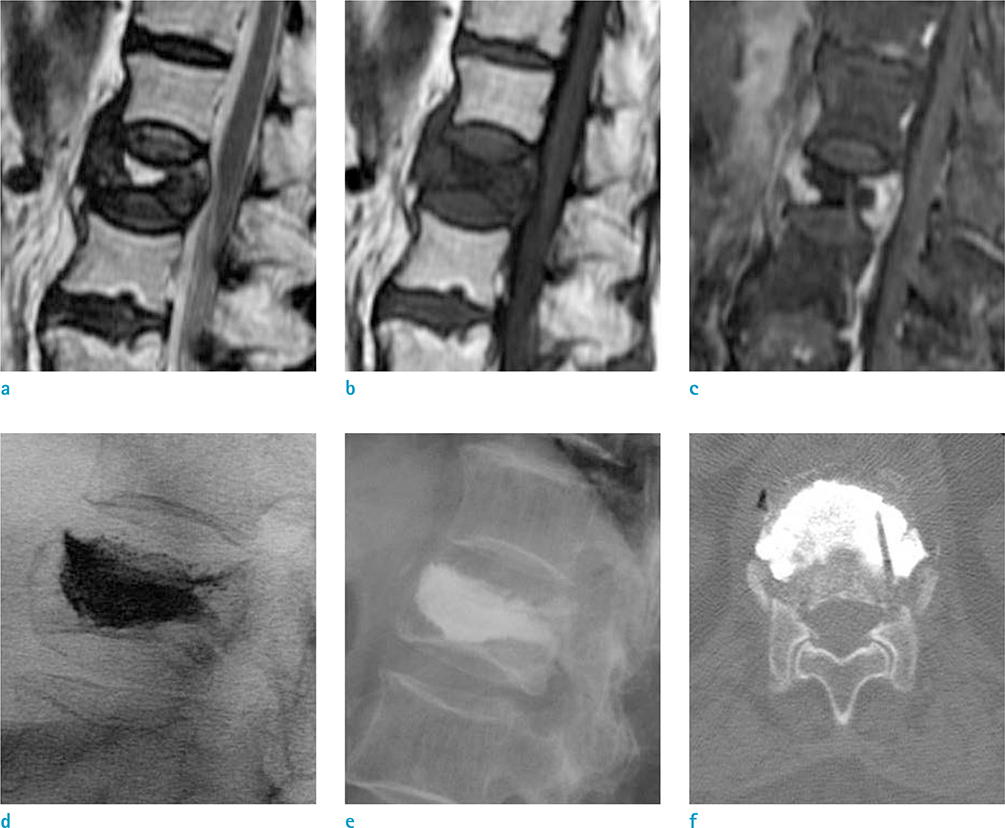
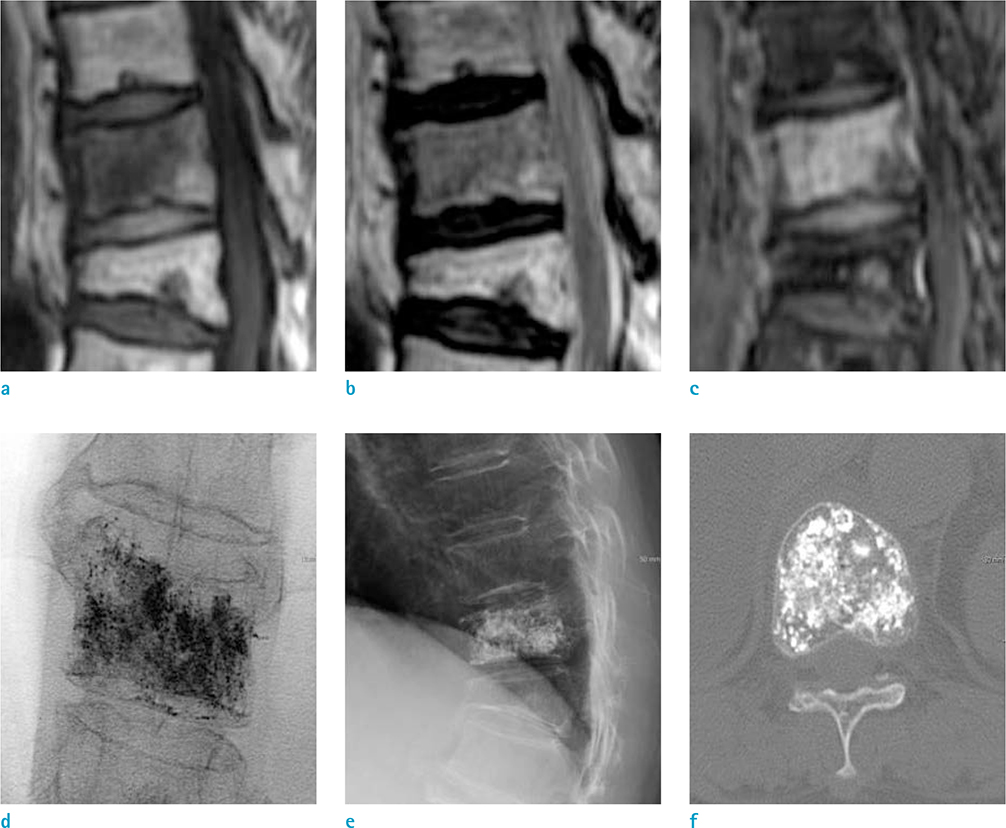
Thirty-two patients who underwent 52 vertebroplasty procedures as well as pre-procedure contrast-enhanced spine MRI in the authors' institution were reviewed retrospectively. The 52 procedures were divided into two groups according to different enhancement patterns shown by pre-procedure MR imaging [E(+) and E(−)]. The volumes of the enhancing/non-enhancing portions of the fractured vertebral body shown by pre-procedural MR imaging were calculated and compared to the volumes of the injected cement during the vertebroplasty procedures.
RESULTS
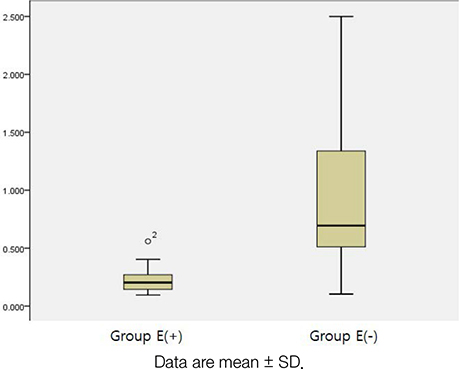
The 52 injections included 28 (56%) in Group E(+) and 24 (44%) in Group E(−). The actual volume ratio of the injected cement to the volume of the non-enhanced or enhanced region calculated based on the contrast-enhanced MRI was 0.22 ± 0.11 (cc/cm³) in the E(+) group and 0.93 ± 0.62 (cc/cm³) in the E(−) group. The average amount of injected cement was significantly different between Group E(+) and Group E(−) (P < 0.001). In addition, the ratio of the injected cement amount to the volume of the enhanced or non-enhanced portion based on the contrast-enhanced MRI in Group E(−) was significantly higher than that of Group E(+) (P < 0.001).
CONCLUSION
Different enhancement patterns shown by pre-procedure MRI can predictors of the injected cement volume during vertebroplasty procedures for osteoporotic fractures.
Keyword
MeSH Terms
Figure
Reference
-
1. Mehbod A, Aunoble S, Le Huec JC. Vertebroplasty for osteoporotic spine fracture: prevention and treatment. Eur Spine J. 2003; 12:Suppl 2. S155–S162.2. Blasco J, Martinez-Ferrer A, Macho J, et al. Effect of vertebroplasty on pain relief, quality of life, and the incidence of new vertebral fractures: a 12-month randomized follow-up, controlled trial. J Bone Miner Res. 2012; 27:1159–1166.3. Provenzano MJ, Murphy KP, Riley LH 3rd. Bone cements: review of their physiochemical and biochemical properties in percutaneous vertebroplasty. AJNR Am J Neuroradiol. 2004; 25:1286–1290.4. Mathis JM. Percutaneous vertebroplasty: complication avoidance and technique optimization. AJNR Am J Neuroradiol. 2003; 24:1697–1706.5. Kaufmann TJ, Trout AT, Kallmes DF. The effects of cement volume on clinical outcomes of percutaneous vertebroplasty. AJNR Am J Neuroradiol. 2006; 27:1933–1937.6. Molloy S, Riley LH 3rd, Belkoff SM. Effect of cement volume and placement on mechanical-property restoration resulting from vertebroplasty. AJNR Am J Neuroradiol. 2005; 26:401–404.7. Ryu KS, Park CK, Kim MC, Kang JK. Dose-dependent epidural leakage of polymethylmethacrylate after percutaneous vertebroplasty in patients with osteoporotic vertebral compression fractures. J Neurosurg. 2002; 96:56–61.8. Tanigawa N, Komemushi A, Kariya S, et al. Relationship between cement distribution pattern and new compression fracture after percutaneous vertebroplasty. AJR Am J Roentgenol. 2007; 189:W348–W352.9. Oka M, Matsusako M, Kobayashi N, Uemura A, Numaguchi Y. Intravertebral cleft sign on fat-suppressed contrast-enhanced MR: correlation with cement distribution pattern on percutaneous vertebroplasty. Acad Radiol. 2005; 12:992–999.
- Full Text Links
- Actions
-
Cited
- CITED
-
- Close
- Share
- Similar articles
-
- Risk Factors for Subsequent Fracture after Osteoporotic Vertebral Compression Fracture
- Minimally Invasive Treatment of Painful Osteoporotic Vertebral Fractures
- The Relationship between the Compression Grade of Vertebrae and Outcome after Percutaneous Vertebroplasty in Patients with Osteoporotic Vertebral Compression Fractures
- Magnetic Resonance Enhancement Patterns at the Different Ages of Symptomatic Osteoporotic Vertebral Compression Fractures
- Asymptomatic Pulmonary Embolus Following Percutaneous Kyphoplasty: A Case Report


