Immune Netw.
2017 Aug;17(4):237-249. 10.4110/in.2017.17.4.237.
Comparative Analyses of Signature Genes in Acute Rejection and Operational Tolerance
- Affiliations
-
- 1Biomedical Research Institute, Kyungpook National University Hospital, Daegu 41404, Korea. ohjiwon@knu.ac.kr
- 2Department of Anatomy, Kyungpook National University School of Medicine, Daegu 41944, Korea.
- 3Department of Microbiology, Kyungpook National University School of Medicine, Daegu 41944, Korea. tolerance@knu.ac.kr
- 4Xenotransplantation Research Center, Seoul National University College of Medicine, Seoul 03080, Korea.
- KMID: 2388078
- DOI: http://doi.org/10.4110/in.2017.17.4.237
Abstract
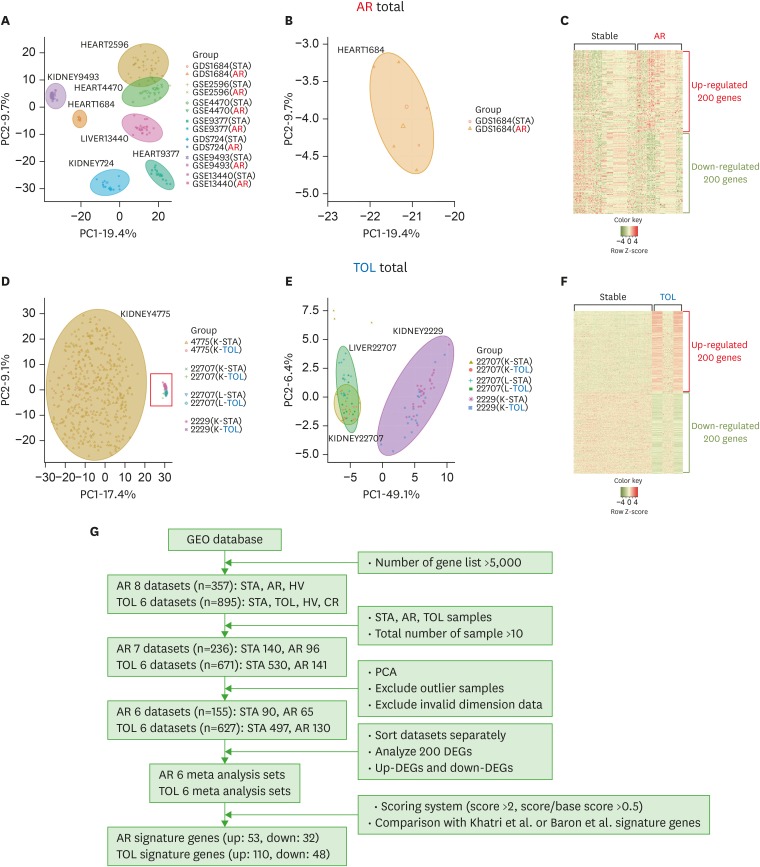
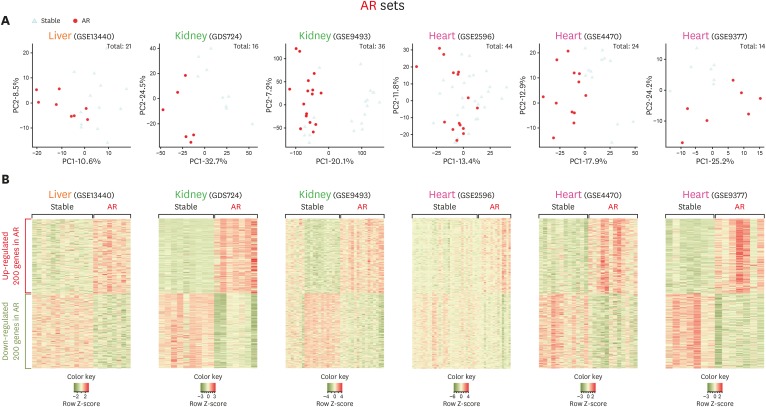
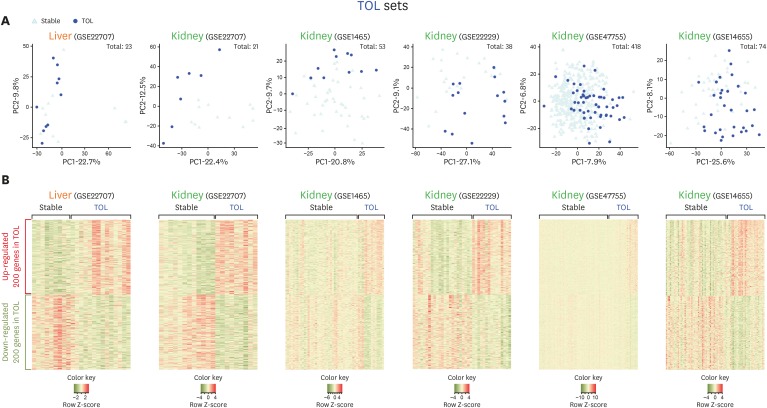
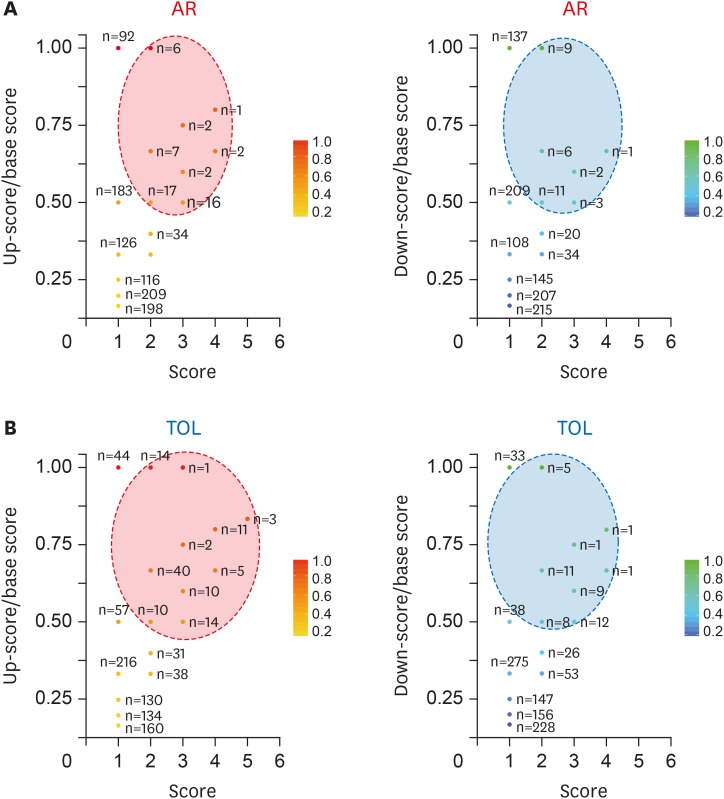
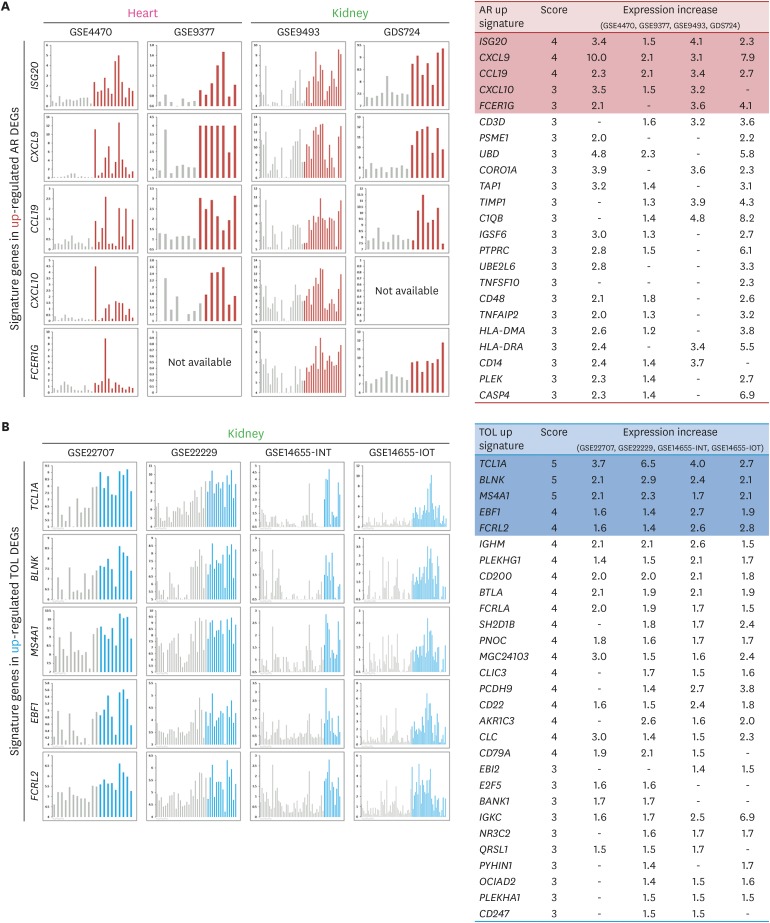
- Using biomarkers as prediction tools or therapeutic targets can be a valuable strategy in transplantation. Recent studies identified biomarkers of acute rejection (AR) and operational tolerance (TOL) through the application of meta-analysis. In this study, we comparatively analyzed the signature genes in acute rejection and operational tolerance seen in human allogeneic transplantations using massive bioinformatical meta-analysis. To identify the signature genes in opposite immunological conditions, AR and TOL, we first collected the 1,252 gene expression data specifically intended for those circumstances. Then we excluded based on biological cut-values, Principal Component Analysis (PCA) as well as Multi-Dimensional Scaling (MDS). Using differentially expressed genes (DEGs) from meta-analysis, we then applied a ranked scoring system to identify the signature genes of AR and TOL. We identified 53 up-regulated and 32 down-regulated signature genes in acute rejection condition. Among them, ISG20, CXCL9, CXCL10, CCL19, FCER1G, PMSE1, UBD are highly expressed in AR condition. In operational tolerance, we identified 110 up-regulated and 48 down-regulated signature genes. TCL1A, BLNK, MS4A1, EBF1, IGHM are up-regulated in TOL condition. These genes are highly representative of AR or TOL across the different organs such as liver, kidney and heart. Since immune response is the sum of complex biological and molecular dynamics, these signature genes as well as pathway analysis using a systems biology approach could be used to catch the insights of the certain pathways that would be overlooked with the conventional gene-level comparative analysis.
MeSH Terms
Figure
Cited by 1 articles
-
Results of Questionnaire Survey of Current Immune Monitoring Practice of Transplant Clinicians and Clinical Pathologists in Korea: Basis for Establishment of Harmonized Immune Monitoring Guidelines
Eun-Suk Kang, Soo In Choi, Youn Hee Park, Geum Borae Park, Hye Ryon Jang
J Korean Soc Transplant. 2018;32(2):13-25. doi: 10.4285/jkstn.2018.32.2.13.
Reference
-
1. Lechler RI, Sykes M, Thomson AW, Turka LA. Organ transplantation--how much of the promise has been realized? Nat Med. 2005; 11:605–613. PMID: 15937473.
Article2. Orlando G, Hematti P, Stratta RJ, Burke GW 3rd, Di Cocco P, Pisani F, Soker S, Wood K. Clinical operational tolerance after renal transplantation: current status and future challenges. Ann Surg. 2010; 252:915–928. PMID: 21107102.3. Roedder S, Vitalone M, Khatri P, Sarwal MM. Biomarkers in solid organ transplantation: establishing personalized transplantation medicine. Genome Med. 2011; 3:37. PMID: 21658299.
Article4. Gökmen R, Hernandez-Fuentes MP. Biomarkers of tolerance. Curr Opin Organ Transplant. 2013; 18:416–420. PMID: 23838646.
Article5. Khatri P, Roedder S, Kimura N, De Vusser K, Morgan AA, Gong Y, Fischbein MP, Robbins RC, Naesens M, Butte AJ, et al. A common rejection module (CRM) for acute rejection across multiple organs identifies novel therapeutics for organ transplantation. J Exp Med. 2013; 210:2205–2221. PMID: 24127489.
Article6. Baron D, Ramstein G, Chesneau M, Echasseriau Y, Pallier A, Paul C, Degauque N, Hernandez-Fuentes MP, Sanchez-Fueyo A, Newell KA, et al. A common gene signature across multiple studies relate biomarkers and functional regulation in tolerance to renal allograft. Kidney Int. 2015; 87:984–995. PMID: 25629549.
Article7. Braud C, Baeten D, Giral M, Pallier A, Ashton-Chess J, Braudeau C, Chevalier C, Lebars A, Léger J, Moreau A, et al. Immunosuppressive drug-free operational immune tolerance in human kidney transplant recipients: part I. Blood gene expression statistical analysis. J Cell Biochem. 2008; 103:1681–1692. PMID: 17910029.
Article8. Brouard S, Mansfield E, Braud C, Li L, Giral M, Hsieh SC, Baeten D, Zhang M, Ashton-Chess J, Braudeau C, et al. Identification of a peripheral blood transcriptional biomarker panel associated with operational renal allograft tolerance. Proc Natl Acad Sci USA. 2007; 104:15448–15453. PMID: 17873064.
Article9. Lozano JJ, Pallier A, Martinez-Llordella M, Danger R, López M, Giral M, Londoño MC, Rimola A, Soulillou JP, Brouard S, et al. Comparison of transcriptional and blood cell-phenotypic markers between operationally tolerant liver and kidney recipients. Am J Transplant. 2011; 11:1916–1926. PMID: 21827613.
Article10. Newell KA, Asare A, Kirk AD, Gisler TD, Bourcier K, Suthanthiran M, Burlingham WJ, Marks WH, Sanz I, Lechler RI, et al. Identification of a B cell signature associated with renal transplant tolerance in humans. J Clin Invest. 2010; 120:1836–1847. PMID: 20501946.
Article11. Sagoo P, Perucha E, Sawitzki B, Tomiuk S, Stephens DA, Miqueu P, Chapman S, Craciun L, Sergeant R, Brouard S, et al. Development of a cross-platform biomarker signature to detect renal transplant tolerance in humans. J Clin Invest. 2010; 120:1848–1861. PMID: 20501943.
Article12. Oh JW, Kloepper J, Langan EA, Kim Y, Yeo J, Kim MJ, Hsi TC, Rose C, Yoon GS, Lee SJ, et al. A guide to studying human hair follicle cycling in vivo . J Invest Dermatol. 2016; 136:34–44. PMID: 26763421.13. Oh JW, Chung O, Cho YS, MacGregor GR, Plikus MV. Gene loss in keratinization programs accompanies adaptation of cetacean skin to aquatic lifestyle. Exp Dermatol. 2015; 24:572–573. PMID: 25959646.
Article14. Song SH, Jang HU, Oh JW, Kim JS. Gene expression analysis in nasal polyp using microarray. Korean J Otorhinolaryngol-Head Neck Surg. 2011; 54:55–61.
Article15. Choi SW, Chung HY, Lim YK, Kim HN, Oh JW, Kim MK, Jeon SH, Hong YT. Difference of gene expression between hypertrophic scar keratinocytes and normal keratinocytes. J Korean Soc Plast Reconstr Surg. 2010; 37:317–322.16. Neale BM, Kou Y, Liu L, Ma’ayan A, Samocha KE, Sabo A, Lin CF, Stevens C, Wang LS, Makarov V, et al. Patterns and rates of exonic de novo mutations in autism spectrum disorders. Nature. 2012; 485:242–245. PMID: 22495311.17. Méndez-Ferrer S, Michurina TV, Ferraro F, Mazloom AR, Macarthur BD, Lira SA, Scadden DT, Ma’ayan A, Enikolopov GN, Frenette PS. Mesenchymal and haematopoietic stem cells form a unique bone marrow niche. Nature. 2010; 466:829–834. PMID: 20703299.
Article18. Wang Q, Oh JW, Lee HL, Dhar A, Peng T, Ramos R, Guerrero-Juarez CF, Wang X, Zhao R, Cao X, et al. A multi-scale model for hair follicles reveals heterogeneous domains driving rapid spatiotemporal hair growth patterning. eLife. 2017; 6:e22772. PMID: 28695824.
Article19. Lachmann A, Xu H, Krishnan J, Berger SI, Mazloom AR, Ma’ayan ACE. transcription factor regulation inferred from integrating genome-wide ChIP-X experiments. Bioinformatics. 2010; 26:2438–2444. PMID: 20709693.20. Tan CM, Chen EY, Dannenfelser R, Clark NR, Ma’ayan A. Network2Canvas: network visualization on a canvas with enrichment analysis. Bioinformatics. 2013; 29:1872–1878. PMID: 23749960.
Article21. Cahan P, Rovegno F, Mooney D, Newman JC, St Laurent G 3rd, McCaffrey TA. Meta-analysis of microarray results: challenges, opportunities, and recommendations for standardization. Gene. 2007; 401:12–18. PMID: 17651921.
Article22. Subramanian A, Tamayo P, Mootha VK, Mukherjee S, Ebert BL, Gillette MA, Paulovich A, Pomeroy SL, Golub TR, Lander ES, et al. Gene set enrichment analysis: a knowledge-based approach for interpreting genome-wide expression profiles. Proc Natl Acad Sci USA. 2005; 102:15545–15550. PMID: 16199517.
Article23. Arnemann J, Spurr NK, Wheeler GN, Parker AE, Buxton RS. Chromosomal assignment of the human genes coding for the major proteins of the desmosome junction, desmoglein DGI (DSG), desmocollins DGII/III (DSC), desmoplakins DPI/II (DSP), and plakoglobin DPIII (JUP). Genomics. 1991; 10:640–645. PMID: 1889810.
Article24. Garrod D, Chidgey M. Desmosome structure, composition and function. Biochim Biophys Acta. 2008; 1778:572–587. PMID: 17854763.
Article25. Strimbu K, Tavel JA. What are biomarkers? Curr Opin HIV AIDS. 2010; 5:463–466. PMID: 20978388.
Article26. Biomarkers Definitions Working Group. Biomarkers and surrogate endpoints: preferred definitions and conceptual framework. Clin Pharmacol Ther. 2001; 69:89–95. PMID: 11240971.
- Full Text Links
- Actions
-
Cited
- CITED
-
- Close
- Share
- Similar articles
-
- Cellular and genetic signatures of operational tolerance in kidney transplant recipients through single cell RNA sequencing analysis
- Immunological Tolerance Monitoring in Solid Organ Transplantation
- Validation Study of an Operational Tolerance Signature in Korean Kidney Transplant Recipients
- Factors associated with operational tolerance after liver transplantation: a single center retrospective study
- Molecular Signature That Determines the Acute Tolerance of G Protein-Coupled Receptors

