Analysis of Treatment and Delay Times by Disease Site and Delivery Technique at Samsung Medical Center: Proton Therapy Center
- Affiliations
-
- 1Department of Radiation Oncology, Samsung Medical Center, Sungkyunkwan University School of Medicine, Seoul, Korea. youngyih@skku.edu
- KMID: 2376561
- DOI: http://doi.org/10.14316/pmp.2016.27.4.258
Abstract
- We have treated various disease sites using wobbling and scanning proton therapy techniques since December 2015 at the Samsung Medical Center. In this study, we analyze the treatment time for each disease site in 65 wobbling and 50 scanning treatments. Treatment times are longest for liver and lung cancer cases using the respiratory gating technique in the wobbling treatment and for cranio-spinal irradiation in pediatric patients with anesthesia in the scanning treatment. Moreover, we analyze the number of incidents causing treatment delays and the corresponding treatment delay time. The mal-functioning related to the X-ray imagers was the main reason for delays in the wobbling treatment; the delayed time decreased continually from January to June 2016, due to the attaining of proficiency in handling the mal-functioning. The main reason for delays in the scanning treatment was interlocks during scanning pattern delivery; and the interlocks has been resolved by proton therapy service engineers. Through this work, we hope to provide other institutes with useful information and insight for initial operation of proton therapy system.
Keyword
MeSH Terms
Figure
-
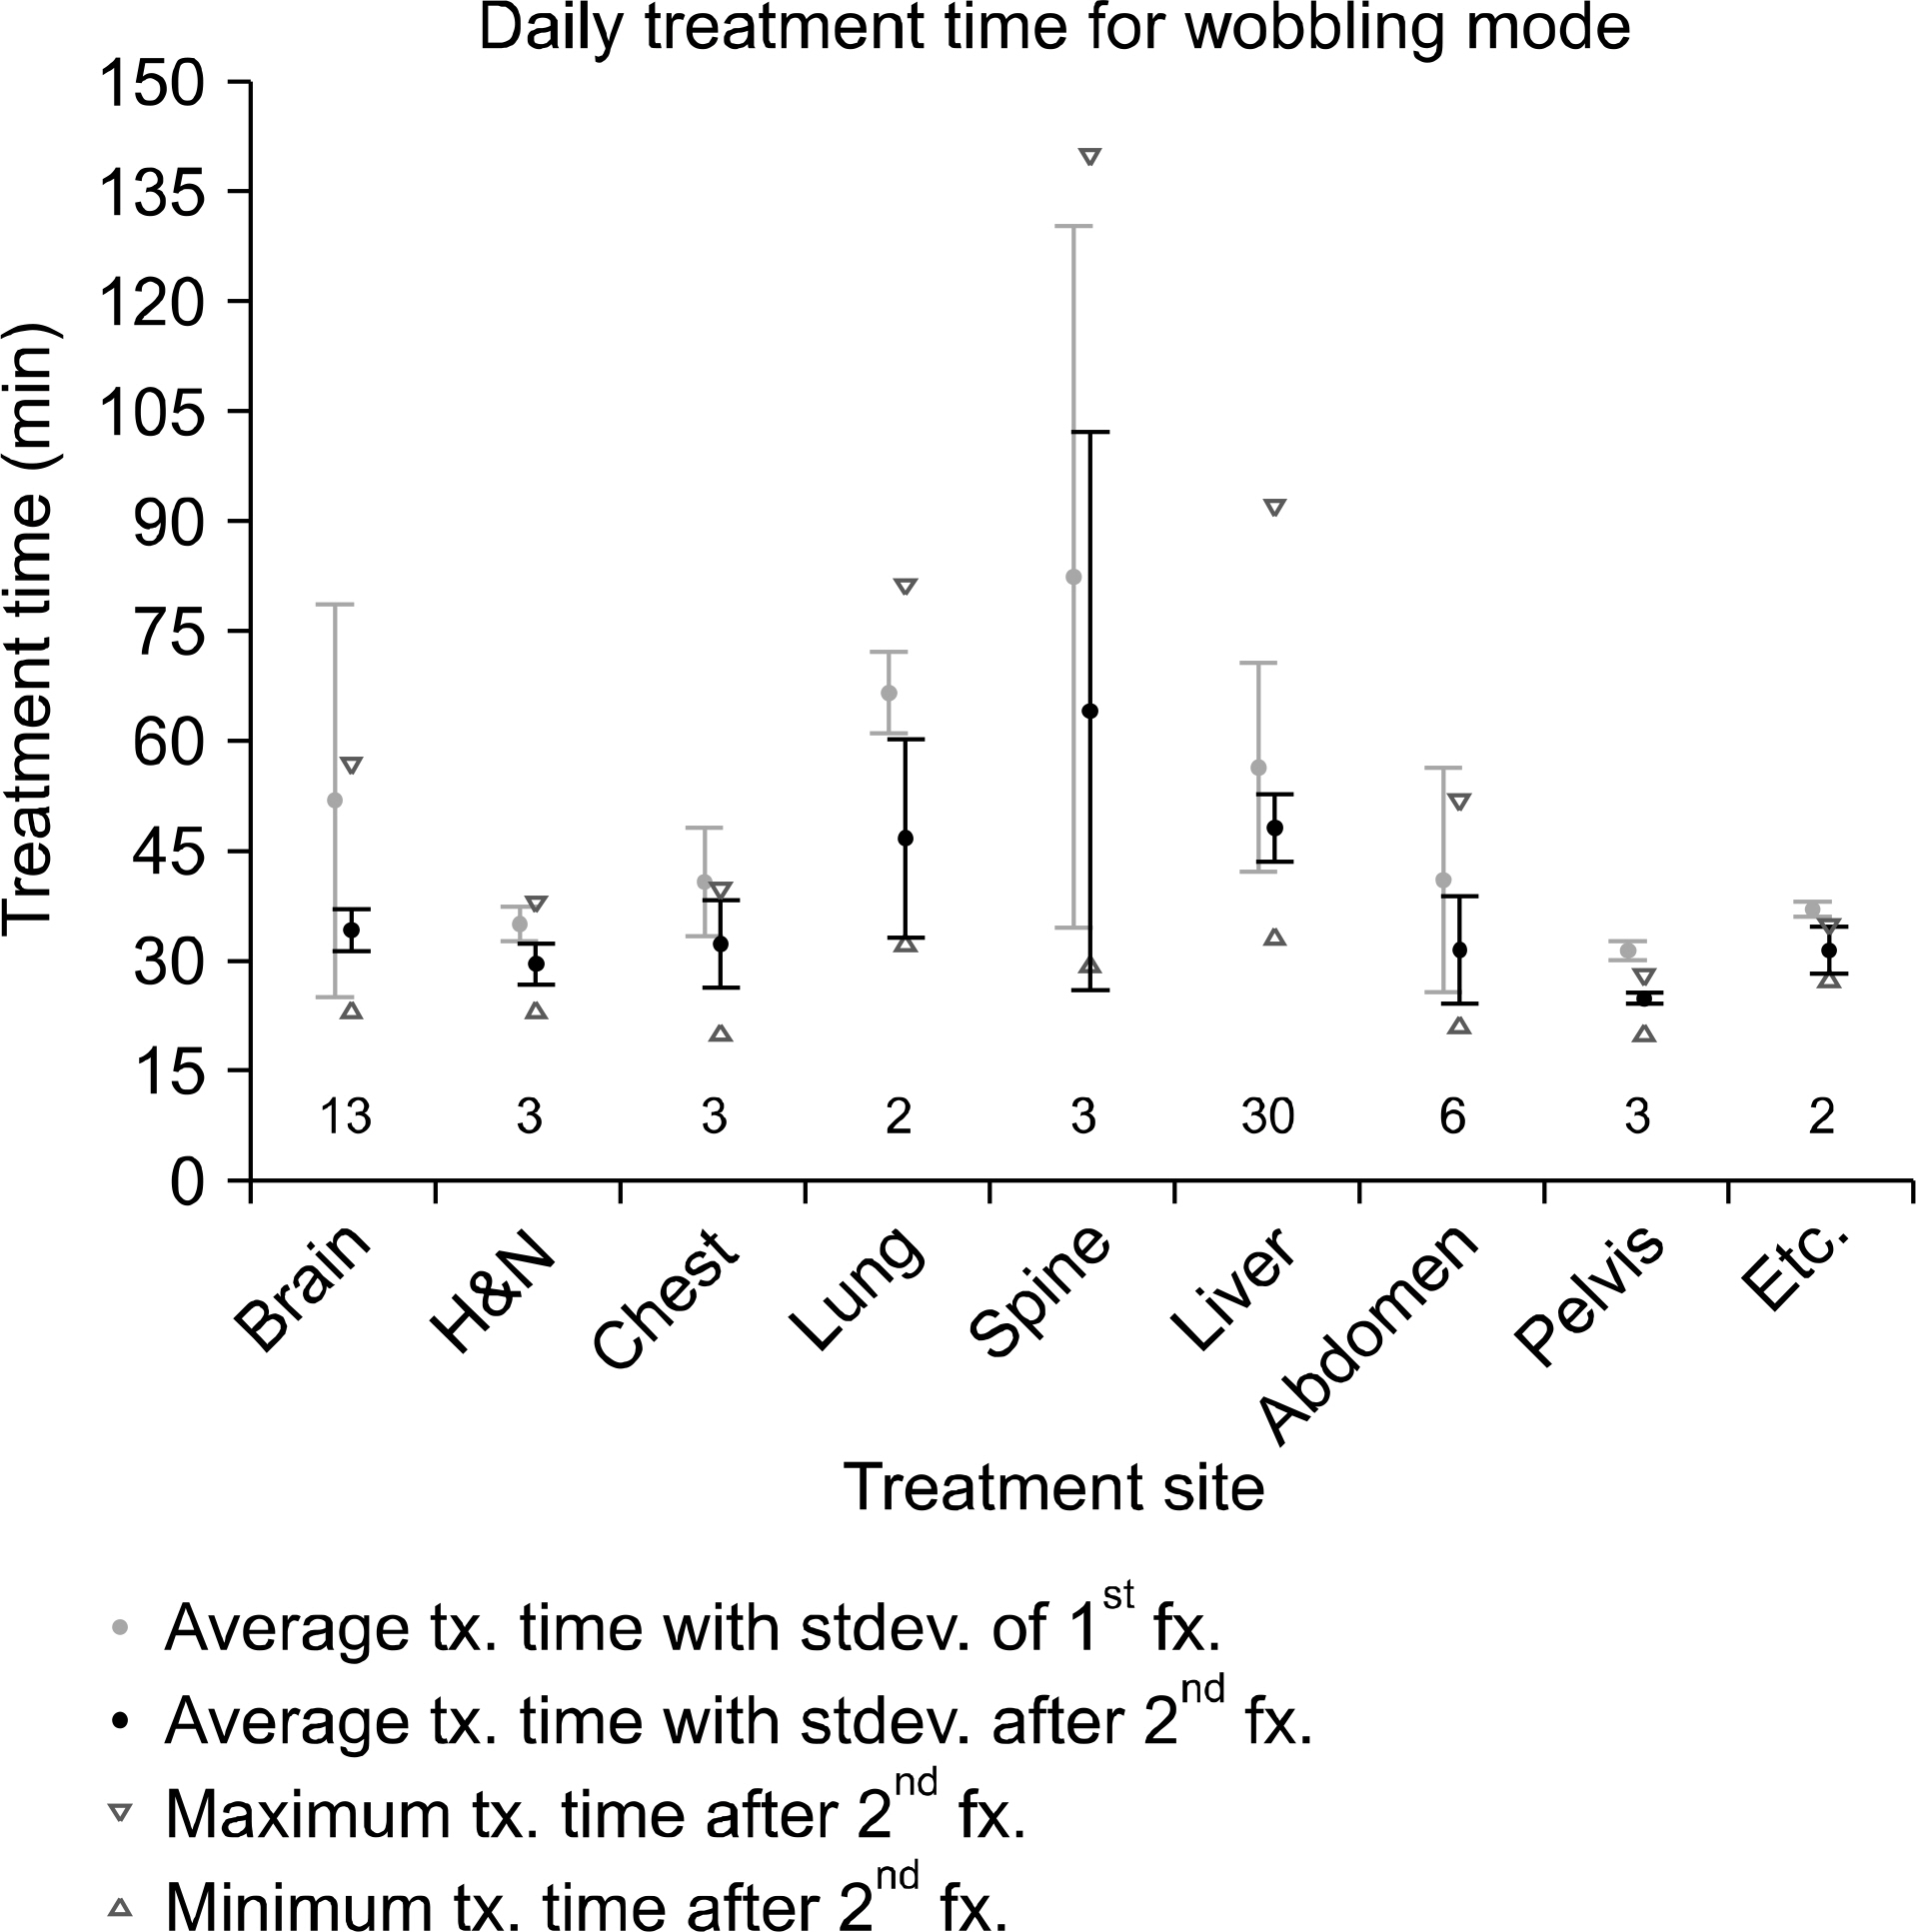
Fig. 1. Site-specific daily average of proton treatment time for the wobbling mode. Pink: averaged treatment time with standard deviation only for the first fraction of treatment. Blue: averaged treatment time with standard deviation after the second fraction of treatment. The standard deviation of each graph is indicated by upper and lower bars and average values are denoted by solid dots in the middle of the range. Red upward (downward) triangles are minimum (maximum) values of treatment time after the second fraction of treatment. At the bottom of the graph, the number of patients for each treatment site are presented. tx.: Treatment, fx.: fraction.
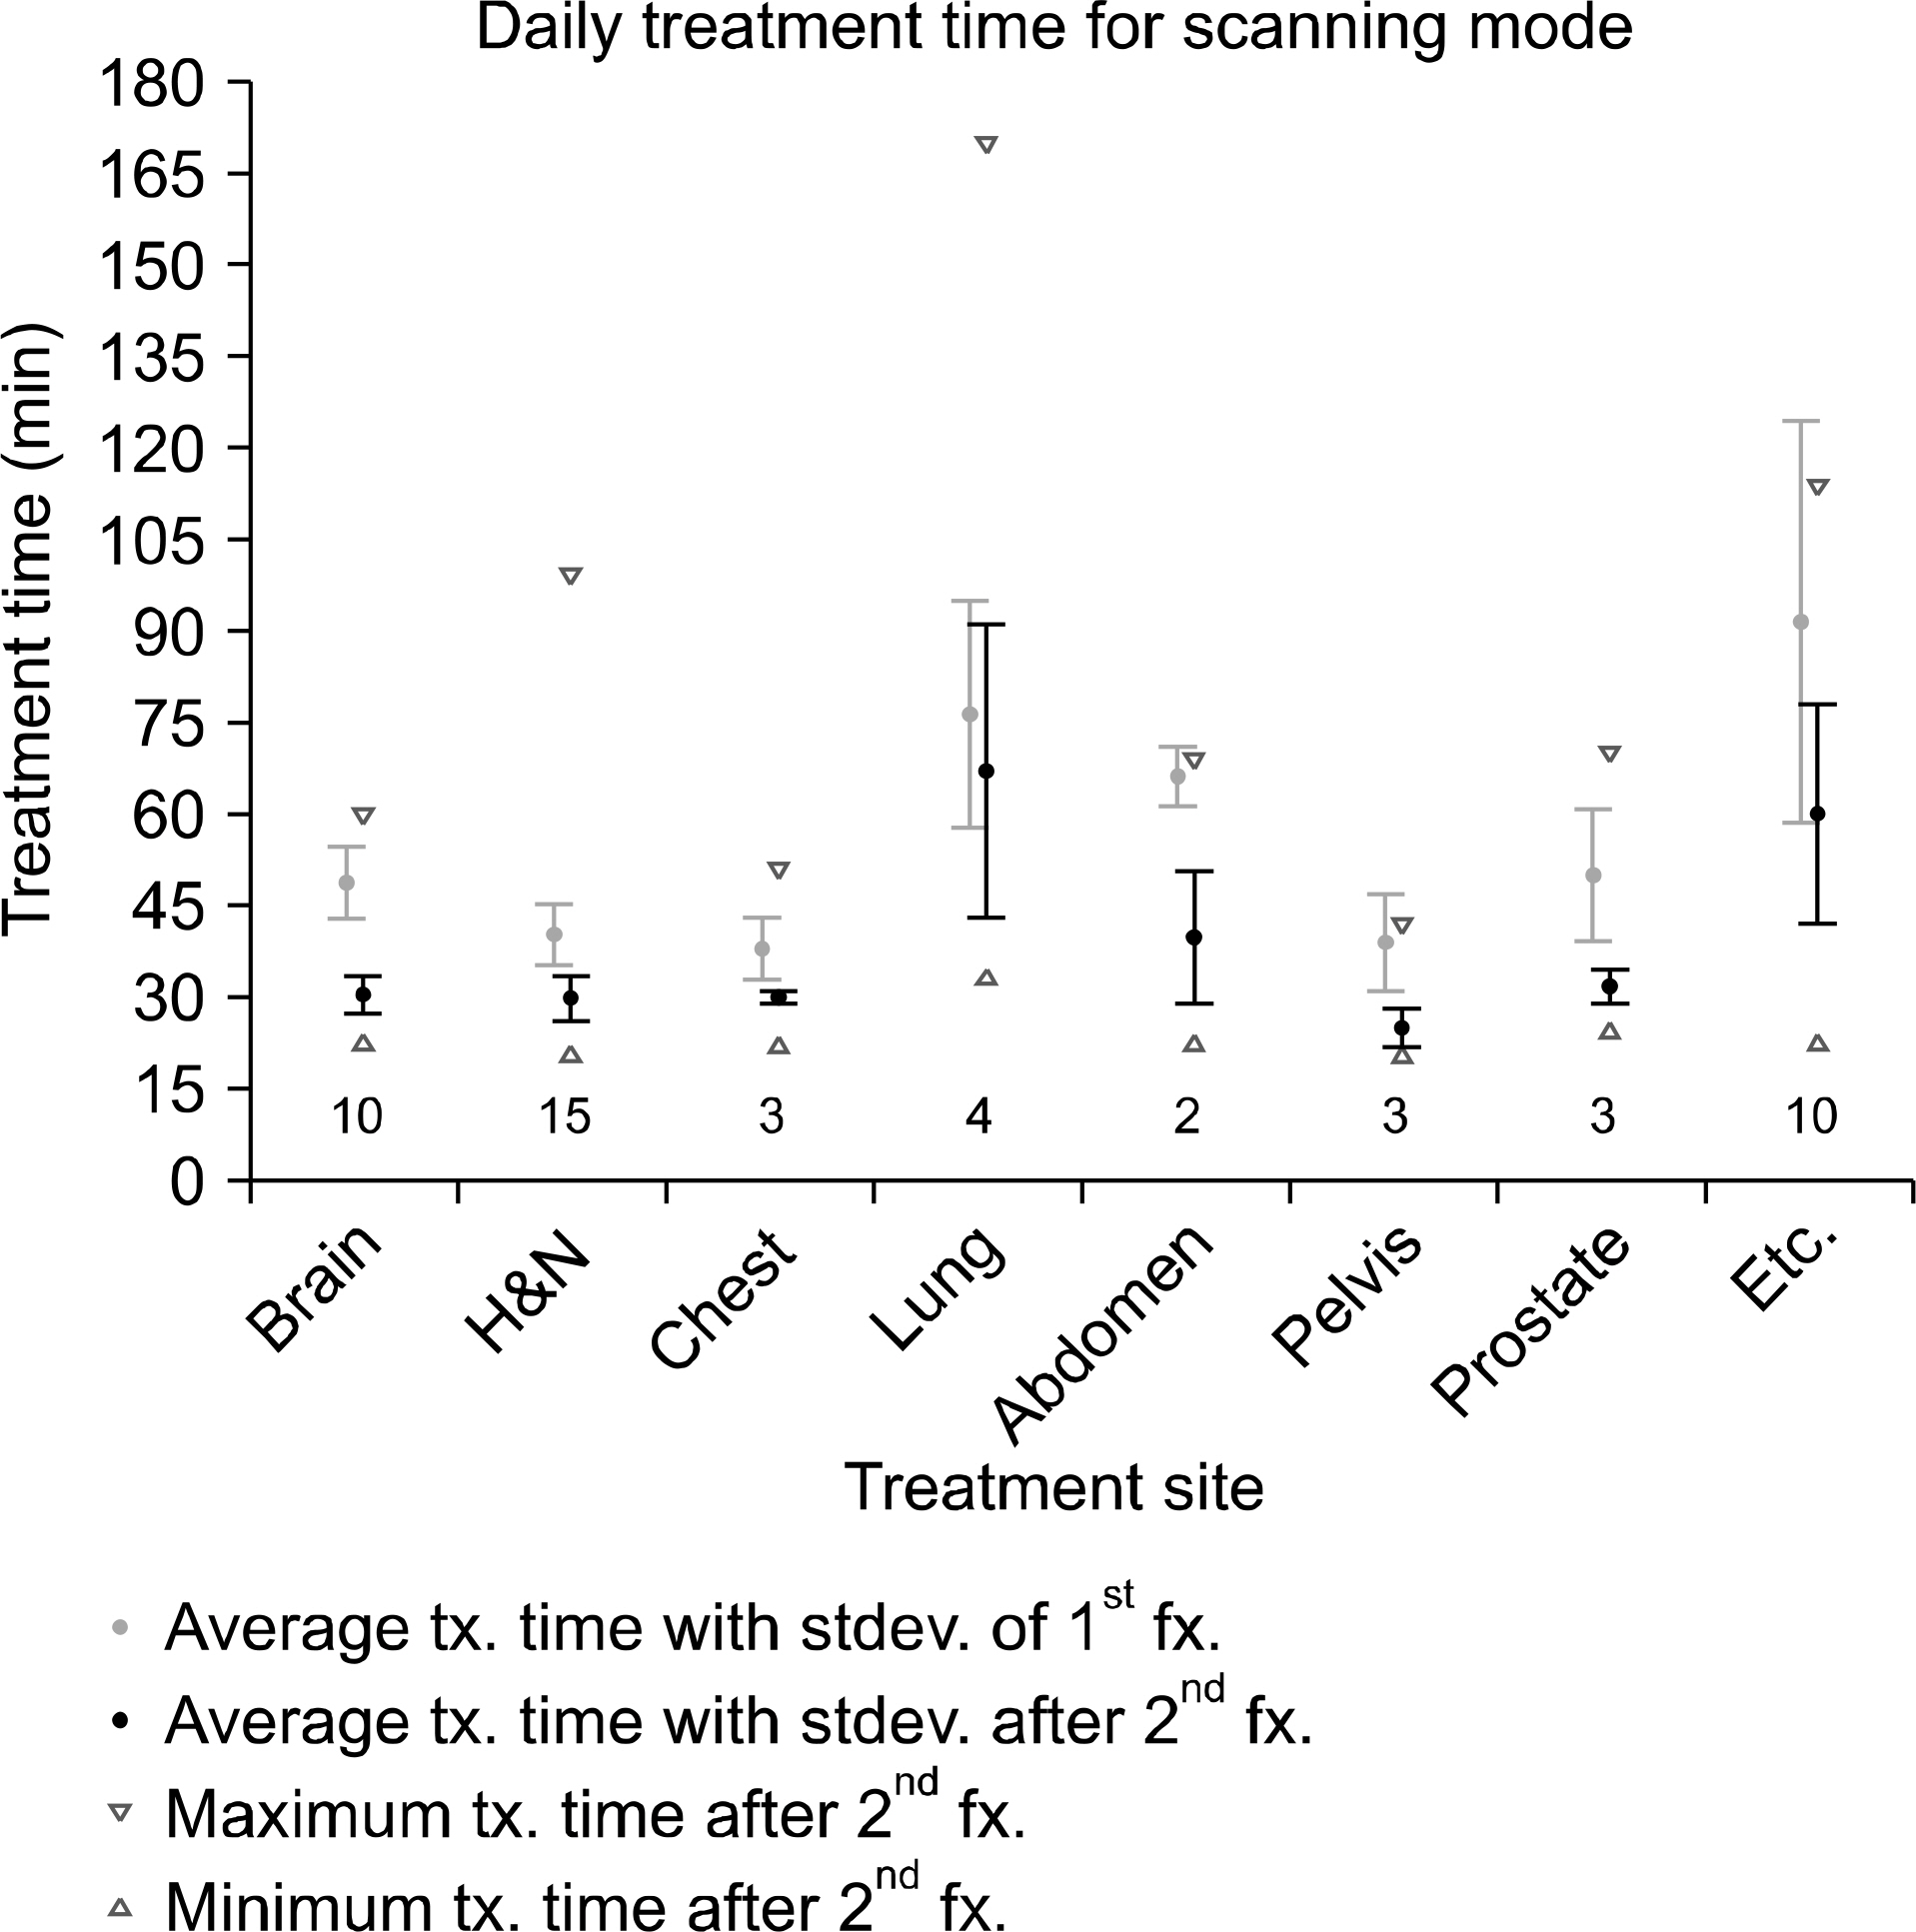
Fig. 2. Site-specific daily average of proton treatment time for the scanning mode. Pink: averaged treatment time with standard deviation only for the first fraction of treatment for each patient. Blue: averaged treatment time with standard deviation after the second fraction of treatment. The standard deviation of each graph is indicated by upper and lower bars and average values are denoted by solid dots in the middle of the range. Red upward (downward) triangles are minimum (maximum) values of treatment time after the second fraction of treatment. At the bottom of the graph, the boxed numbers are the numbers of patients for each treatment site. tx.: Treatment, fx.: fraction.
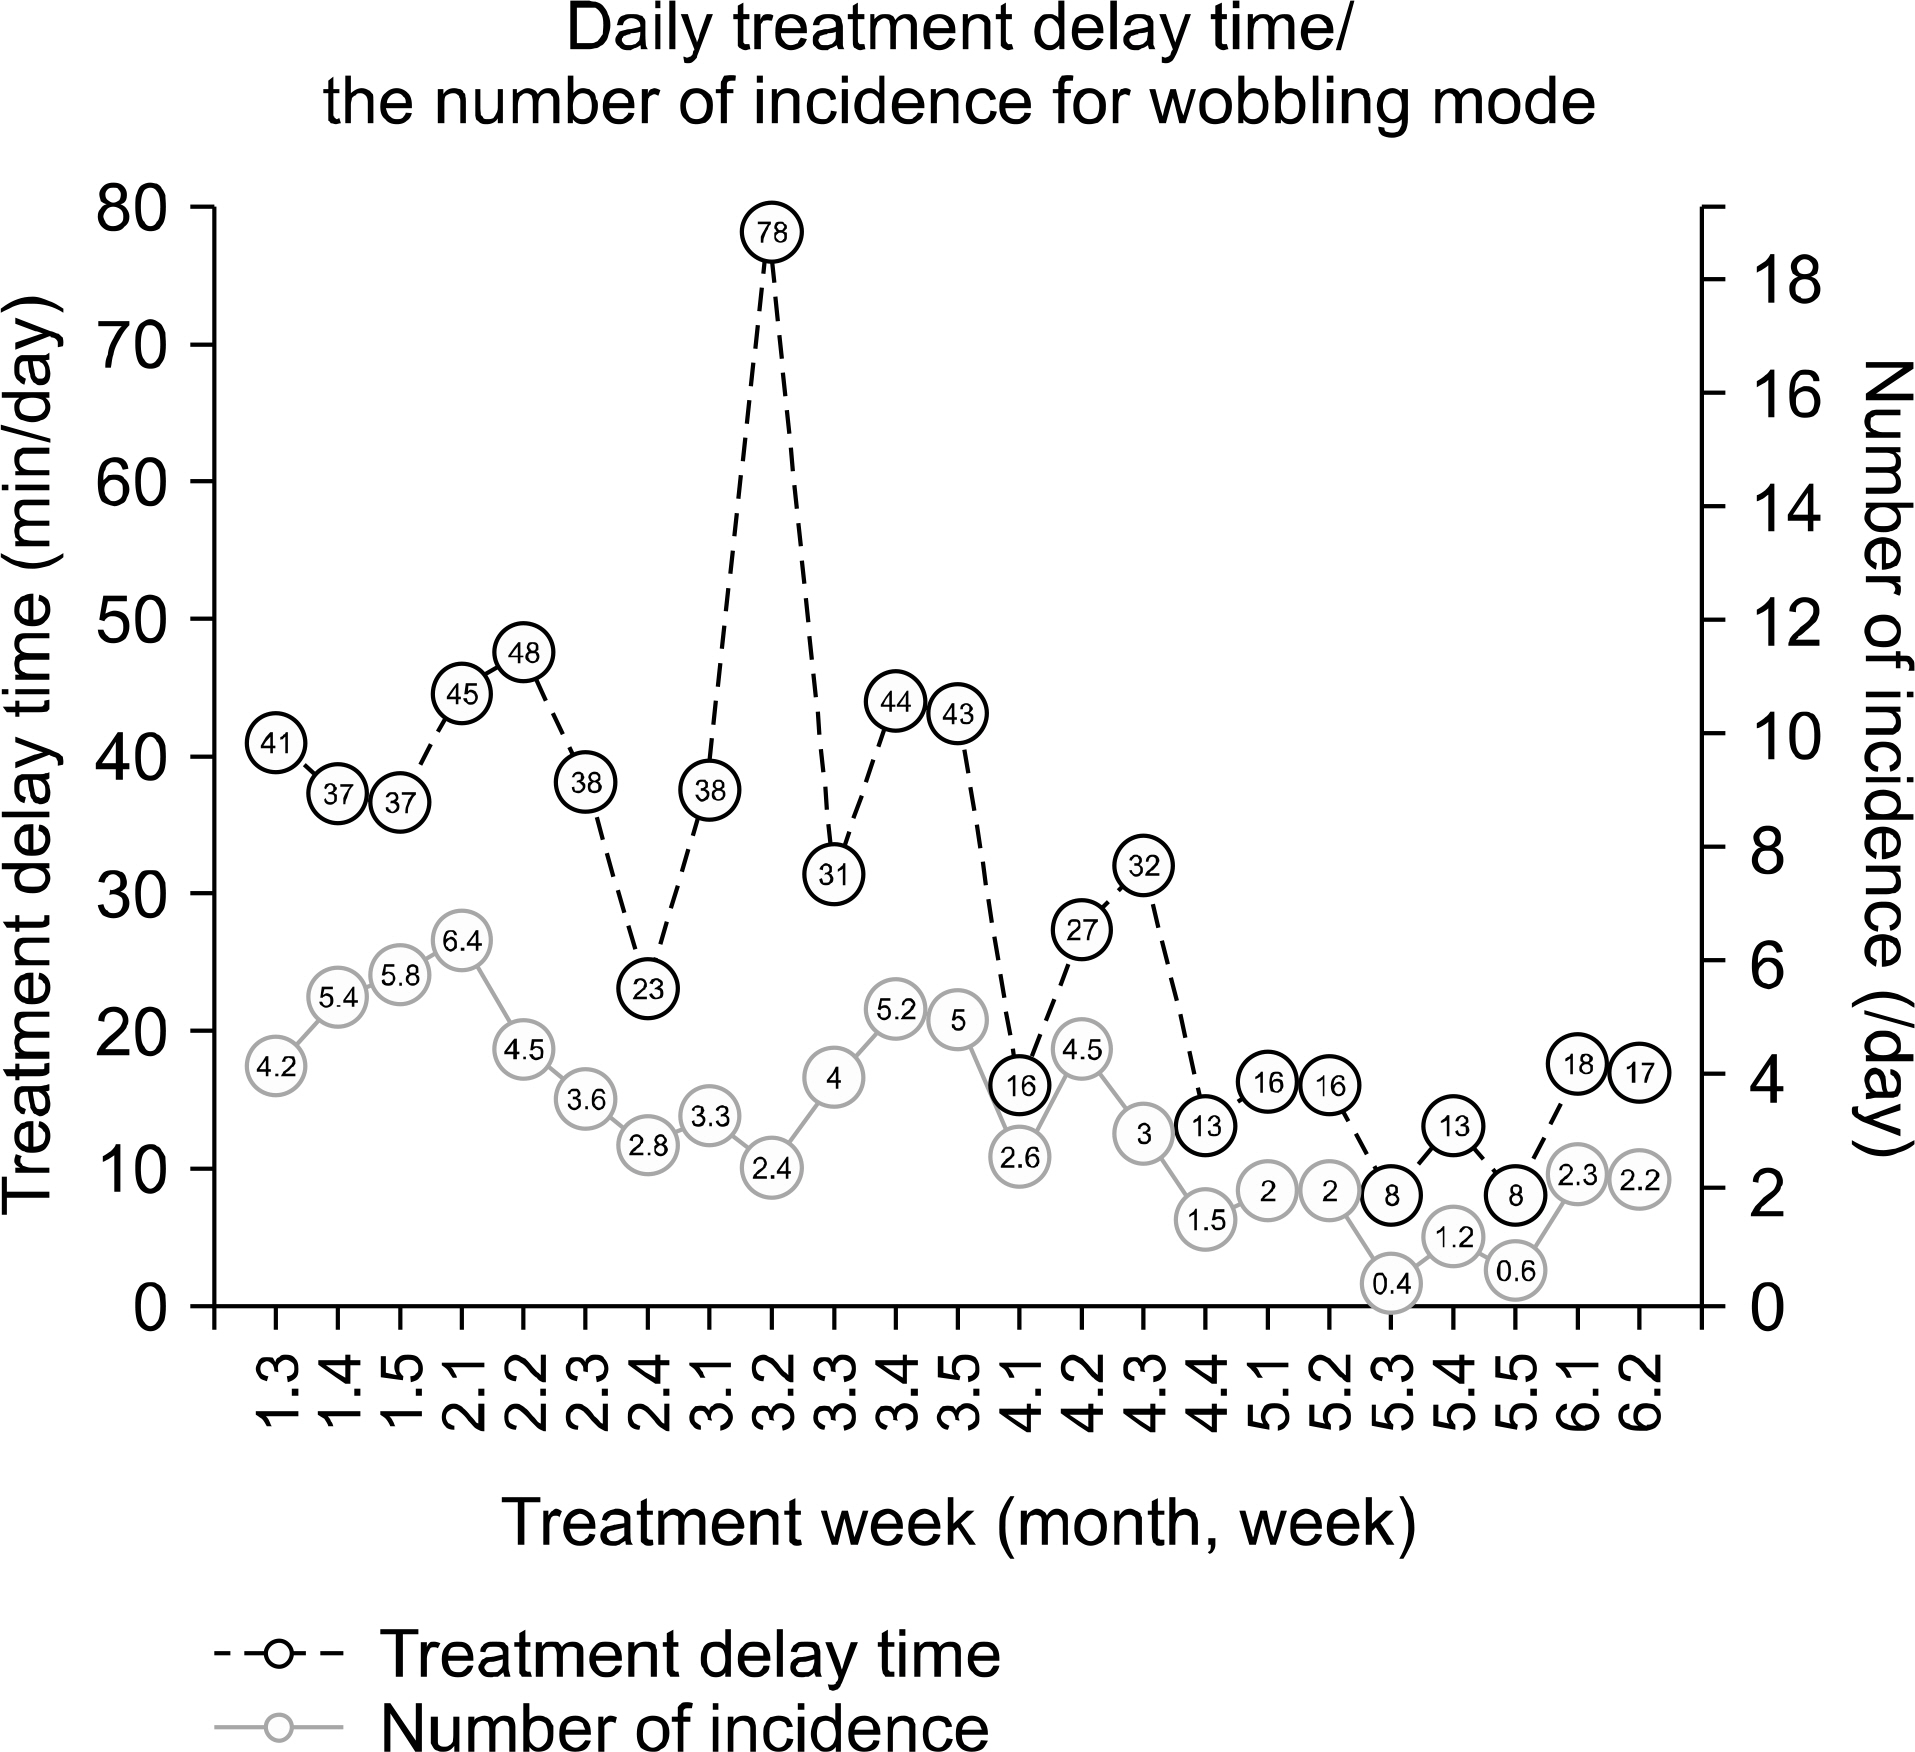
Fig. 3. The number of incidents causing treatment delays and average delay time for the wobbling mode. Left axis/blue dots: daily averaged treatment delay time at that week. Right axis/red line: daily average number of incidents during the given week.
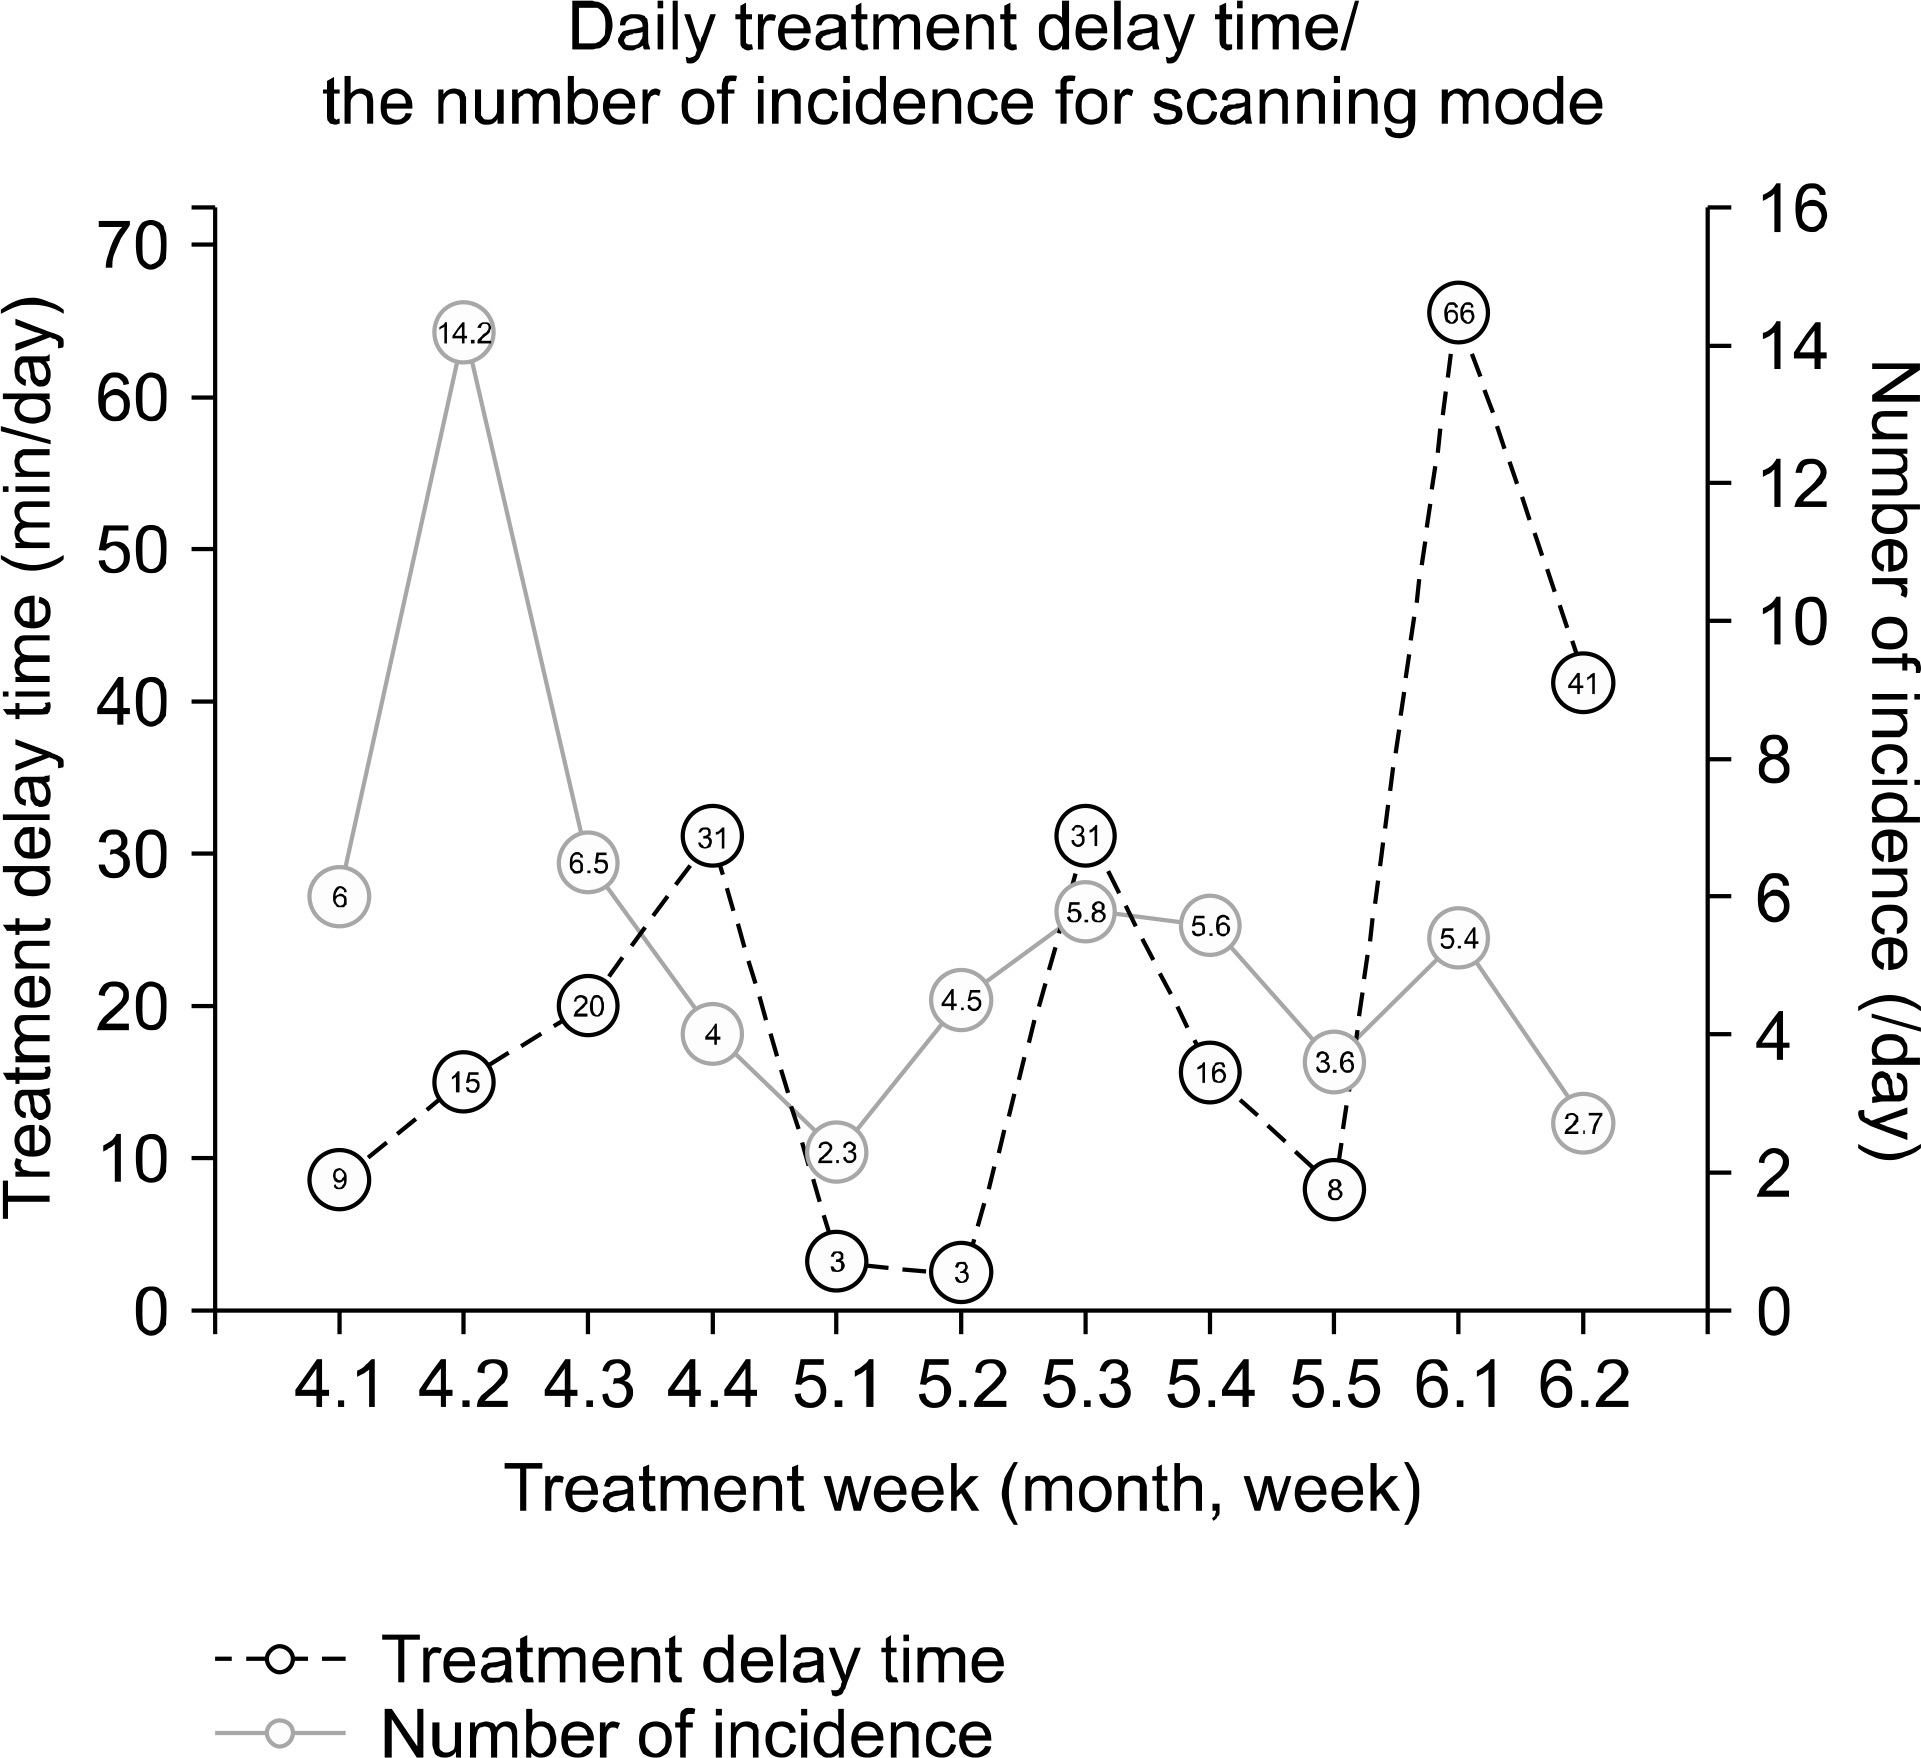
Fig. 4. The number of incidents causing treatment delays and average delay time for the line-scanning mode. Left axis/blue dots: daily averaged treatment delay time during the given week. Right axis/red line: daily average number of incidents during the given week.
Reference
-
1. Lodge M, et al. A systematic literature review of the clinical and cost-effectiveness of hadron therapy in cancer. Radiother Oncol. 83(2):110–122. 2007.
Article2. Goitein M, Jermann M. The relative costs of proton and X-ray radiation therapy. Clin Oncol (R Coll Radiol). 15(1):S37–50. 2003.
Article3. Peeters A, Grutters JP, et al. How costly is particle therapy? Cost analysis of external beam radiotherapy with carbon-ions, protons and photons. Radiother Oncol. 95(1):45–53. 2010.
Article4. SUZUKI K, et al. Quantitative analysis of beam delivery parameters and treatment process time for proton beam therapy. Med Phys. 38(7):4329–4337. 2011.
Article5. SUZUKI K, et al. Quantitative analysis of treatment process time and throughput capacity for spot scanning proton therapy. Med Phys. 43(7):3975–3986. 2016.
Article6. Chung K, Han Y, et al. The first private-hospital based pro ton therapy center in Korea; status of the Proton Therapy Center at Samsung Medical Center. Radiat Oncol J. 33(4):337–343. 2015.7. Nguyen PL, Zietman AL. High-dose external beam radiation for localized prostate cancer: current status and future challenges. Cancer J. 13:295–301. 2007.
Article8. Zietman AL, DeSilvio ML, Slater JD, et al. Comparison of conventional-dose vs high-dose conformal radiation therapy in clinically localized adenocarcinoma of the prostate: a randomized controlled trial. JAMA. 294:1233–9. 2005.9. Slater JD, Rossi Jr CJ, Yonemoto LT, et al. Proton therapy for prostate cancer: the Initial Loma Linda University experience. Int J Radiat Oncol Biol Phys. 59:348–52. 2004.
Article10. Bush DA, Slater JD, Shin BB, Cheek G, Miller DW, Slater JM. Hypofractionated proton beam radiotherapy for stage I lung cancer. Chest. 126:1198–203. 2004.
Article11. Hata M, Tokuuye K, Kagei K, et al. Hypofractionated high-dose proton beam therapy for stage I non-small-cell lung cancer: preliminary results of a phase I/II clinical study. Int J Radiat Oncol Biol Phys. 68:786–93. 2007.
Article12. Orecchia R, Zurlo A, Loasses A, et al. Particle beam therapy (hadrontherapy): basis for interest and clinical experience. Eur J Cancer. 34:459–68. 1998.
Article13. Laramore GE. Role of particle radiotherapy in the manage ment of head and neck cancer. Curr Opin Oncol. 21:224–31. 2009.14. Jereczek-Fossa BA, Krengli M, Orecchia R. Particle beam radiotherapy for head and neck tumors: radiobiological basis and clinical experience. Head Neck. 28:750–60. 2006.
Article15. Hug EB, Sweeney RA, Nurre PM, Holloway KC, Slater JD, Munzenrider JE. Proton radiotherapy in management of pediatric base of skull tumors. Int J Radiat Oncol Biol Phys. 52:1017–24. 2002.
Article16. Munzenrider JE, Liebsch NJ. Proton therapy for tumors of the skull base. Strahlenther Onkol. 175:57–63. 1999.
Article17. Noël G, Habrand JL, Jauffret E, et al. Radiation therapy for chordoma and chondrosarcoma of the skull base and the cervical spine. Prognostic factors and patterns of failure. Strahlenther Onkol. 179:241–8. 2003.18. Van de Werf E, Verstraete J, Lievens Y. The cost of radiotherapy in a decade of technology evolution. Radiother Oncol. 102(1):148–53. 2012.
Article19. Van de Werf E, Lievens Y, et al. Time and motion study of radiotherapy delivery: Economic burden of increased quality assurance and IMRT. Radiother Oncol. 93(1):137–40. 2009.
Article20. Lievens Y, van den Bogaert W, Kesteloot K. Activity- based costing: a practical model for cost calculation in radiotherapy. Int J Radiat Oncol Biol Phys. 57(2):522–35. 2003.
- Full Text Links
-
- Actions
-
Cited
- CITED
-
- Close
- Share
-
- Similar articles
-
- Proton Therapy Review: Proton Therapy from a Medical
- Current status of proton therapy techniques for lung cancer
- Proton Therapy for Head and Neck Cancer: Current Clinical Applications and Future Direction
- Erratum: Proton Therapy Review: Proton Therapy from a Medical
- Proton therapy: the current status of the clinical evidences
