J Korean Ophthalmol Soc.
2010 Aug;51(8):1084-1091.
Analysis of Various Artifacts Produced by Spectral-Domain Optical Coherence Tomography Based on Macular Pathologies
- Affiliations
-
- 1Department of Ophthalmology, Hanyang University College of Medicine, Seoul, Korea. brlee@hanyang.ac.kr
Abstract
- PURPOSE
To report the frequency, severity and various types of artifacts associated with spectral-domain optical coherence tomography (SD-OCT) based on macular pathologies.
METHODS
Data was collected retrospectively from 116 eyes of 116 subjects. SD-OCT (3D-1000, Topcon Corp., Japan) imaging was performed in 40 healthy eyes, 45 eyes with intraretinal pathology (IRP) and 31 eyes with subretinal pathology (SRP). The scan protocol was 12x6 mm radial scan. The frequency and types of artifacts were investigated in each scan and were analyzed based on macular disease. Additionally, the effect of artifacts on the measurement of macular thickness was studied.
RESULTS
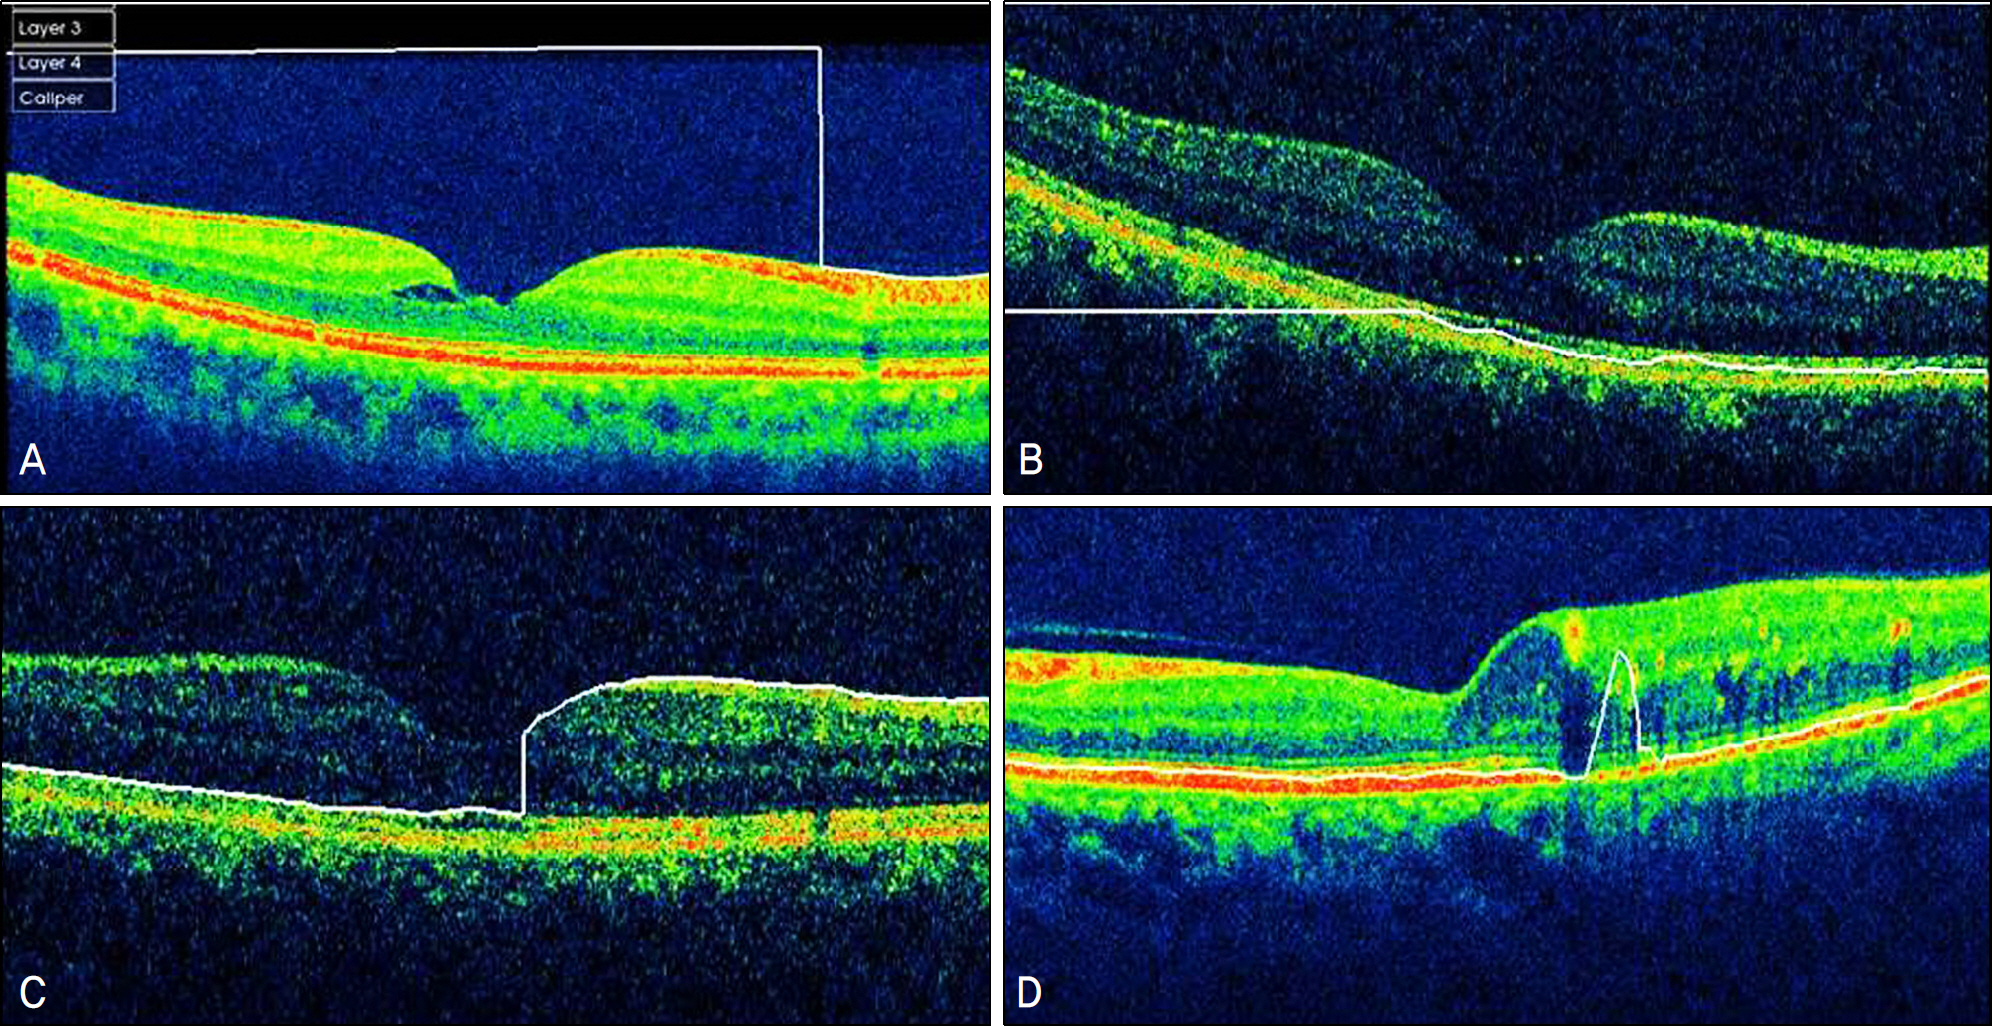
Errors occurred in 77 eyes (66.38%). Inner retinal boundary misidentification (IRBM) was the most common error (25.86%), with the frequencies of other types of artifacts being 10.34% for off-center fixation, 15.52% for degraded image and 8.6% for outer retinal boundary misidentification (ORBM). The overall error rate of SD-OCT in the retinal pathology group was much higher than that in the normal group. Macular thickness was underestimated in the IRP group because the outer retinal boundary of the IRP group tended to be misidentified toward the inner retina (p<0.01).
CONCLUSIONS
SD-OCT can frequently cause various types of artifacts in patients with macular disease. When interpreting OCT images, the artifacts of SD-OCT should be considered in order to obtain accurate macular thickness and to prevent erroneous clinical decisions.
MeSH Terms
Figure
Reference
-
References
1. Huang D, Swanson EA, Lin CP, et al. Optical coherence tomography. Sience. 1991; 254:1178–81.
Article2. Leung CK, Chan WM, Chong KK, et al. Alignment artifacts in optical coherence tomography analyzed images. Ophthalmology. 2007; 114:263–70.
Article3. Patel PJ, Chen FK, Cruz L, Tufail A. Segmentation error in Stratus optical coherence tomography for neovascular age-related macular degeneration. Invest Ophthalmol Vis Sci. 2009; 50:399–404.
Article4. Ghazi NG, Kirk T, Allam S, Yan G. Quantification of error in optical coherence tomography central macular thickness in wet age-related macular degeneration. Am J Ophthalmol. 2009; 148:90–6.5. Ray R, Stinnett SS, Jaffe GJ. Evaluation of image artifact produced by optical coherence tomography of retinal pathology. Am J Ophthalmol. 2005; 139:18–29.
Article6. Sadda SR, Wu Z, Walsh AC, et al. Errors in retinal thickness measurements obtained by optical coherence tomography. Ophthalmology. 2006; 113:285–93.
Article7. Sadda SR, Joeres S, Wu Z, et al. Error correction and quantitative subanalysis of optical coherence tomography data using computer assisted grading. Invest Ophthalmol Vis Sci. 2007; 48:839–48.8. Domalpally A, Danis RP, Zhang B, et al. Quality issue in interpretation of optical coherence tomograms in macular diseases. Retina. 2009; 29:775–81.9. Fung AE, Lalwani GA, Rosenfeld PJ, et al. An optical coherence tomography-guided, variable dosing regimen with intravitreal ranibizumab (Lucentis) for neovascular age-related macular degeneration. Am J Ophthalmol. 2007; 143:566–83.
Article10. Scott IU, Edwards AR, Beck RW, et al. A phase II randomized clinical trial of intravitreal bevacizumab for diabetic macular edema. Ophthalmology. 2007; 114:1860–7.
Article11. Arevalo JF, Sanchez JG, Wu L, et al. Primary intravitreal bevacizumab for diffuse diabetic macular edema: the Pan-American Collaborative Retina Study Group at 24 months. Ophthalmology. 2009; 116:1488–97.12. Keane PA, Liakopoulos S, Jivrajka RV, et al. Evaluation of optical coherence tomography retinal thickness parameters for use in clinical trials for neovascular age-related macular degeneration. Invest Ophthalmol Vis Sci. 2009; 50:3378–85.
Article13. Costa RA, Calucci D, Skaf M, et al. Optical coherence tomography 3: automatic delineation of the outer neural boundary and its influence on retinal thickness measurements. Invest Ophthalmol Vis Sci. 2004; 45:2399–406.14. Wojtkowski M, Bajraszewski T, Gorczyń ska I, et al. Ophthalmic imaging by spectral optical coherence tomography. Am J Ophthalmol. 2004; 138:412–9.
Article15. Wojtkowski M, Srinivasan V, Fujimoto JG, et al. Threedimensional retinal imaging with high-speed ultrahigh-resolution optical coherence tomography. Ophthalmology. 2005; 112:1734–46.
Article16. Schmidt-Erfurth U, Leitgeb RA, Michels S, et al. Threedimensional ultrahigh-resolution optical coherence tomography of macular diseases. Invest Ophthalmol Vis Sci. 2005; 46:3393–402.
Article17. Alam S, Zawadzki RJ, Choi S, et al. Clinical application of rapid serial Fourier-domain optical coherence tomography for macular imaging. Ophthalmology. 2006; 113:1425–31.
Article18. Ho J, Sull AC, Vuong LN, et al. Assessment of artifacts and reproducibility across spectral- and time-domain opitical coherence tomography devices. Ophthalmology. 2009; 116:1960–70.19. Tappeiner C, Barthelmes D, Abegg MH, et al. Impact of optic media opacities and image compression on quantitative analysis of optical coherence tomography. Invest Ophthalmol Vis Sci. 2008; 49:1609–14.
Article20. Kok PH, van Dijk HW, van den Berg TJ, Verbraak FD. A Model for the Effect of Disturbances in the Optical Media on the OCT Image Quality. Invest Ophthalmol Vis Sci. 2009; 50:787–92.
Article21. Keane PA, Mand PS, Liakopoulos S, et al. Accuracy of retinal thickness measurements obtained with Cirrus optical coherence tomography. Br J Ophthalmol. 2009; 93:1461–7.
Article22. Sayanagi K, Sharma S, Yamamoto T, Kaiser PK. Comparison of Spectral-Domain versus Time-Domain Optical Coherence Tomography in Management of Age-Related Macular Degeneration with Ranibizumab. Ophthalmology. 2009; 116:947–55.
Article
- Full Text Links
- Actions
-
Cited
- CITED
-
- Close
- Share
- Similar articles
-
- Artifacts Associated with Spectral-Domain Optical Coherence Tomography
- Macular Thickness Changes with Age and Gender in Emmetropia Using Spectral Domain Optical Coherence Tomography
- Repeatability of Spectral Domain OCT (3D-OCT 1000) in Normal Subjects and Various Macular Diseases
- Analysis of Factors Associated with Variability in Measures Obtained by Spectral Domain Optical Coherence Tomography
- Mean Macular Volume in Normal Korean Eyes Measured by Spectral-domain Optical Coherence Tomography


