Artifacts Associated with Spectral-Domain Optical Coherence Tomography
- Affiliations
-
- 1Department of Ophthalmology, Konkuk University Medical Center, Konkuk University School of Medicine, Seoul, Korea. eyekim@kuh.ac.kr
- KMID: 2214771
- DOI: http://doi.org/10.3341/jkos.2011.52.8.943
Abstract
- PURPOSE
To report frequencies of image artifacts associated with spectral-domain optical coherence tomography (SD-OCT) and to evaluate the impact of artifacts on foveal thickness measurements.
METHODS
This retrospective study included 267 eyes of 267 patients who underwent OCT volume scanning using Spectralis HRA+OCT (Heidelberg Engineering, Heidelberg, Germany). Macular volume scans of normal and diseased eyes were systematically evaluated for image artifacts within each scan overall and within the center 1-mm area. The frequency of each artifact type was compared for scans stratified by diagnosis category.
RESULTS
Among the volume scans, 79.4% had at least 1 artifact overall, and 26.6% had at least 1 artifact in the center 1-mm area. The highest percentage of inner retina misidentification occurred in the epiretinal membrane (36.1%), whereas the highest percentage of outer retina misidentification occurred in neovascular age-related macular degeneration (wet AMD, 40.0%). Clinically significant artifacts involving the center 1-mm area were observed in 6.4% of volume scans and were most common in wet AMD (43.3%).
CONCLUSIONS
Image artifacts in SD-OCT volume scanning are common, but relatively less common in the center 1-mm area of scans. Clinicians should carefully review scans for artifacts when using SD-OCT images and retinal thickness measurements because clinically significant artifacts may affect retinal thickness measurements.
MeSH Terms
Figure
-
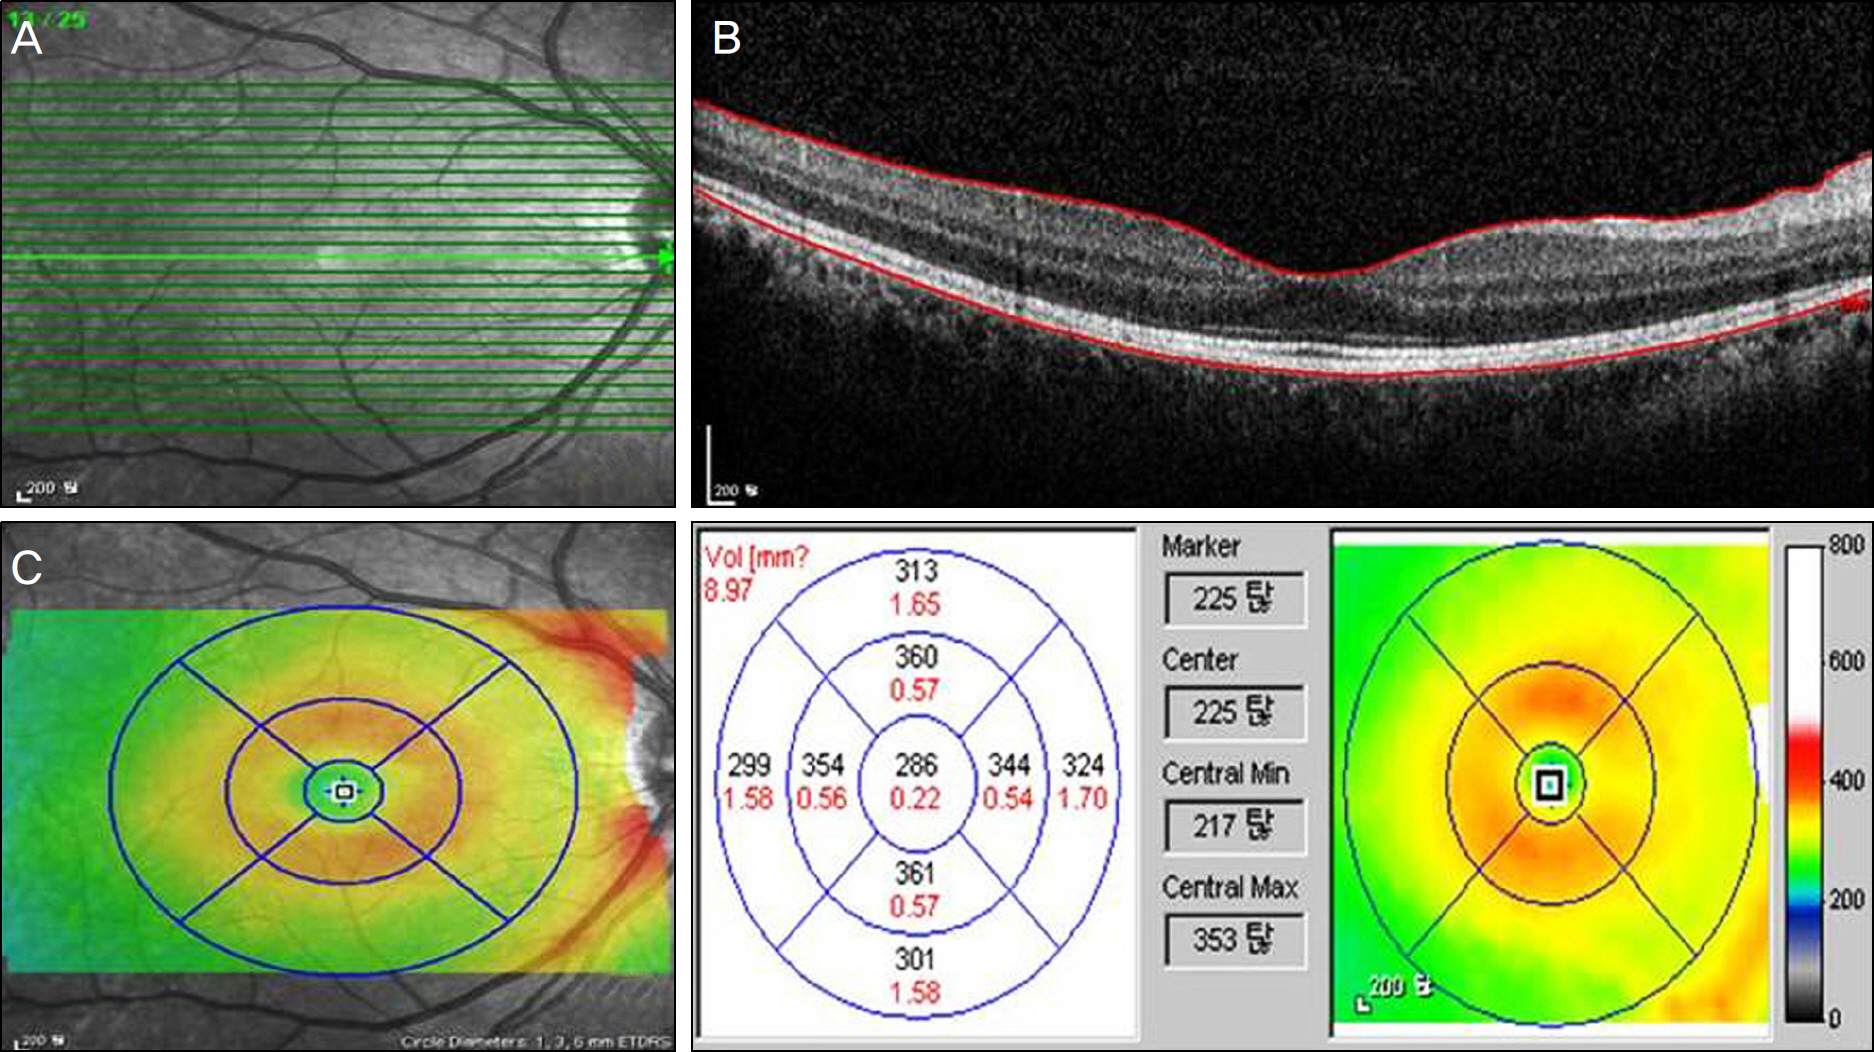
Figure 1. Example of Spectralis volume scan output display. (A) Fundus image showing scan area and individual horizontal line scans. (B) Cross-sectional image and segmentation line of a normal eye with inner retina layer segmentation at the internal limiting membrane and outer retina layer segmentation at the Bruch's membrane. (C) False-color thickness map with overlying 1, 3, 6 mm concentric circles, corresponding thickness measurements and thickness map.
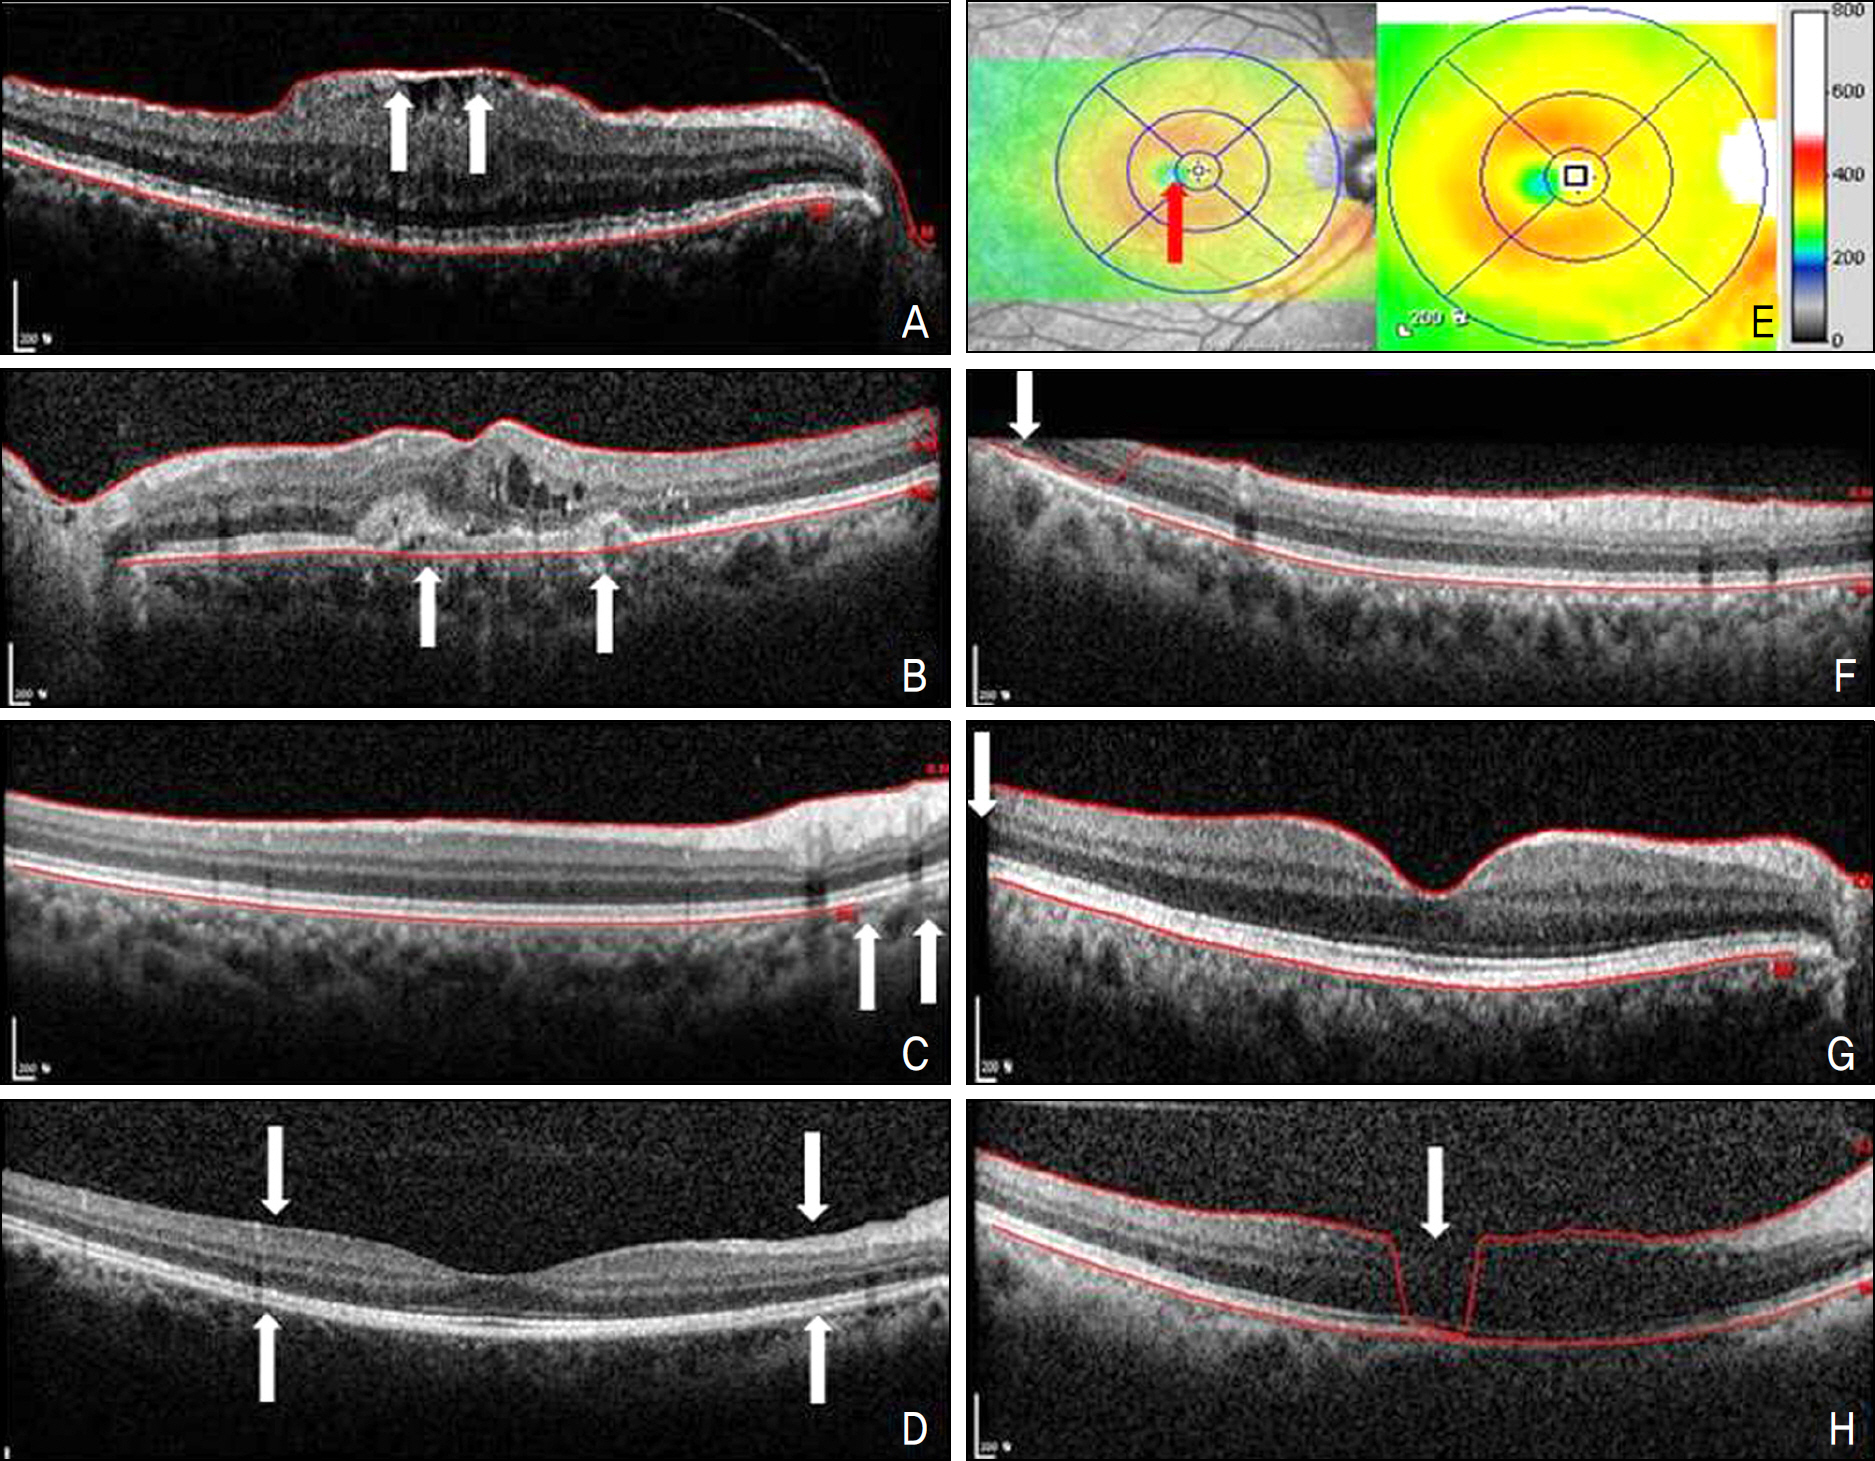
Figure 2. Types of artifacts. (A) Inner retina misidentification. (B) Outer retina misidentification. (C) Incomplete segmentation line. (D) No segmentation line. (E) Off-center. (F) Out of register. (G) Cut edge. (H) Degraded.
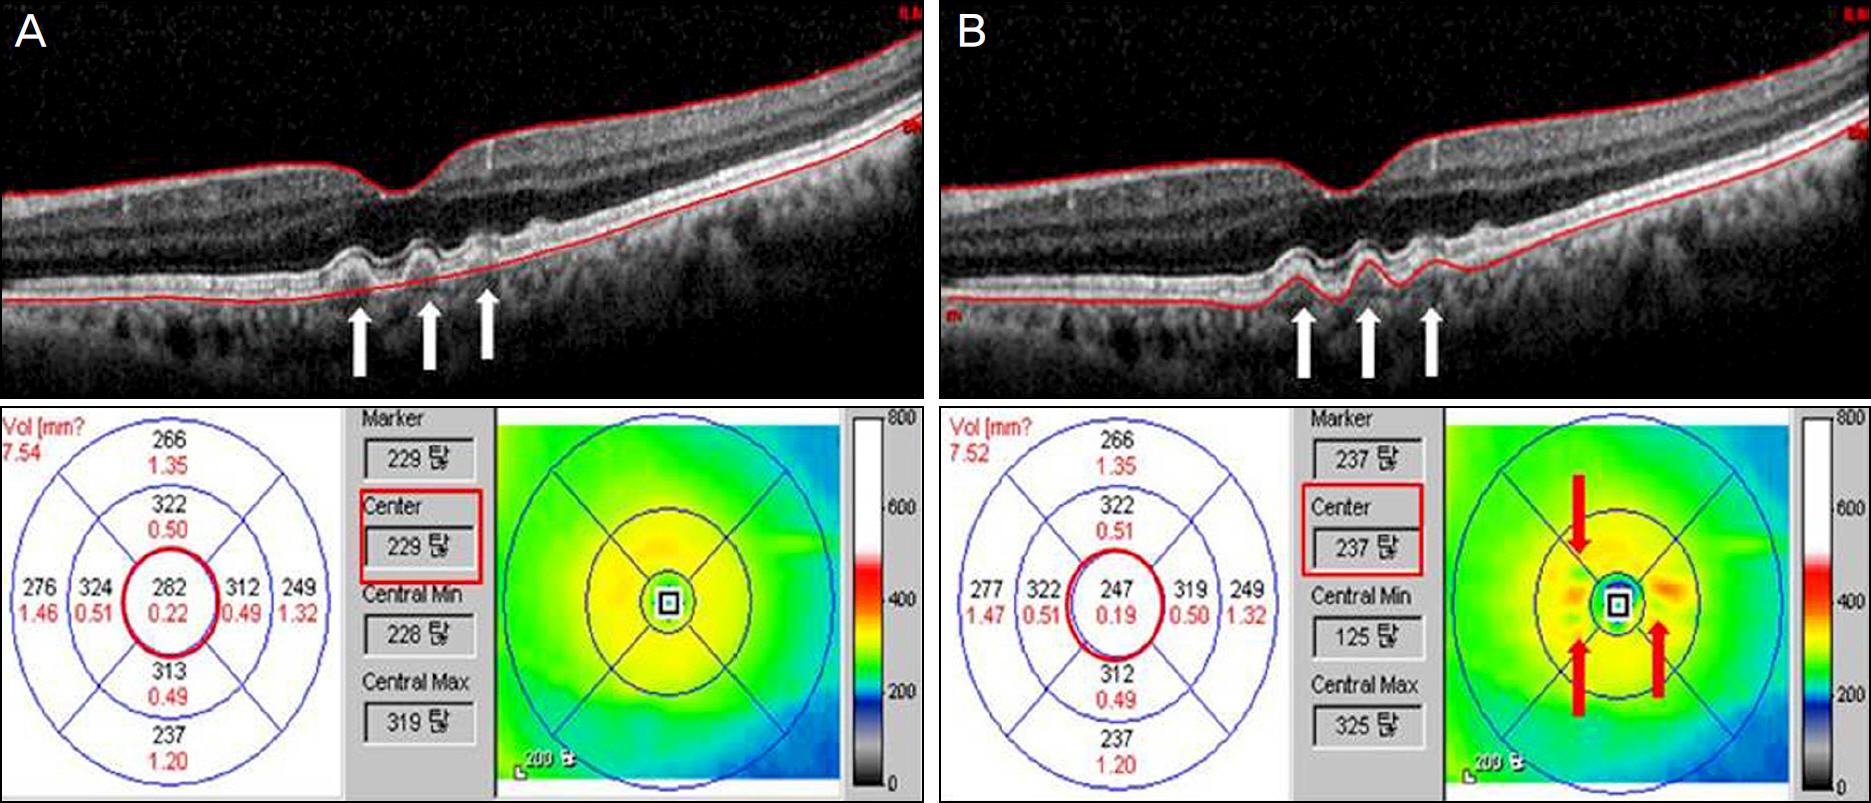
Figure 3. Segmentation error correction and retinal thickness maps. (A) Line scan from a patient with age-related macular degeneration. White arrows indicate places where automated segmentation algorithm fail to follow the retinal pigment epithelium (RPE) pattern created by drusen. Automated macular center thickness (red rectangle) and foveal thickness (red circle) measurements are shown. (B) Same cross-sectional image with segmentation manually adjusted to follow the RPE contour of the outer retina boundary. Note the changes in macular center thickness (red rectangle) and foveal thickness (red circle) measurements. Red arrows point to thinner retinal areas associated with drusen not seen on the uncorrected thickness map.
Cited by 1 articles
-
Changes in the Ganglion Cell-inner Plexiform Layer after Consecutive Intravitreal Injections of Anti-vascular Endothelial Growth Factor in Age-related Macular Degeneration Patients
Se Young Kim, Myung Hun Yoon, Hee Seung Chin
Korean J Ophthalmol. 2020;34(1):11-18. doi: 10.3341/kjo.2019.0081.
Reference
-
References
1. Leung CK, Chan WM, Chong KK, et al. Alignment artifacts in optical coherence tomography analyzed images. Ophthalmology. 2007; 114:263–70.
Article2. Patel PJ, Chen FK, da Cruz L, Tufail A. Segmentation error in Stratus optical coherence tomography for neovascular age-related macular degeneration. Invest Ophthalmol Vis Sci. 2009; 50:399–404.
Article3. Ghazi NG, Kirk T, Allam S, Yan G. Quantification of error in optical coherence tomography central macular thickness measurement in wet age-related macular degeneration. Am J Ophthalmol. 2009; 148:90–6.
Article4. Ray R, Stinnett SS, Jaffe GJ. Evaluation of image artifact produced by optical coherence tomography of retinal pathology. Am J Ophthalmol. 2005; 139:18–29.
Article5. Sadda SR, Wu Z, Walsh AC, et al. Errors in retinal thickness measurements obtained by optical coherence tomography. Ophthalmology. 2006; 113:285–93.
Article6. Sadda SR, Joeres S, Wu Z, et al. Error correction and quantitative subanalysis of optical coherence tomography data using aberrations grading. Invest Ophthalmol Vis Sci. 2007; 48:839–48.7. Domalpally A, Danis RP, Zhang B, et al. Quality issues in interpretation of optical coherence tomograms in macular diseases. Retina. 2009; 29:775–81.
Article8. Hangai M, Ojima Y, Gotoh N, et al. Three-dimensional imaging of macular holes with high-speed optical coherence tomography. Ophthalmology. 2007; 114:763–73.
Article9. Ahlers C, Michels S, Beckendorf A, et al. Three-dimensional imaging of pigment epithelial detachment in age-related macular degeneration using optical coherence tomography, retinal thickness analysis and topographic angiography. Graefes Arch Clin Exp Ophthalmol. 2006; 244:1233–9.
Article10. Ho J, Sull AC, Vuong LN, et al. Assessment of artifacts and reproducibility across spectral- and time-domain optical coherence tomography devices. Ophthalmology. 2009; 116:1960–70.
Article11. Han IC, Jaffe GJ. Evaluation of artifacts associated with macular spectral-domain optical coherence tomography. Ophthalmology. 2010; 117:1177–89.
Article12. Tappeiner C, Barthelmes D, Abegg MH, et al. Impact of optic media opacities and image compression on quantitative analysis of optical coherence tomography. Invest Ophthalmol Vis Sci. 2008; 49:1609–14.
Article13. Kok PH, van Dijk HW, van den Berg TJ, Verbraak FD. A model for the effect of disturbances in the optical media on the OCT image quality. Invest Ophthalmol Vis Sci. 2009; 50:787–92.
Article14. Diabetic Retinopathy Clinical Research Network. Reproducibility of macular thickness and volume using Zeiss optical coherence tomography in patients with diabetic macular edema. Ophthalmology. 2007; 114:1520–5.15. Browning DJ, Fraser CM, Propst BW. The variation in optical coherence tomography-measured macular thickness in diabetic eyes without clinical macular edema. Am J Ophthalmol. 2008; 145:889–93.
Article16. Forooghian F, Cukras C, Meyerle CB, et al. Evaluation of time domain and spectral domain optical coherence tomography in the measurement of diabetic macular edema. Invest Ophthalmol Vis Sci. 2008; 49:4290–6.
Article17. Wolf-Schnurrbusch UE, Ceklic L, Brinkmann CK, et al. Macular thickness measurements in healthy eyes using six different optical coherence tomography instruments. Invest Ophthalmol Vis Sci. 2009; 50:3432–7.
Article18. Leung CK, Cheung CY, Weinreb RN, et al. Comparison of macular thickness measurements between time domain and spectral domain optical coherence tomography. Invest Ophthalmol Vis Sci. 2008; 49:4893–7.
Article19. Patel PJ, Chen FK, Ikeji F, et al. Repeatability of stratus optical coherence tomography measures in neovascular age-related macular degeneration. Invest Ophthalmol Vis Sci. 2008; 49:1084–8.
Article
- Full Text Links
-
- Actions
-
Cited
- CITED
-
- Close
- Share
-
- Similar articles
-
- Analysis of Various Artifacts Produced by Spectral-Domain Optical Coherence Tomography Based on Macular Pathologies
- A Case of Ocular Toxoplasmosis Imaged with Spectral Domain Optical Coherence Tomography
- Fundus Autofluorescence, Fluorescein Angiography and Spectral Domain Optical Coherence Tomography Findings of Retinal Astrocytic Hamartomas in Tuberous Sclerosis
- A Case of Double Fovea Artifact Detected with Spectral-domain Optical Coherence Tomography
- Comparison of the Efficacy between Time and Spectral Domain Optical Coherence Tomography for the Identification of Vitreomacular Interface
