Clinical Utility of Interictal High-Frequency Oscillations Recorded with Subdural Macroelectrodes in Partial Epilepsy
- Affiliations
-
- 1Department of Neurology, Samsung Medical Center, Sungkyunkwan University School of Medicine, Seoul, Korea. sbhong@skku.edu
- 2Epilepsy Research Lab, Clinical Research Center, Samsung Biomedical Research Institute, Seoul, Korea.
- 3Department of Neurosurgery, Samsung Medical Center, Sungkyunkwan University School of Medicine, Seoul, Korea.
- KMID: 2287614
- DOI: http://doi.org/10.3988/jcn.2012.8.1.22
Abstract
- BACKGROUND AND PURPOSE
There is growing interest in high-frequency oscillations (HFO) as electrophysiological biomarkers of the epileptic brain. We evaluated the clinical utility of interictal HFO events, especially their occurrence rates, by comparing the spatial distribution with a clinically determined epileptogenic zone by using subdural macroelectrodes.
METHODS
We obtained intracranial electroencephalogram data with a high temporal resolution (2000 Hz sampling rate, 0.05-500 Hz band-pass filter) from seven patients with medically refractory epilepsy. Three epochs of 5-minute, artifact-free data were selected randomly from the interictal period. HFO candidates were first detected by an automated algorithm and subsequently screened to discard false detections. Validated events were further categorized as fast ripple (FR) and ripple (R) according to their spectral profiles. The occurrence rate of HFOs was calculated for each electrode contact. An HFO events distribution map (EDM) was constructed for each patient to allow visualization of the spatial distribution of their HFO events.
RESULTS
The subdural macroelectrodes were capable of detecting both R and FR events from the epileptic neocortex. The occurrence rate of HFO events, both FR and R, was significantly higher in the seizure onset zone (SOZ) than in other brain regions. Patient-specific HFO EDMs can facilitate the identification of the location of HFO-generating tissue, and comparison with findings from ictal recordings can provide additional useful information regarding the epileptogenic zone.
CONCLUSIONS
The distribution of interictal HFOs was reasonably consistent with the SOZ. The detection of HFO events and construction of spatial distribution maps appears to be useful for the presurgical mapping of the epileptogenic zone.
Keyword
MeSH Terms
Figure
-

Fig. 1 Representative examples of high-frequency oscillations. Unfiltered raw traces are shown as blue lines, and their time-frequency decomposition plots are illustrated below. The units in the time-frequency plot are the number of standard deviations above mean (Z-score) of the baseline at each frequency. For A and B, segments of interest are magnified to show fast oscillations, where red traces represent the signal bandpassed from 200 to 500 Hz. Black vertical lines correspond to 200 µV. A: An example of a fast ripple (FR) event from the left parahippocampal gyrus of patient 7. Brief oscillatory activity (-15 ms) riding on a sharp wave is clearly visible, with a spectral peak at around 260 Hz. B: Another example of an FR event recorded from the basal temporal pole of patient 2. An FR event at around 300 Hz is riding on an epileptiform discharge. C: An example of a ripple (R) event from the right parietal lobe of patient 1. This one lasted almost 200 ms, with a spectral peak at around 110 Hz. D: Another example of a brief R event (-30 ms, peak at 81 Hz) from the right superior temporal gyrus of patient 4.

Fig. 2 Quantification of detected HFO events. Histograms for peak frequency (A), peak amplitude (B), and duration (C) of FR events, and peak frequency (D), peak amplitude (E), and duration (F) of R events. FR: fast ripple, HFO: high-frequency oscillations, R: ripple.
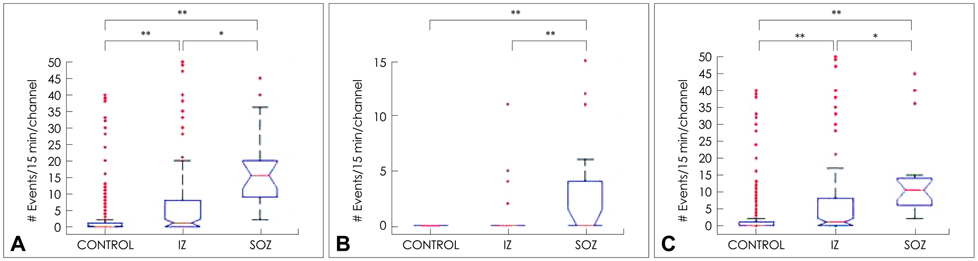
Fig. 3 Statistical results for total HFO events across the brain regions of interest: seizure onset zone (SOZ), irritative zone (IZ), and control (CONTROL) region. Kruskal-Wallis (KW) analysis of variance (ANOVA) revealed a significant difference between groups (KW statistic=143.00, p<0.0001). Box-plot diagrams and results from post-hoc analysis with the Wilcoxon rank-sum test are shown. In the box-plot diagrams, the upper and lower ends of the box-plots correspond to the 75th and 25th percentiles of the data, respectively, the red horizontal line indicates the median value, whiskers extend to the entire range of data, and outliers are indicated by red crosses. A: The total number of HFO events was significantly higher in the SOZ than in the IZ (*p<0.001 after Bonferroni correction) and CONTROL region (**p<0.0001 after Bonferroni correction). The occurrence rate of HFO events was also higher in the IZ than in the CONTROL region (**p<0.0001 after Bonferroni correction). B: FR event results. KW ANOVA showed a significant difference between groups (KW statistic=85.72). FR events occurred significantly more frequently in the SOZ than in both the IZ and CONTROL region (**p<0.0001 after Bonferroni correction). C: R event results. KW ANOVA revealed significant differences in the distribution of HFO R events (KW statistic=110.34). The occurrence rate of R events was higher in the SOZ than in the IZ (*p<0.001 after Bonferroni correction) and CONTROL region (**p<0.0001 after Bonferroni correction). There was also a significant difference between the IZ and CONTROL region (**p<0.0001 after Bonferroni correction). FR: fast ripple, HFO: high-frequency oscillations, R: ripple.
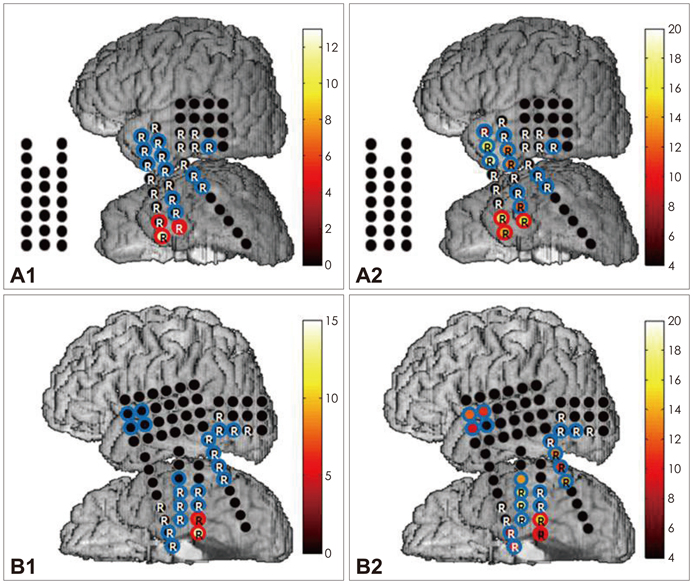
Fig. 4 Examples of HFO event distribution maps (EDMs). A: HFO EDMs of patient 2. SOZ electrodes were located in the anterior and basal part of the temporal lobe (shown by red circles); sites of frequent interictal spikes are labeled with blue circles. The color at each electrode contact represents the number of HFO events detected. The resected brain region is labeled as "R" on the contacts. A1: EDM for FR events. No FR event was found in the right temporal cortex (three strips on the left). FR events were found only at two electrode contacts, which were located in the anterior part of the basal temporal lobe. A2: EDM for R events. No R event was found in the right hemisphere. R events were found in the anterior part of both the basal and lateral temporal cortexes. The highest R event occurrence rate was in one of the electrodes on the lateral temporal lobe. B: HFO EDMs of patient 7. A lesion was located in the posterior lateral occipital area, but this patient's seizures originated from the posterior part of the basal temporal lobe. B1: EDM for FR events. FR events were only found at the two electrode contacts that exhibited the earliest ictal discharges. B2: EDM for R events. R events were mostly recorded in the basal temporal lobe, anterior lateral temporal lobe, and around the lesion. FR: fast ripple, HFO: high-frequency oscillations, R: ripple, SOZ: seizure onset zone.
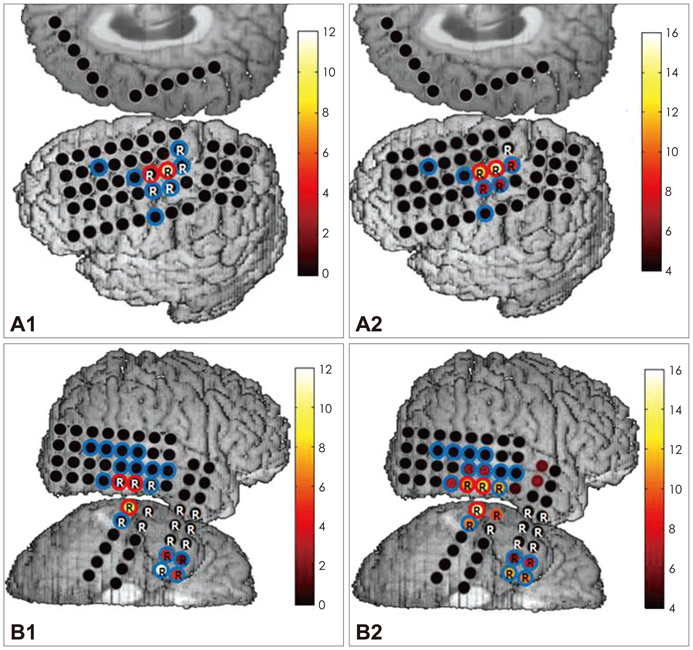
Fig. 5 Examples of HFO EDMs. A: HFO EDMs of patient 5 (using the same format as for Fig. 4). Seizures originated from an magnetic-resonance-imaging-visible lesion, which later turned out to be a dysembryoplastic neuroepithelial tumor, on the left middle frontal gyrus. A1: EDM of FR events. A small number of FR events was found only for one of the SOZ contacts. A2: EDM of R events. The spatial extent was wider for R events than for FR events, but was limited to only five electrode contacts near the SOZ. B: HFO EDMs of patient 3. Seizures started from a lesion in the right inferior temporal gyrus, and spread to the basal temporal lobe. B1: EDM of FR events. FR events were recorded at one of the contacts on the lesion. Electrode contacts in the basal temporal lobe generated more FR events than the lesional contact. B2: EDM of R events. R events were recorded mostly around the lesion and the basal temporal lobe. EDM: events distribution map, FR: fast ripple, HFO: high-frequency oscillations, R: ripple, SOZ: seizure onset zone.
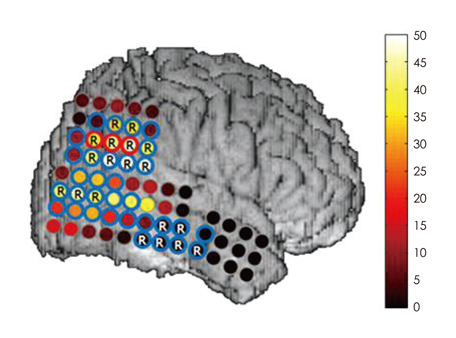
Fig. 6 HFO EDMs of patient 1 (using the same format as in Fig. 4). SOZ contacts were in the right temporal-parietal junction (red circles), and interictal spikes were widely observed at the lateral posterior temporal, inferior parietal, and occipital contacts. No FR events were found. R events were widely distributed in the lateral posterior brain region. EDM: events distribution map, FR: fast ripple, HFO: high-frequency oscillations, R: ripple, SOZ: seizure onset zone.
Reference
-
1. Dewar S, Passaro E, Fried I, Engel J Jr. Intracranial electrode monitoring for seizure localization: indications, methods and the prevention of complications. J Neurosci Nurs. 1996. 28:280–284. 289–292.
Article2. Rosenow F, Lüders H. Presurgical evaluation of epilepsy. Brain. 2001. 124:1683–1700.
Article3. Hamer HM, Morris HH, Mascha EJ, Karafa MT, Bingaman WE, Bej MD, et al. Complications of invasive video-EEG monitoring with subdural grid electrodes. Neurology. 2002. 58:97–103.
Article4. Hufnagel A, Dümpelmann M, Zentner J, Schijns O, Elger CE. Clinical relevance of quantified intracranial interictal spike activity in presurgical evaluation of epilepsy. Epilepsia. 2000. 41:467–478.
Article5. Engel J Jr, Bragin A, Staba R, Mody I. High-frequency oscillations: what is normal and what is not? Epilepsia. 2009. 50:598–604.
Article6. Bragin A, Engel J Jr, Wilson CL, Fried I, Mathern GW. Hippocampal and entorhinal cortex high-frequency oscillations (100--500 Hz) in human epileptic brain and in kainic acid--treated rats with chronic seizures. Epilepsia. 1999. 40:127–137.
Article7. Bragin A, Mody I, Wilson CL, Engel J Jr. Local generation of fast ripples in epileptic brain. J Neurosci. 2002. 22:2012–2021.
Article8. Bragin A, Wilson CL, Engel J Jr. Voltage depth profiles of high-frequency oscillations after kainic acid-induced status epilepticus. Epilepsia. 2007. 48:Suppl 5. 35–40.
Article9. Staba RJ, Wilson CL, Bragin A, Fried I, Engel J Jr. Quantitative analysis of high-frequency oscillations (80-500 Hz) recorded in human epileptic hippocampus and entorhinal cortex. J Neurophysiol. 2002. 88:1743–1752.
Article10. Worrell GA, Parish L, Cranstoun SD, Jonas R, Baltuch G, Litt B. High-frequency oscillations and seizure generation in neocortical epilepsy. Brain. 2004. 127:1496–1506.
Article11. Worrell GA, Gardner AB, Stead SM, Hu S, Goerss S, Cascino GJ, et al. High-frequency oscillations in human temporal lobe: simultaneous microwire and clinical macroelectrode recordings. Brain. 2008. 131:928–937.
Article12. Urrestarazu E, Chander R, Dubeau F, Gotman J. Interictal high-frequency oscillations (100-500 Hz) in the intracerebral EEG of epileptic patients. Brain. 2007. 130:2354–2366.
Article13. Jacobs J, LeVan P, Chander R, Hall J, Dubeau F, Gotman J. Interictal high-frequency oscillations (80-500 Hz) are an indicator of seizure onset areas independent of spikes in the human epileptic brain. Epilepsia. 2008. 49:1893–1907.
Article14. Crépon B, Navarro V, Hasboun D, Clemenceau S, Martinerie J, Baulac M, et al. Mapping interictal oscillations greater than 200 Hz recorded with intracranial macroelectrodes in human epilepsy. Brain. 2010. 133:33–45.
Article15. Lesser RP, Crone NE, Webber WR. Subdural electrodes. Clin Neurophysiol. 2010. 121:1376–1392.
Article16. Axmacher N, Elger CE, Fell J. Ripples in the medial temporal lobe are relevant for human memory consolidation. Brain. 2008. 131:1806–1817.
Article17. Bagshaw AP, Jacobs J, LeVan P, Dubeau F, Gotman J. Effect of sleep stage on interictal high-frequency oscillations recorded from depth macroelectrodes in patients with focal epilepsy. Epilepsia. 2009. 50:617–628.
Article18. Staba RJ, Wilson CL, Bragin A, Jhung D, Fried I, Engel J Jr. High-frequency oscillations recorded in human medial temporal lobe during sleep. Ann Neurol. 2004. 56:108–115.
Article19. Gardner AB, Worrell GA, Marsh E, Dlugos D, Litt B. Human and automated detection of high-frequency oscillations in clinical intracranial EEG recordings. Clin Neurophysiol. 2007. 118:1134–1143.
Article20. Le Van Quyen M, Bragin A. Analysis of dynamic brain oscillations: methodological advances. Trends Neurosci. 2007. 30:365–373.
Article21. Bae EK, Jung KH, Chu K, Lee ST, Kim JH, Park KI, et al. Neuropathologic and clinical features of human medial temporal lobe epilepsy. J Clin Neurol. 2010. 6:73–80.
Article22. Bragin A, Benassi SK, Kheiri F, Engel J Jr. Further evidence that pathologic high-frequency oscillations are bursts of population spikes derived from recordings of identified cells in dentate gyrus. Epilepsia. 2011. 52:45–52.
Article23. Jacobs J, Levan P, Châtillon CE, Olivier A, Dubeau F, Gotman J. High frequency oscillations in intracranial EEGs mark epileptogenicity rather than lesion type. Brain. 2009. 132:1022–1037.
Article24. Jacobs J, Zijlmans M, Zelmann R, Chatillon CE, Hall J, Olivier A, et al. High-frequency electroencephalographic oscillations correlate with outcome of epilepsy surgery. Ann Neurol. 2010. 67:209–220.
Article25. Asano E, Muzik O, Shah A, Juhász C, Chugani DC, Sood S, et al. Quantitative interictal subdural EEG analyses in children with neocortical epilepsy. Epilepsia. 2003. 44:425–434.
Article26. Bautista RE, Cobbs MA, Spencer DD, Spencer SS. Prediction of surgical outcome by interictal epileptiform abnormalities during intracranial EEG monitoring in patients with extrahippocampal seizures. Epilepsia. 1999. 40:880–890.
Article27. Spencer SS, Goncharova II, Duckrow RB, Novotny EJ, Zaveri HP. Interictal spikes on intracranial recording: behavior, physiology, and implications. Epilepsia. 2008. 49:1881–1892.
Article28. Zijlmans M, Jacobs J, Zelmann R, Dubeau F, Gotman J. High-frequency oscillations mirror disease activity in patients with epilepsy. Neurology. 2009. 72:979–986.
Article29. Bragin A, Engel J Jr, Staba RJ. High-frequency oscillations in epileptic brain. Curr Opin Neurol. 2010. 23:151–156.
Article30. Alarcon G, Binnie CD, Elwes RD, Polkey CE. Power spectrum and intracranial EEG patterns at seizure onset in partial epilepsy. Electroencephalogr Clin Neurophysiol. 1995. 94:326–337.
Article31. Allen PJ, Fish DR, Smith SJ. Very high-frequency rhythmic activity during SEEG suppression in frontal lobe epilepsy. Electroencephalogr Clin Neurophysiol. 1992. 82:155–159.
Article32. Fisher RS, Webber WR, Lesser RP, Arroyo S, Uematsu S. High-frequency EEG activity at the start of seizures. J Clin Neurophysiol. 1992. 9:441–448.
Article33. Traub RD, Whittington MA, Buhl EH, LeBeau FE, Bibbig A, Boyd S, et al. A possible role for gap junctions in generation of very fast EEG oscillations preceding the onset of, and perhaps initiating, seizures. Epilepsia. 2001. 42:153–170.
Article34. Khosravani H, Mehrotra N, Rigby M, Hader WJ, Pinnegar CR, Pillay N, et al. Spatial localization and time-dependant changes of electrographic high frequency oscillations in human temporal lobe epilepsy. Epilepsia. 2009. 50:605–616.
Article35. Ochi A, Otsubo H, Donner EJ, Elliott I, Iwata R, Funaki T, et al. Dynamic changes of ictal high-frequency oscillations in neocortical epilepsy: using multiple band frequency analysis. Epilepsia. 2007. 48:286–296.
Article36. Schevon CA, Trevelyan AJ, Schroeder CE, Goodman RR, McKhann G Jr, Emerson RG. Spatial characterization of interictal high frequency oscillations in epileptic neocortex. Brain. 2009. 132:3047–3059.
Article37. Ibarz JM, Foffani G, Cid E, Inostroza M, Menendez de la Prida L. Emergent dynamics of fast ripples in the epileptic hippocampus. J Neurosci. 2010. 30:16249–16261.
Article
- Full Text Links
-
- Actions
-
Cited
- CITED
-
- Close
- Share
-
- Similar articles
-
- Interictal EEG in Diagnosis and Assessment of Epilepsy
- Factors Influencing on Fatigue in Patients with Epilepsy
- Analysis of Interictal Epileptiform Discharges in the Benign Childhood Epilepsy with Centrotemporal Spikes: Prediction of Seizure Outcome
- Significance and Pitfalls of Interictal EEG in Epilepsy Diagnosis
- Psychoses of Epilepsy in Pregnancy: A Case Report
