Quantitative Conductivity Estimation Error due to Statistical Noise in Complex B1+ Map
- Affiliations
-
- 1Department of Electrical and Electronic Engineering, Yonsei University, Seoul, Korea. donghyunkim@yonsei.ac.kr
- 2SIRIC, Yonsei University, Seoul, Korea.
- 3Department of Computer Science & Engineering, Yonsei University, Seoul, Korea.
- KMID: 2206927
- DOI: http://doi.org/10.13104/jksmrm.2014.18.4.303
Abstract
- PURPOSE
In-vivo conductivity reconstruction using transmit field (B1+) information of MRI was proposed. We assessed the accuracy of conductivity reconstruction in the presence of statistical noise in complex B1 + map and provided a parametric model of the conductivity-to-noise ratio value.
MATERIALS AND METHODS
The B1+ distribution was simulated for a cylindrical phantom model. By adding complex Gaussian noise to the simulated B1+ map, quantitative conductivity estimation error was evaluated. The quantitative evaluation process was repeated over several different parameters such as Larmor frequency, object radius and SNR of B1+ map. A parametric model for the conductivity-to-noise ratio was developed according to these various parameters.
RESULTS
According to the simulation results, conductivity estimation is more sensitive to statistical noise in B1+ phase than to noise in B1+ magnitude. The conductivity estimate of the object of interest does not depend on the external object surrounding it. The conductivity-to-noise ratio is proportional to the signal-to-noise ratio of the B1+ map, Larmor frequency, the conductivity value itself and the number of averaged pixels. To estimate accurate conductivity value of the targeted tissue, SNR of B1+ map and adequate filtering size have to be taken into account for conductivity reconstruction process. In addition, the simulation result was verified at 3T conventional MRI scanner.
CONCLUSION
Through all these relationships, quantitative conductivity estimation error due to statistical noise in B1+ map is modeled. By using this model, further issues regarding filtering and reconstruction algorithms can be investigated for MREPT.
Keyword
Figure
-
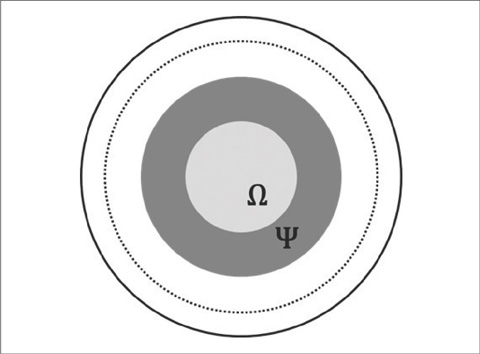
Fig. 1 Cross-section of infinitely long cylinder simulation model. MRI scanner was implemented RF shield (black line) and 32 rod quadrature coil (black dashed line). Simulation phantom (light gray region Ω) and surrounding tissue (dark gray region Ψ) was located at iso-center of MRI canner.
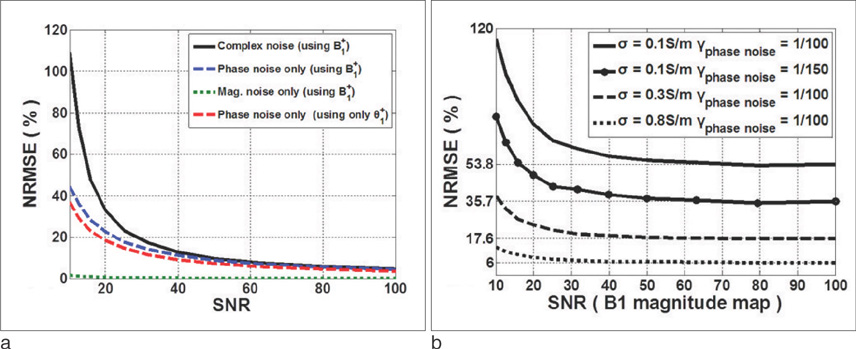
Fig. 2 Quantitative conductivity estimation error (NRMSE) graph. a. SNR variation due to three types statistical noise using complex B1+ information (Eq. 1) and phase noise using only B1+ phase information (Eq. 2). b. SNR variation due to B1+ magnitude noise with fixed level of phase noise and conductivity variation 0.1 to 0.8.

Fig. 3 Error in the conductivity estimation for seven types of tissues at the radius of 5 mm and B0 intensity 1.5T (a), 3T (b) and 7T (c). Fat (dark gray line) is observed only 7T B0 intensity within the given SNR range, 102 ~ 104.

Fig. 4 Quantitative conductivity estimation error due to (a) electric conductivity of outer surrounding tissue and (b) radius of homogeneous region. (c) NRMSE fitting result according to the number of averaged pixels that is almost proportional to square radius with 0.9992 R2 (determinant coefficient) value.
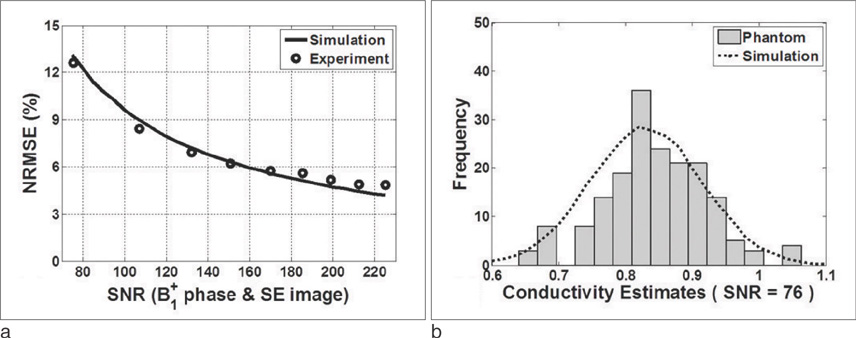
Fig. 5 a. Comparison of the error between simulation result (black bold line) and phantom experimental result (black dash line). b. Histogram of estimated conductivity value in experiment result (SNR of SE image = 80).
Reference
-
1. Haacke EM, Petropoulos LS, Nilges EW, Wu DH. Extraction of conductivity and permittivity using magnetic resonance imaging. Phys Med Biol. 1991; 36:723–734.2. Katscher U, Voigt T, Findeklee C, Vernickel P, Nehrke K, Dossel O. Determination of electric conductivity and local SAR via B1 mapping. IEEE Trans Med Imaging. 2009; 28:1365–1374.3. Joines WT, Zhang Y, Li C, Jirtle RL. The measured electrical properties of normal and malignant human tissues from 50 to 900 MHz. Med Phys. 1994; 21:547–550.4. Schaefer M, Gross W, Ackemann J, Gebhard MM. The complex dielectric spectrum of heart tissue during ischemia. Bioelectrochemistry. 2002; 58:171–180.5. Haemmerich D, Staelin ST, Tsai JZ, Tungjitkusolmun S, Mahvi DM, Webster JG. In vivo electrical conductivity of hepatic tumours. Physiol Meas. 2003; 24:251–260.6. Fallert MA, Mirotznik MS, Downing SW, et al. Myocardial electrical-impedance mapping of iscemic sheep hearts and healing aneurysm. Circulation. 1993; 87:199–207.7. Voigt T, Homann H, Katscher U, Doessel O. Patient-individual local SAR determination: in vivo measurements and numerical validation. Magn Reson Med. 2012; 68:1117–1126.8. Yarnykh VL. Actual flip-angle imaging in the pulsed steady state: a method for rapid three-dimensional mapping of the transmitted radiofrequency field. Magn Reson Med. 2007; 57:192–200.9. Voigt T, Nehrke K, Doessel O, Katscher U. T1 corrected B1 mapping using multi-TR gradient echo sequences. Magn Reson Med. 2010; 64:725–733.10. Stollberger R, Wach P. Imaging of the active B1 field in vivo. Magn Reson Med. 1996; 35:246–251.11. Sacolick LI, Wiesinger F, Hancu I, Vogel MW. B1 mapping by Bloch-Siegert shift. Magn Reson Med. 2010; 63:1315–1322.12. Kim DH, Gho SM, Choi N, Liu C. Simultaneous Electromagnetic Property Imaging using multiecho gradient echo. In : Proceedings of the 20th Annual Meeting of ISMRM; Melbourne, Australia. 2012. p. 3464.13. Voigt T, Katscher U, Doessel O. Quantitative conductivity and permittivity imaging of the human brain using electric properties tomography. Magn Reson Med. 2011; 66:456–466.14. Bulumulla SB, Lee S, Yeo DTB. Conductivity and permittivity imaging at 3.0 T. Concepts Magn Reson Part B Magn Reson Eng. 2012; 41B(1):13–21.15. van Lier AL, Brunner DO, Pruessmann KP, et al. B1(+) phase mapping at 7 T and its application for in vivo electrical conductivity mapping. Magn Reson Med. 2012; 67:552–561.16. Seo JK, Kim MO, Lee J, et al. Error analysis of nonconstant admittivity for MR-based electric property imaging. IEEE Trans Med Imaging. 2012; 31:430–437.17. van Lier AL, Voigt T, Katscher U, van den Berg CA. Comparing Electric Properties Tomography at 1.5, 3 and 7 T. In : Proceedings of the 19th Annual Meeting of ISMRM; Montreal, Canada. 2011. p. 125.18. van den Bergen B, Stolk CC, Berg JB, Lagendijk JJ, Van den Berg CA. Ultra fast electromagnetic field computations for RF multi-transmit techniques in high field MRI. Phys Med Biol. 2009; 54:1253–1264.19. Gudbjartsson H, Patz S. The Rician distribution of noisy MRI data. Magn Reson Med. 1995; 34:910–914.20. Morrell GR, Schabel MC. An analysis of the accuracy of magnetic resonance flip angle measurement methods. Phys Med Biol. 2010; 55:6157–6174.22. Stogryn A. Equations for calculating the dielectric constant of saline water. IEEE Trans Microw Theory Tech. 1971; 19:733–736.23. Gabriel S, Lau RW, Gabriel C. The dielectric properties of biological tissues: II. Measurements in the frequency range 10 Hz to 20 GHz. Phys Med Biol. 1996; 41:2251–2269.24. Zypman FR. MRI electromagnetic field penetration in cylindrical objects. Comput Biol Med. 1996; 26:161–175.
- Full Text Links
-
- Actions
-
Cited
- CITED
-
- Close
- Share
-
- Similar articles
-
- Non-Invasive in vivo Loss Tangent Imaging: Thermal Sensitivity Estimation at the Larmor Frequency
- The Ocular Electrical Conductivity by Vitreous Substitutes in rabbits
- Principle, Development, and Application of Electrical Conductivity Mapping Using Magnetic Resonance Imaging
- Identification of the associations between genes and quantitative traits using entropy-based kernel density estimation
- Simultaneous Unwrapping Phase and Error Recovery from Inhomogeneity (SUPER) for Quantitative Susceptibility Mapping of the Human Brain
