Clinical Applications of Neuroimaging with Susceptibility Weighted Imaging: Review Article
- Affiliations
-
- 1Department of Radiology, Seoul Veterans Hospital, Seoul, Korea. knroo@hanmail.net
- KMID: 2206926
- DOI: http://doi.org/10.13104/jksmrm.2014.18.4.290
Abstract
- PURPOSE
Susceptibility-weighted magnetic resonance (MR) sequence is three-dimensional (3D), spoiled gradient-echo pulse sequences that provide a high sensitivity for the detection of blood degradation products, calcifications, and iron deposits. This pictorial review is aimed at illustrating and discussing its main clinical applications.
MATERIALS AND METHODS
SWI is based on high-resolution, 3D, fully velocity-compensated gradient-echo sequences using both magnitude and phase images. To enhance the visibility of the venous structures, the magnitude images are multiplied with a phase mask generated from the filtered phase data, which are displayed at best after post-processing of the 3D dataset with the minimal intensity projection algorithm. A total of 200 patients underwent MR examinations that included SWI on a 3 tesla MR imager were enrolled.
RESULTS
SWI is very useful in detecting multiple brain disorders. Among the 200 patients, 80 showed developmental venous anomaly, 22 showed cavernous malformation, 12 showed calcifications in various conditions, 21 showed cerebrovascular accident with susceptibility vessel sign or microbleeds, 52 showed brain tumors, 2 showed diffuse axonal injury, 3 showed arteriovenous malformation, 5 showed dural arteriovenous fistula, 1 showed moyamoya disease, and 2 showed Parkinson's disease.
CONCLUSION
SWI is useful in detecting occult low flow vascular lesions, calcification and microbleed and characterising diverse brain disorders.
MeSH Terms
Figure
-

Fig. 1 Phase (a), magnitude (b), combined SWI (c), and minIP SWI (d) showing the normal SWI intracranial appearances in a 61-year-old male. The cerebral parenchyma has intermediate signal intensity with white matter slightly hyperintense to gray matter. The lentiform nucleus (double arrow) and globus pallidi (arrow) (d) are low signal intensity due to mineral deposition.
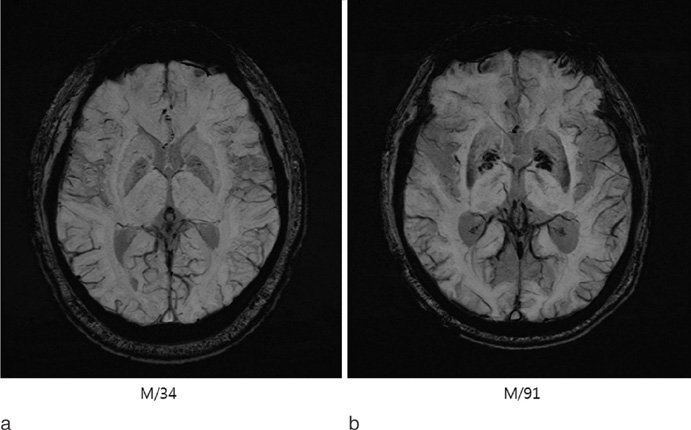
Fig. 2 minIP SWI showing the normal SWI intracranial appearances in 34-year-old (a) and 91-year-old males (b). The lentiform nucleus and globus pallidi are low signal intensity due to mineral deposition. This becomes more pronounced in a 91-year-old man compared with a 34-year-old man.
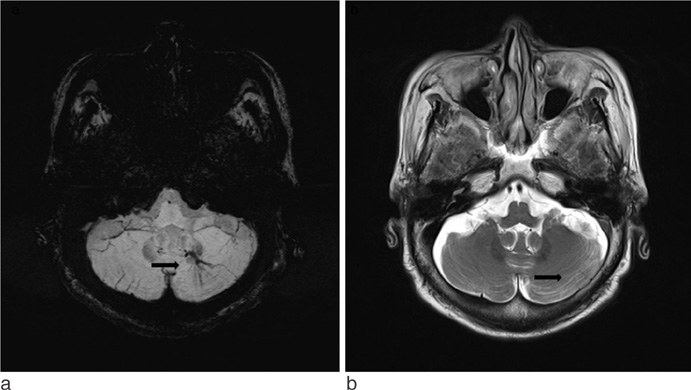
Fig. 3 DVA in a 67-year-old female patient. mIP SWI demonstrating the typical curvilinear vascular channels receiving drainage from a spoke wheel-appearing collection of small, tapering veins (arrow) (a). Axial T2-weighted image shows a faint vascular lesions (arrow) (b).
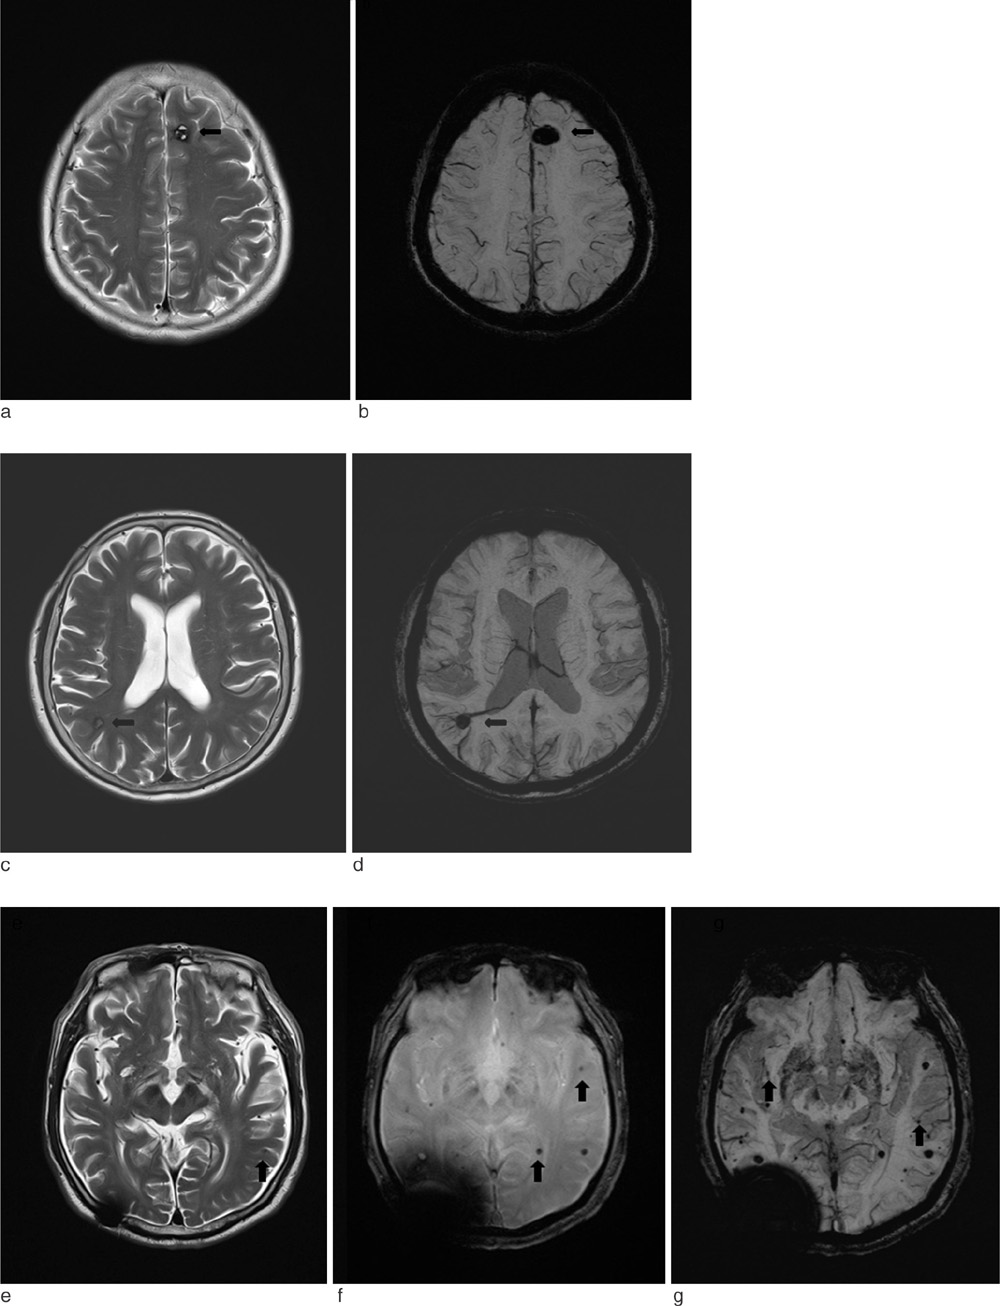
Fig. 4 Cavernous malformation in a 57-year-old female patient. Axial T2-weighted image shows focal central heterogeneous areas (arrow) corresponding to subacute-chronic hemorrhage, circumferential rings of markedly hypointense iron-storage forms around these high-intensity central areas, no mass effect or edema, and no demonstrable feeding arteries or draining veins associated with DVA (a). SWI has exquisite sensitivity for hemosiderin and calcification in theses lesions (arrow) (b). Cavernous malformation with DVA in a 58-year-old male patient. Axial T2-weighted image shows focal central heterogeneity containing areas (arrow) corresponding to subacute-chronic hemorrhage, circumferential complete rings of markedly hypointense iron-storage forms around these high-intensity central areas, no mass effect or edema (c). SWI shows draining veins associated with DVA (arrow) (d). Multiple cavernous malformations in a 80-year-old male patient. Axial T2-weighted image shows a tiny left temporal cavernous malformation (arrow) (e). GRE image shows multiple punctate low signal foci located in the both hemispheres that are not detected by T2-weighted image (arrows) (f). SWI shows supplemental cavernous malformations that are not detected by GRE (arrows) (g).

Fig. 5 AVM in a 81-year-old male patient. Axial T2-weighted image demonstrates marked hypointensity (arrows) along the surface of the brain parenchyma or along the ependymal surface of the ventricle (a). SWI can demonstrate the tangle of arterial feeding vessels and the enlarged draining veins (arrow) (b).

Fig. 6 Heavy falcine calcification in a 73-year-old male patient. Linear calcified mass (arrow) is identified in the falx by CT (a). The SWI filtered phase image with inverse contrast (b) shows the lesion (arrow) have opposite signal intensity to the veins along the sulci confirming that the dark area on the magnitude image (arrow) (c) is calcification. The location and size of the lesion shown on the SWI magnitude image matches the CT data.
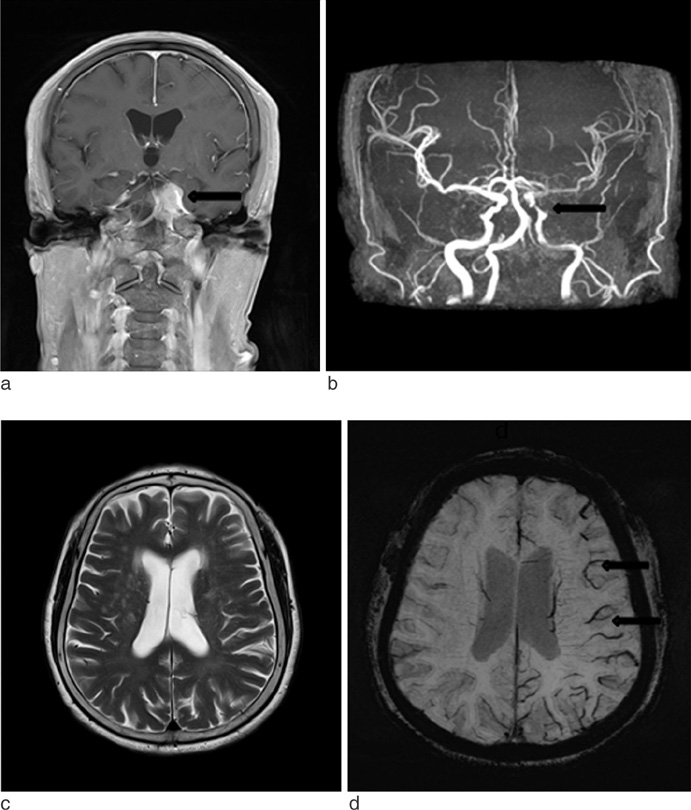
Fig. 7 Stroke with meningioma in a 67-year-old female patient. A 3.0 cm size enhancing extraaxial tumor (arrow) is seen in the left cavernous sinus area on contrast enhanced coronal T1-weighted image (a). Left distal internal carotid artery (ICA) narrowing and decreased blood flow of the left MCA are identified by brain TOF MR angiography (arrow) (b). T2-weighted image (c) shows no significant abnormal finding in the left MCA territory. Prominent veins in the left MCA territory, suggesting increased OEF, is seen on the minIP SWI (arrows) (d).
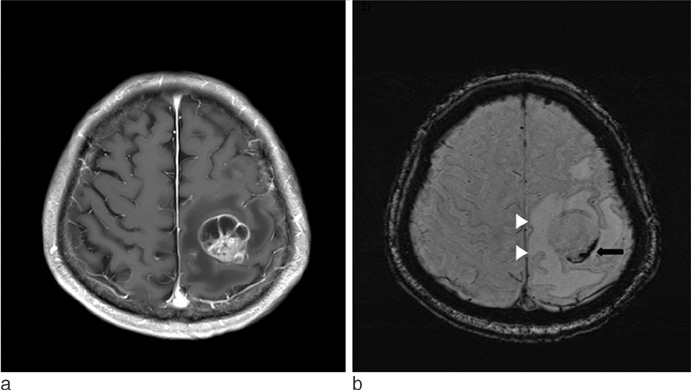
Fig. 8 Lung adenocarcinoma brain metastasis in a 87-year-old male patient. A lobulated margin heterogenously enhancing metastasis in the left frontal lobe is seen on axial T1-weighted image (a). minIP SWI shows low signal hemorrhages within the tumor (arrow), and the edema has "T2 or FLAIR-like contrast" (b).

Fig. 9 Renal cell carcinoma brain metastasis in a 65-year-old male patient. A tiny low signal intensity metastasis is seen on axial T2-weighted image in the left cerebellar hemisphere (a). Postcontrast T1-weighted image shows tiny rim enhancing metastasis in the left cerebellar hemisphere (b). mIP SWI shows prominent susceptibility lesion in the left cerebellar hemisphere (c) (arrows).
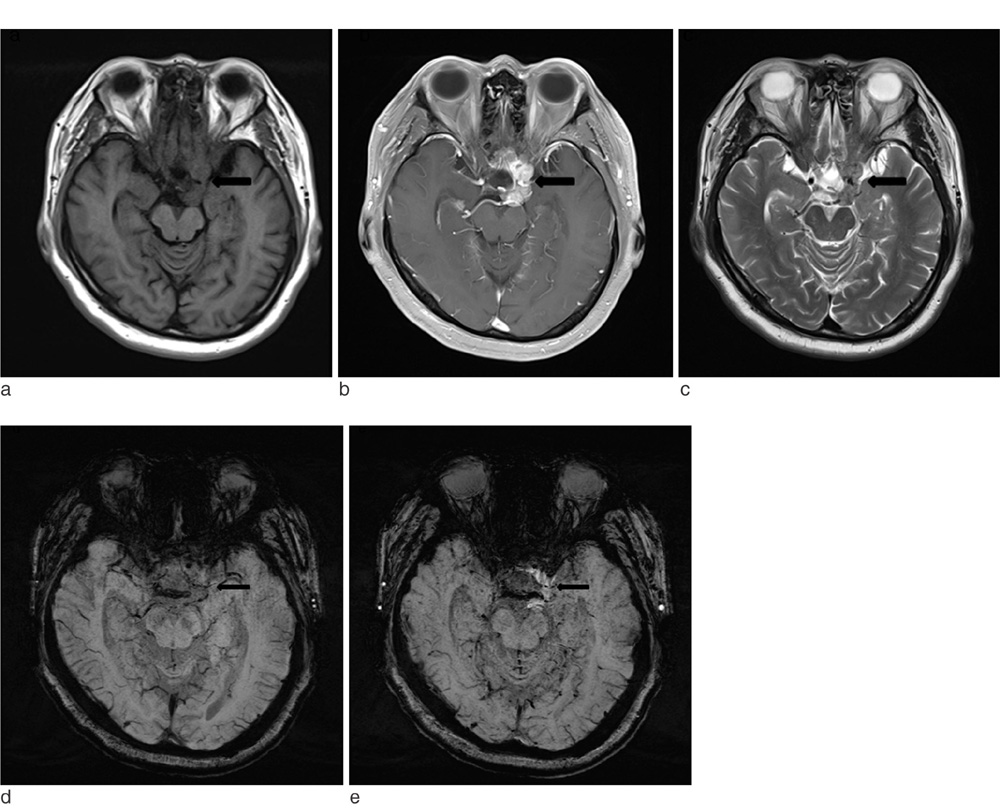
Fig. 10 Meningioma in a 65-year-old female patient. A lobulated margin enhancing extraaxial tumor (arrow) is seen in the left cavernous sinus area on axial T1-weighted image (a), contrast enhanced axial T1-weighted image (b), T2-weighted image (c). Compared with axial SWI (d), a lobulated margin enhancing extraaxial tumor is seen in the left cavernous sinus area on contrast enhanced axial SWI (e). Internal vascular structure of a tumor that is not visible on T1-weighted image is well noted (arrows).
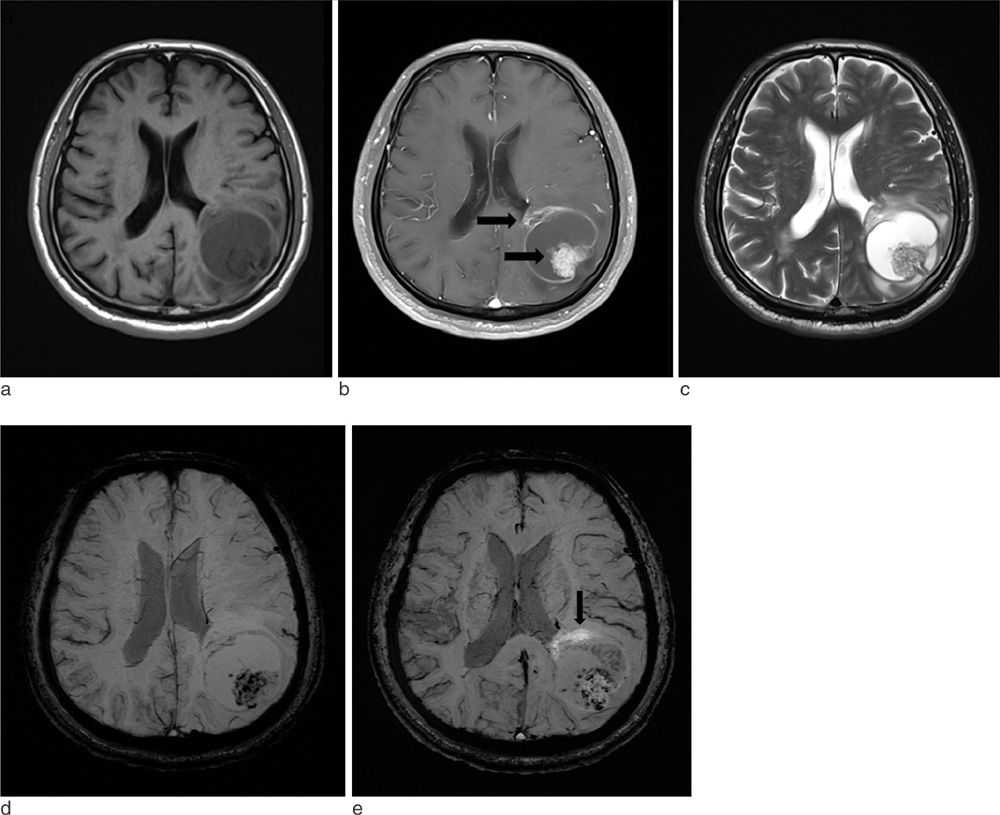
Fig. 11 Lung adenocarcinoma brain metastasis in a 64-year-old male patient. A 4.3 cm diameter low signal metastasis is seen in the left parietal area on axial precontrast T1-weighted image (a). On postcontrast T1-weighted image, the lesion shows a strong enhancement in its margins and solid component (arrows) (b). The areas that do not enhance on postcontrast T1-weighted image, which likely correspond to necrosis, appear bright on T2-weighted image (c). On SWI precontrast, the margins of the lesion are clearly visible due to a thin hypointense rim (which supposedly represents capsule ) and well-visualized edema. Aggregated low signal foci are visible, which were interpreted to be hemorrhage (d). On postcontrast SWI, focal enhancement areas are seen, that suggests a breakdown of the blood brain barrier in the surrounding white matter (arrow). The conspicuity of the lesion is thus markedly increased (e).

Fig. 12 Moyamoya disease in a 65-year-old male patient. Brain TOF MR angiography shows high grade stenosis of the both proximal MCAs (a). On FLAIR image, there is no signs of chronic or acute ischemia (b). minIP SWI shows increased conspicuity of deep medullary veins, known as "brush sign" (arrows) (c). On contrast enhanced PWI, there is increased mean transit time (MTT), time to peak (TTP) in the both MCA territories (d, e). On 3D-pulsed ASL PWI, compared with 30-year-old female normal control (f, hypoperfusion areas are noted in the both MCA territories (arrows) (g).
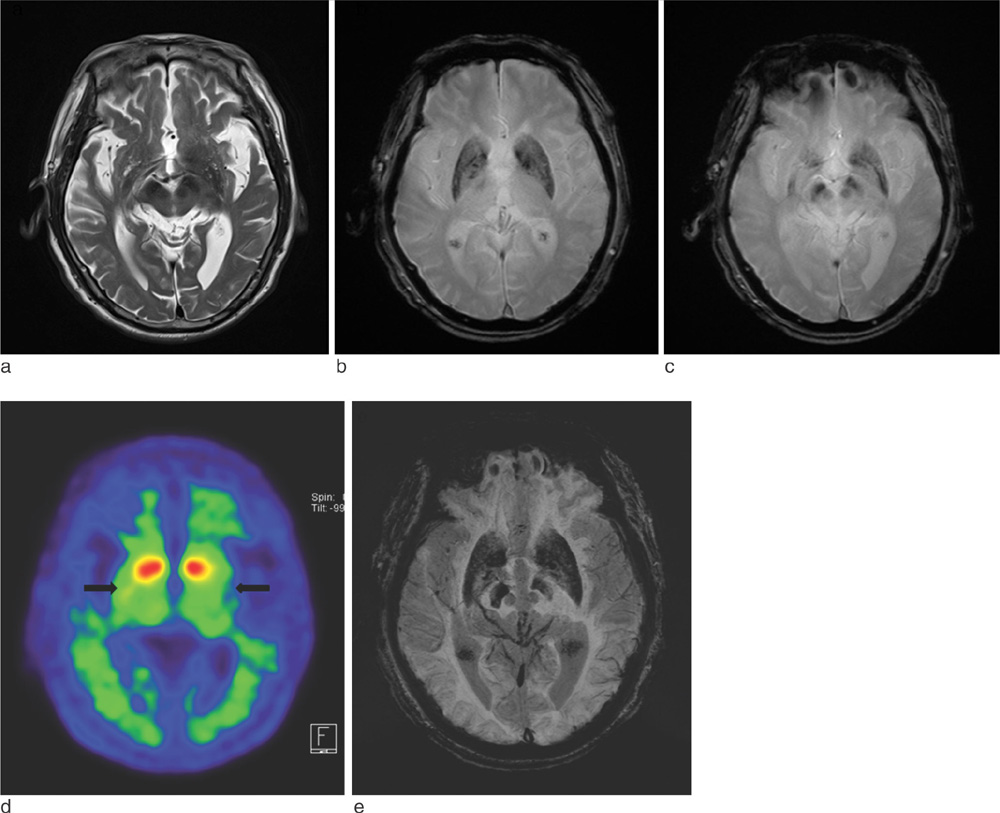
Fig. 13 Parkinson's disease in a 85-year-old male patient. T2-weighted axial image shows no definite abnormal finding (a). GRE axial images (b, c) show prominent iron deposition of the bilateral globus pallidi, caudate nuclei, putamen, substantia nigra and red nuclei. Parkinson's disease in a 85-year-old male patient. Decreased density of dopamine transporters (DAT) in the bilateral mid-to-posterior putamen (arrows) using 123I-n-fluoropropyl-2b carbomethoxy-3b-(4-iodophenyl) nortropane (FP-CIT), which is a high-affinity cocaine analog that binds specifically to DATs on PET (d). minIP SWI axial image (e) shows more prominent iron deposition of the bilateral globus pallidi, caudate nuclei, putamen, substantia nigra and red nuclei than GRE images.

Fig. 14 Traumatic brain injury in a 57-year-old female patient. No abnormality is seen in the right temporal area on FLAIR (arrow) (a). GRE (arrow) (b) and minIP SWI (arrow) (c) show focal cortical hemorrhage.
Reference
-
1. Reichenbach JR, Venkatesan R, Schillinger DJ, Kido DK, Haacke EM. Small vessels in the human brain: MR venography with deoxyhemoglobin as an intrinsic contrast agent. Radiology. 1997; 204:272–277.2. Haacke EM, Mittal S, Wu Z, Neelavalli J, Cheng YC. Susceptibility-weighted imaging: technical aspects and clinical applications, part 1. AJNR Am J Neuroradiol. 2009; 30:19–30.3. Wang D, Li WB, Wei XE, Li YH, Dai YM. An investigation of age-related iron deposition using susceptibility weighted imaging. PLoS One. 2012; 7:e50706. doi: 10.1371/journal.pone.0050706 Epub 2012 30.4. Sehgal V, Delproposto Z, Haacke EM, et al. Clinical applications of neuroimaging with susceptibility weighted imaging. J Magn Reson Imaging. 2005; 22:439–450.5. Sarwar M, McCormick W. Intracerebral venous angioma: case report and review. Arch Neurol. 1978; 35:323–325.6. Kaplan HA, Aronson SM, Browder EJ. Vascular malformations of the brain. An anatomical study. J Neurosurg. 1961; 18:630–635.7. Wu Z, Mittal S, Kish K, Yu Y, Hu J, Haacke EM. Identification of calcification with magnetic resonance imaging using susceptibility-weighted imaging: a case study. J Magn Reson Imaging. 2009; 29:177–182.8. Santhosh K, Kesavadas C, Thomas B, Gupta AK, Thamburaj K, Kapilamoorthy TR. Susceptibility weighted imaging: a new tool in magnetic resonance imaging of stroke. Clin Radiol. 2009; 64:74–83.9. Radbruch A, Graf M, Kramp L, et al. Differentiation of brain metastases by percentagewise quantification of intratumoral-susceptibility-signals at 3Tesla. Eur J Radiol. 2012; 81:4064–4068. doi: 10.1016/j.ejrad.2012.06.016 Epub 2012 12.10. Sehgal V, Delproposto Z, Haddar D, et al. Susceptibility-weighted imaging to visualize blood products and improve tumor contrast in the study of brain masses. J Magn Reson Imaging. 2006; 24:41–51.11. Horie N, Morikawa M, Nozaki A, Hayashi K, Suyama K, Nagata I. "Brush Sign" on susceptibility-weighted MR imaging indicates the severity of moyamoya disease. AJNR Am J Neuroradiol. 2011; 32:1697–1702. doi: 10.3174/ajnr.A2568 Epub 2011 28.12. Thomas B, Somasundaram S, Thamburaj K, et al. Clinical applications of susceptibility weighted MR imaging of the brain -a pictorial review. Neuroradiology. 2008; 50:105–116.13. Bartzokis G, Cummings JL, Markham CH, et al. MRI evaluation of brain iron in earlier- and later-onset Parkinson's disease and normal subjects. Magn Reson Imaging. 1999; 17:213–222.14. Tong KA, Ashwal S, Holshouser BA, et al. Hemorrhagic shearing lesions in children and adolescents with posttraumatic diffuse axonal injury:improved detection and initial results. Radiology. 2003; 227:332–339.
- Full Text Links
-
- Actions
-
Cited
- CITED
-
- Close
- Share
-
- Similar articles
-
- Modern Brain Tumor Imaging
- Structural MR Imaging in the Diagnosis of Alzheimer's Disease and Other Neurodegenerative Dementia: Current Imaging Approach and Future Perspectives
- Artificial Intelligence in Neuroimaging: Clinical Applications
- Hypointense Rim on Susceptibility-Weighted Imaging in a Patient with Progressive Multifocal Leukoencephalopathy
- Neuroimaging of Vascular Dementia
