Investig Magn Reson Imaging.
2015 Sep;19(3):200-204. 10.13104/imri.2015.19.3.200.
Hepatic Lymphoma Representing Iso-Signal Intensity on Hepatobiliary Phase, in Gd-EOB-DTPA-Enhanced MRI: Case Report
- Affiliations
-
- 1Department of Radiology, Seoul Medical Center, Seoul, Korea. radiokye@naver.com
- 2Department of Pathology, Seoul Medical Center, Seoul, Korea.
- KMID: 2175617
- DOI: http://doi.org/10.13104/imri.2015.19.3.200
Abstract
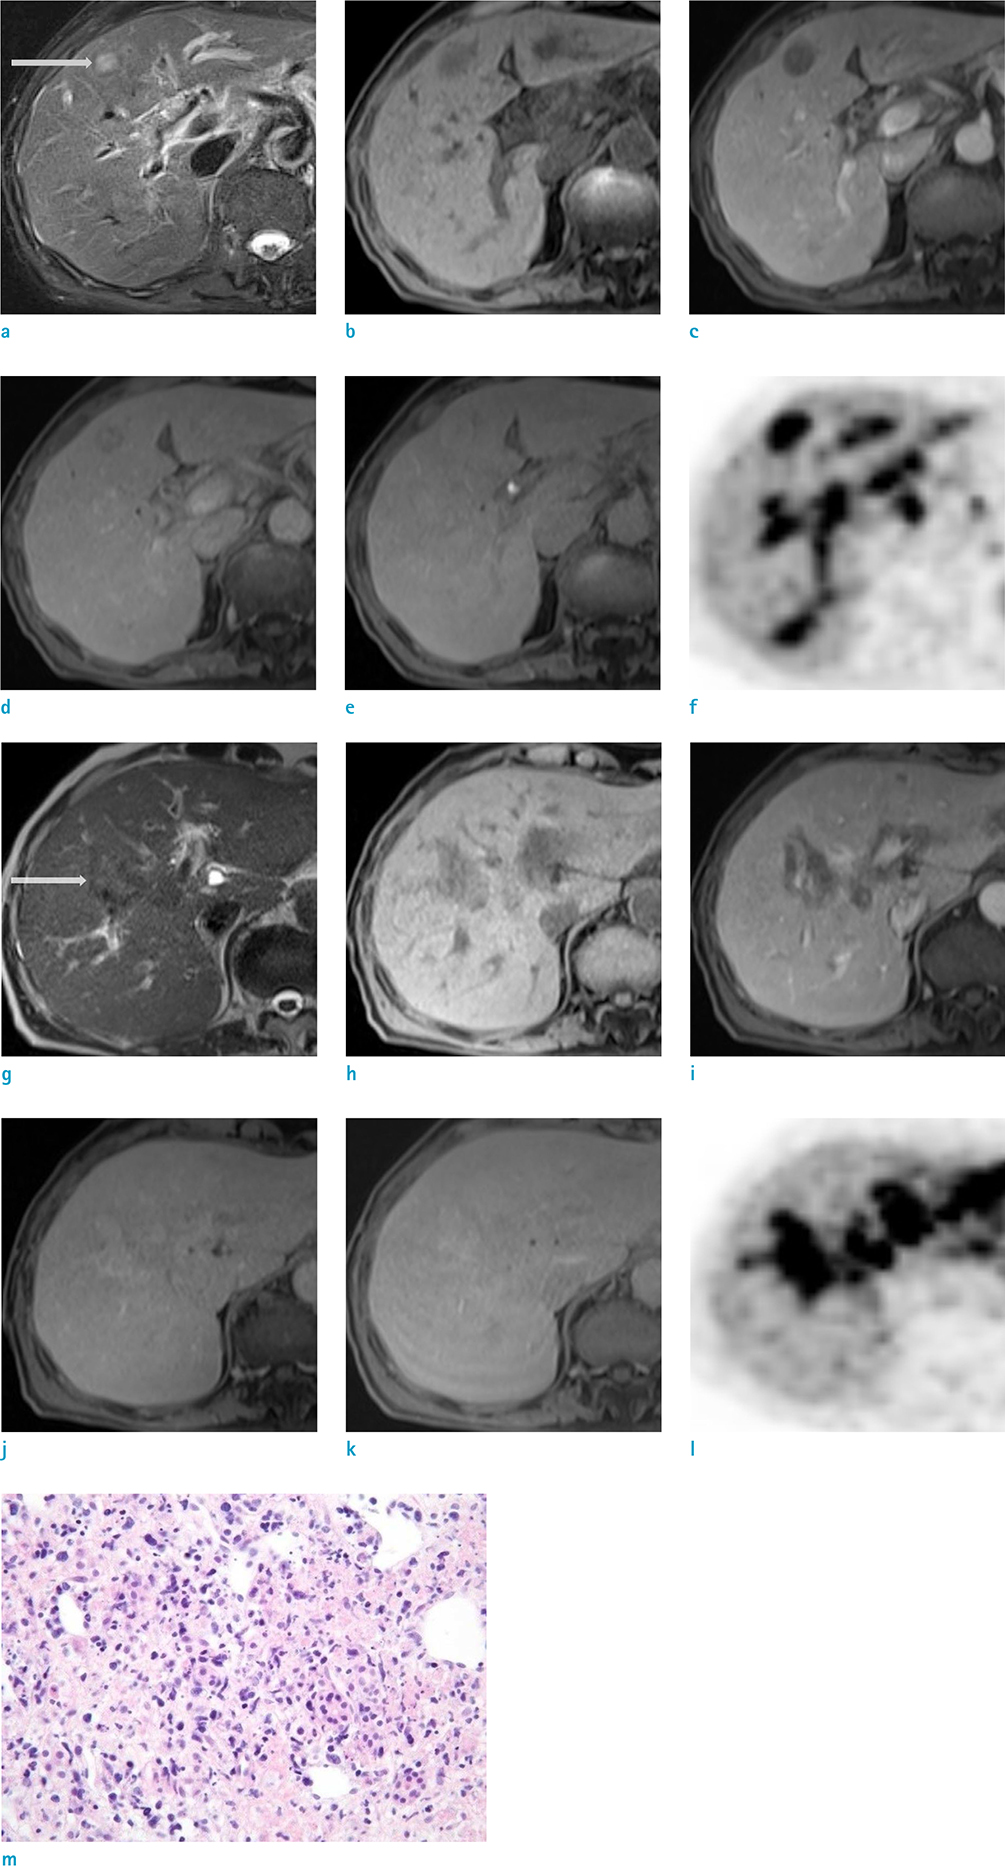
- Image findings of hepatic lymphoma have been reported as variable, ranging from single or multiple small nodules to diffuse infiltrative patterns. On MRI, most hepatic lymphomas show T1 low signal intensity, T2 high signal intensity. Dynamic imaging reveals a hypointense appearance in the arterial phase, followed by delayed enhancement in the portal venous and transitional phase. In the hepatobiliary phase using a hepatocyte-specific contrast agent (which have recently aided in increasing the access to the focal liver lesions), hepatic lymphoma is known to exhibit low signal intensity. We report a case of hepatic lymphoma, which shows iso-signal intensity on hepatobiliary phase, using gadoxetic acid (Gd-EOB-DTPA).
MeSH Terms
Figure
Reference
-
1. Leite NP, Kased N, Hanna RF, et al. Cross-sectional imaging of extranodal involvement in abdominopelvic lymphoproliferative malignancies. Radiographics. 2007; 27:1613–1634.2. Gazelle GS, Lee MJ, Hahn PF, Goldberg MA, Rafaat N, Mueller PR. US, CT, and MRI of primary and secondary liver lymphoma. J Comput Assist Tomogr. 1994; 18:412–415.3. Campos JT, Sirlin CB, Choi JY. Focal hepatic lesions in Gd-EOB-DTPA enhanced MRI: the atlas. Insights Imaging. 2012; 3:451–474.4. Grazioli L, Olivetti L, Mazza G, Bondioni MP. MR Imaging of Hepatocellular Adenomas and Differential Diagnosis Dilemma. Int J Hepatol. 2013; 2013:374170.5. Tomasian A, Sandrasegaran K, Elsayes KM, Shanbhogue A, Shaaban A, Menias CO. Hematologic malignancies of the liver: spectrum of disease. Radiographics. 2015; 35:71–86.6. Lee SA, Lee CH, Jung WY, et al. Paradoxical high signal intensity of hepatocellular carcinoma in the hepatobiliary phase of Gd-EOB-DTPA enhanced MRI: initial experience. Magn Reson Imaging. 2011; 29:83–90.7. Ha S, Lee CH, Kim BH, et al. Paradoxical uptake of Gd-EOB-DTPA on the hepatobiliary phase in the evaluation of hepatic metastasis from breast cancer: is the "target sign" a common finding? Magn Reson Imaging. 2012; 30:1083–1090.8. Lee HJ, Im JG, Goo JM, et al. Peripheral T-cell lymphoma: spectrum of imaging findings with clinical and pathologic features. Radiographics. 2003; 23:7–26. discussion 26-289. Tababi S, Kharrat S, Sellami M, et al. Extranodal NK/T-cell lymphoma, nasal type: report of 15 cases. Eur Ann Otorhinolaryngol Head Neck Dis. 2012; 129:141–147.10. Haimerl M, Verloh N, Fellner C, et al. MRI-based estimation of liver function: Gd-EOB-DTPA-enhanced T1 relaxometry of 3T vs. the MELD score. Sci Rep. 2014; 4:5621.
- Full Text Links
- Actions
-
Cited
- CITED
-
- Close
- Share
- Similar articles
-
- Image Findings of Sarcomatous Intrahepatic Cholangiocarcinoma Focused on Gd-EOB-DTPA Enhanced MRI: A Case Report
- Supradiaphragmatic Liver Confirmed by a Hepatocyte-specific Contrast Agent (Gd-EOB-DTPA): A Case Report
- A feasibility study evaluating the relationship between dose and focal liver reaction in stereotactic ablative radiotherapy for liver cancer based on intensity change of Gd-EOB-DTPA-enhanced magnetic resonance images
- Quantitative Evaluation of the Hepatic Parenchymal Change in Patients with Chronic Liver Disease Using Gd-EOB-DTPA-enhanced MRI: Comparison with Normal Liver
- A Case Report of Localized Hepatic Sinusoidal Dilatation: The Diagnostic Usefulness of the Hepatobiliary Phase of Gd-EOB-DTPA-Enhanced Magnetic Resonance Imaging


