Quantitative Evaluation of the Hepatic Parenchymal Change in Patients with Chronic Liver Disease Using Gd-EOB-DTPA-enhanced MRI: Comparison with Normal Liver
- Affiliations
-
- 1Department of Diagnostic Radiology, Korea University Ansan Hospital, Korea. sahcha@kumc.or.kr
- KMID: 1443582
- DOI: http://doi.org/10.3348/jksr.2011.64.1.49
Abstract
- PURPOSE
We wanted to evaluate the capability of Gd-EOB-DTPA-enhanced MRI for diagnosing chronic liver disease by comparing the signal intensity change (SIC) of the hepatic parenchyma of patients with chronic liver disease with that of patients with a normal liver.
MATERIALS AND METHODS
This retrospective study included 50 patients who were pathologically confirmed as having liver cirrhosis (n=41) or chronic hepatitis (n=9) by surgery (n=9) or biopsy (n=41), and they all underwent Gd-EOB-DTPA-enhanced MRI between June 2008 and May 2010 (i.e., the patient group). We also analyzed 30 patients with normal livers as the control group. Quantitative image analysis was performed by measuring the signal-to-noise ratios for the pre-contrast images and the post-contrast 2-, 3-, 10-, 20-min delay images and then calculating the SIC of the pre-contrast and post-contrast images. We performed a detailed analysis of the collected data, which was transformed into a logarithmic form. The SICs of the two groups were compared by Greenhouse-Geisser sphericity correction.
RESULTS
Comparison of the SIC between the two groups showed a significant difference on the hepatocyte-phase 20-min image (p<0.0001). The mean SICs with log transformation for the patient and normal groups were 1.90 +/- 0.10 and 2.23 +/- 0.13, respectively, and the optimal cut-off value of the SIC with log transformation on the 20-min delay hepatocyte-phase image was 2.17 (sensitivity: 66.7%, specificity: 84.0%, positive predictive value: 71.4%, negative predictive value: 80.8%).
CONCLUSION
Quantitative measurement of the SIC on the hepatocyte-phase image by Gd-EOB-DTPA-enhanced MRI could provide a convenient method to noninvasively diagnose chronic liver disease.
MeSH Terms
Figure
-
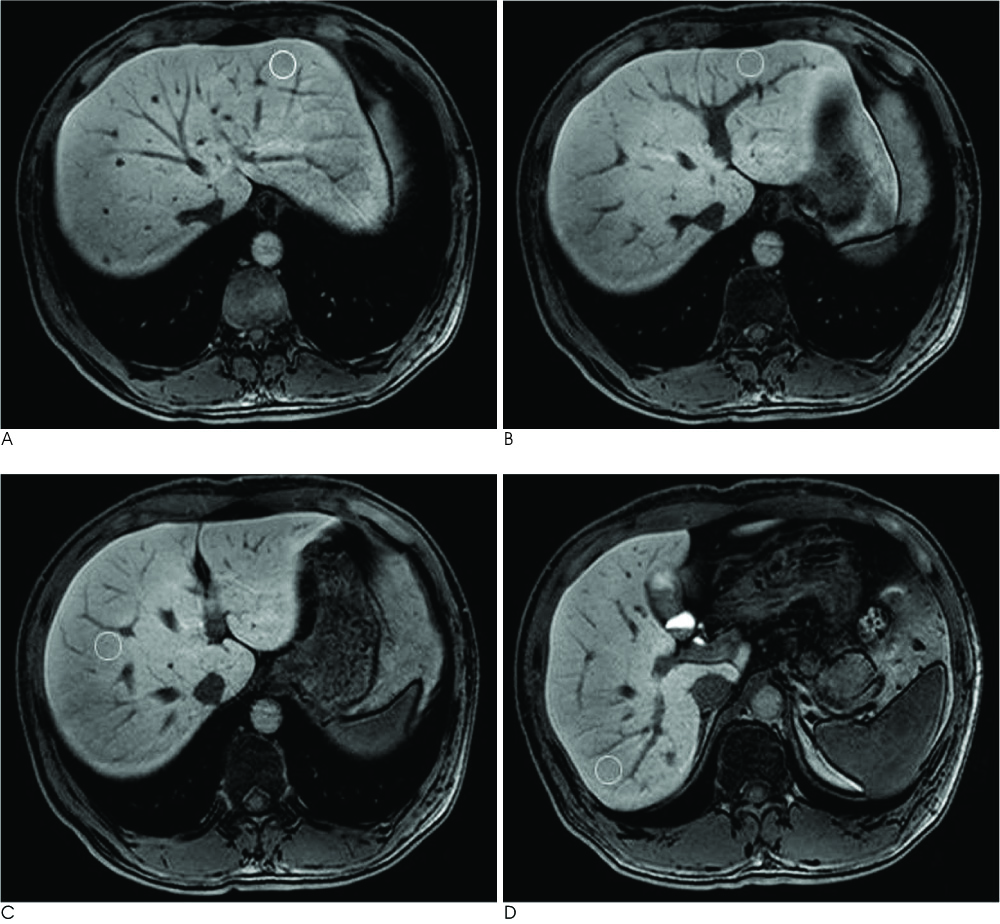
Fig. 1 A-D. The method for measuring the regions of interest at four points of the hepatic parenchyma in the right and left lobes of the liver.
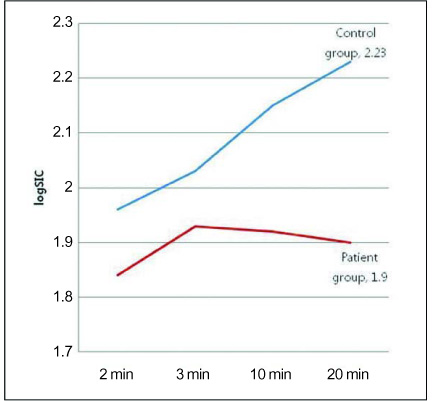
Fig. 2 The temporal profiles of the signal intensity change after log transformation illustrate the relationship between the patient group with chronic liver disease and the control group at each phase.
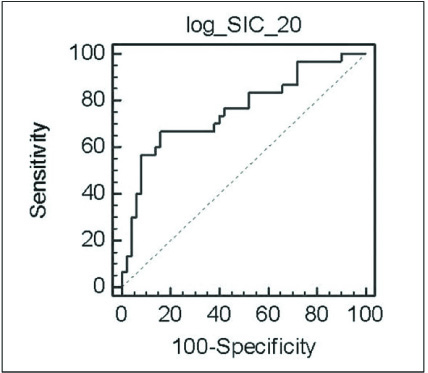
Fig. 3 The receiver operating characteristic curves of the signal intensity change after log transformation between the precontrast images and the 20-min delay hepatocyte-phase images. Since the area under the receiver operating characteristic curve and the calculated p-value were 0.759 and 0.0001, respectively, this can be interpreted as there was a significant difference between the patient group with chronic liver disease and the control group.
Reference
-
1. Hagiwara M, Rusinek H, Lee VS, Losada M, Bannan MA, Krinsky GA, et al. Advanced liver fibrosis: diagnosis with 3D whole-liver perfusion MR imaging-initial experience. Radiology. 2008; 246:926–934.2. Afdhal NH, Nunes D. Evaluation of liver fibrosis: a concise review. Am J Gastroenterol. 2004; 99:1160–1174.3. Ito K, Mitchell DG. Hepatic morphologic changes in cirrhosis: MR imaging findings. Abdom Imaging. 2000; 25:456–461.4. Ito K, Mitchell DG. Imaging diagnosis of cirrhosis and chronic hepatitis. Intervirology. 2004; 47:134–143.5. Motosugi U, Ichikawa T, Sou H, Sano K, Tominaga L, Kitamura T, et al. Liver parenchymal enhancement of hepatocyte-phase images in Gd-EOB-DTPA-enhanced MR imaging: which biological markers of the liver function affect the enhancement? J Magn Reson Imaging. 2009; 30:1042–1046.6. Bluemke DA, Sahani D, Amendola M, Balzer T, Breuer J, Brown JJ, et al. Efficacy and safety of MR imaging with liver-specific contrast agent: U.S. multicenter phase III study. Radiology. 2005; 237:89–98.7. Ryeom HK, Kim SH, Kim JY, Kim HJ, Lee JM, Chang YM, et al. Quantitative evaluation of liver function with MRI using Gd-EOB-DTPA. Korean J Radiol. 2004; 5:231–239.8. Yamashita Y, Yamamoto H, Hirai A, Yoshimatsu S, Baba Y, Takahashi M. MR imaging enhancement with superparamagnetic iron oxide in chronic liver disease: influence of liver dysfunction and parenchymal pathology. Abdom Imaging. 1996; 21:318–323.9. Filippone A, Blakeborough A, Breuer J, Grazioli L, Gschwend S, Hammerstingl R, et al. Enhancement of liver parenchyma after injection of hepatocyte-specific MRI contrast media: a comparison of gadoxetic acid and gadobenate dimeglumine. J Magn Reson Imaging. 2010; 31:356–364.10. Murphy EA. Evaluation of clinical data: improvement of efficiency by simple transformation. J Chronic Dis. 1962; 15:795–809.11. Rouviere O, Yin M, Dresner MA, Rossman PJ, Burgart LJ, Fidler JL, et al. MR elastography of the liver: preliminary results. Radiology. 2006; 240:440–448.12. Schuhmann-Giampieri G, Mahler M, Roll G, Maibauer R, Schmitz S. Pharmacokinetics of the liver-specific contrast agent Gd-EOB-DTPA in relation to contrast-enhanced liver imaging in humans. J Clin Pharmacol. 1997; 37:587–596.13. Hamm B, Staks T, Muhler A, Bollow M, Taupitz M, Frenzel T, et al. Phase I clinical evaluation of Gd-EOB-DTPA as a hepatobiliary MR contrast agent: safety, pharmacokinetics, and MR imaging. Radiology. 1995; 195:785–792.14. Muhler A, Freise CE, Kuwatsuru R, Rosenau W, Liu T, Mintorovitch J, et al. Acute liver rejection: evaluation with cell-directed MR contrast agents in a rat transplantation model. Radiology. 1993; 186:139–146.15. Tschirch FT, Struwe A, Petrowsky H, Kakales I, Marincek B, Weishaupt D. Contrast-enhanced MR cholangiography with Gd-EOB-DTPA in patients with liver cirrhosis: visualization of the biliary ducts in comparison with patients with normal liver parenchyma. Eur Radiol. 2008; 18:1577–1586.16. Schuhmann-Giampieri G, Schmitt-Willich H, Press WR, Negishi C, Weinmann HJ, Speck U. Preclinical evaluation of Gd-EOB-DTPA as a contrast agent in MR imaging of the hepatobiliary system. Radiology. 1992; 183:59–64.17. Asbach P, Warmuth C, Stemmer A, Rief M, Huppertz A, Hamm B, et al. High spatial resolution T1-weighted MR imaging of liver and biliary tract during uptake phase of a hepatocyte-specific contrast medium. Invest Radiol. 2008; 43:809–815.18. Gandhi SN, Brown MA, Wong JG, Aguirre DA, Sirlin CB. MR contrast agents for liver imaging: what, when, how. Radiographics. 2006; 26:1621–1636.
- Full Text Links
-
- Actions
-
Cited
- CITED
-
- Close
- Share
-
- Similar articles
-
- Hepatic Lymphoma Representing Iso-Signal Intensity on Hepatobiliary Phase, in Gd-EOB-DTPA-Enhanced MRI: Case Report
- Supradiaphragmatic Liver Confirmed by a Hepatocyte-specific Contrast Agent (Gd-EOB-DTPA): A Case Report
- A feasibility study evaluating the relationship between dose and focal liver reaction in stereotactic ablative radiotherapy for liver cancer based on intensity change of Gd-EOB-DTPA-enhanced magnetic resonance images
- Quantitative Evaluation of Liver Function with MRI Using Gd-EOB-DTPA
- Enhancement Pattern of Liver Parenchyma during Late Dynamic Phase Imaging: Comparison between Gd-EOB-DTPA and Gd-DTPA-BMA
