Investig Magn Reson Imaging.
2015 Jun;19(2):107-113. 10.13104/imri.2015.19.2.107.
Findings Regarding an Intracranial Hemorrhage on the Phase Image of a Susceptibility-Weighted Image (SWI), According to the Stage, Location, and Size
- Affiliations
-
- 1Department of Radiology, Seoul St. Mary's Hospital, College of Medicine, The Catholic University of Korea, Seoul, Korea. hschoi@catholic.ac.kr
- 2Department of Radiology, St. Paul's Hospital, College of Medicine, The Catholic University of Korea, Seoul, Korea.
- KMID: 2175590
- DOI: http://doi.org/10.13104/imri.2015.19.2.107
Abstract
- PURPOSE
Susceptibility weighted imaging (SWI) is a new magnetic resonance technique that can exploit the magnetic susceptibility differences of various tissues. Intracranial hemorrhage (ICH) looks a dark blooming on the magnitude images of SWI. However, the pattern of ICH on phase images is not well known. The purpose of this study is to characterize hemorrhagic lesions on the phase images of SWI.
MATERIALS AND METHODS
We retrospectively enrolled patients with ICH, who underwent both SWI and precontrast CT, between 2012 and 2013 (n = 95). An SWI was taken, using the 3-tesla system. A phase map was generated after post-processing. Cases with an intracranial hemorrhage were reviewed by an experienced neuroradiologist and a trainee radiologist, with 10 years and 3 years of experience, respectively. The types and stages of the hemorrhages were determined in correlation with the precontrast CT, the T1- and T2-weighted images, and the FLAIR images. The size of the hemorrhage was measured by a one-directional axis on a magnitude image of SWI. The phase values of the ICH were qualitatively evaluated: hypo-, iso-, and hyper-intensity. We summarized the imaging features of the intracranial hemorrhage on the phase map of the SWI.
RESULTS
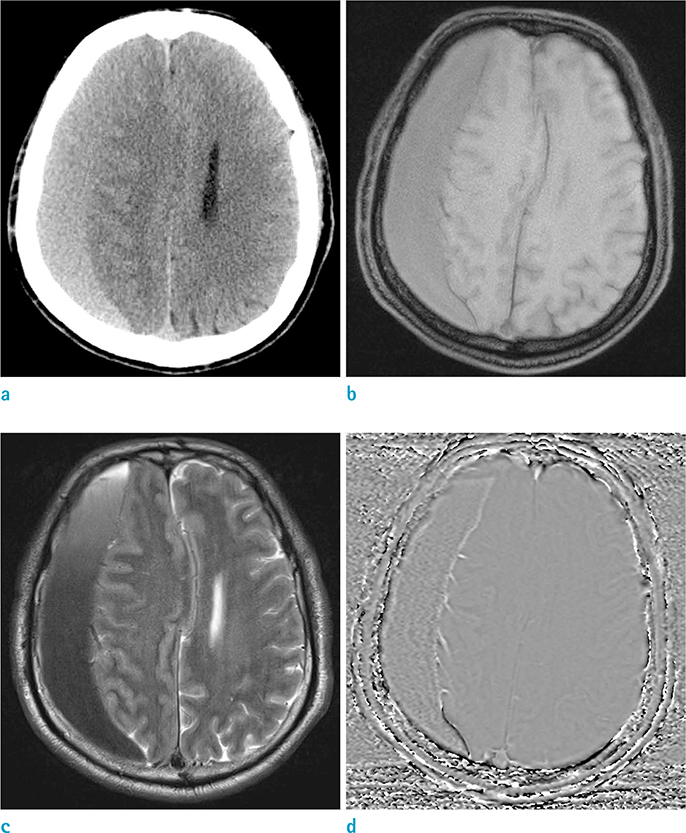
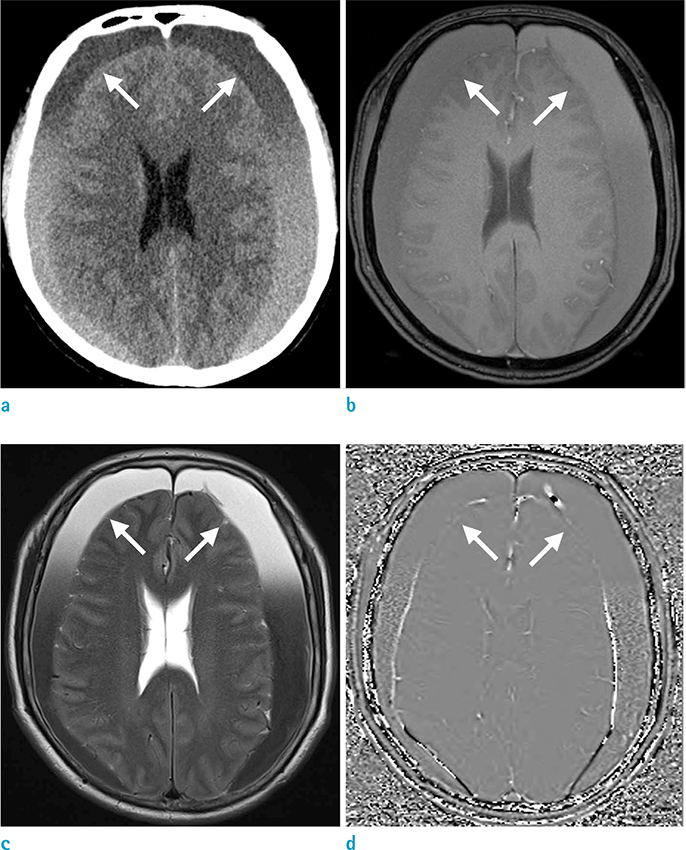
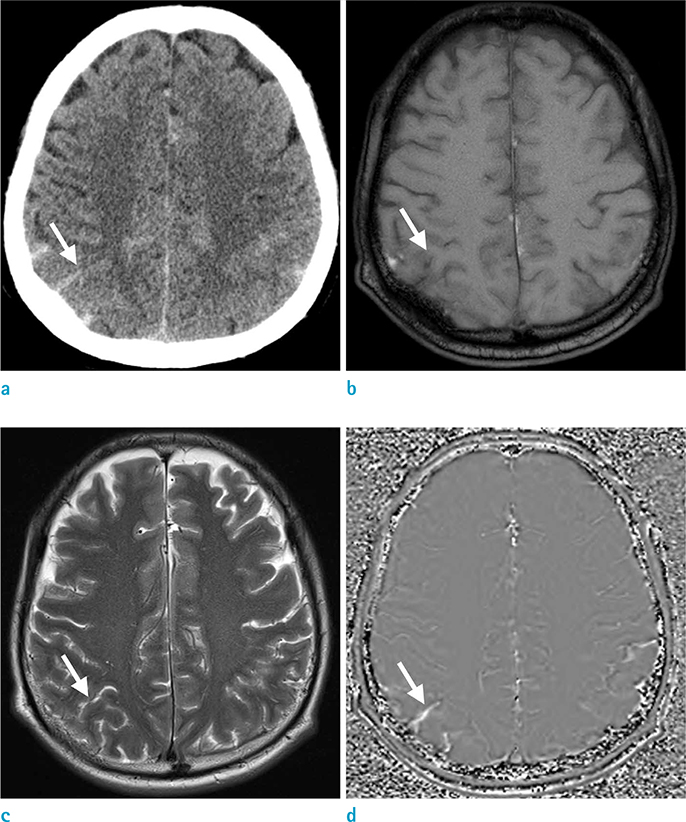
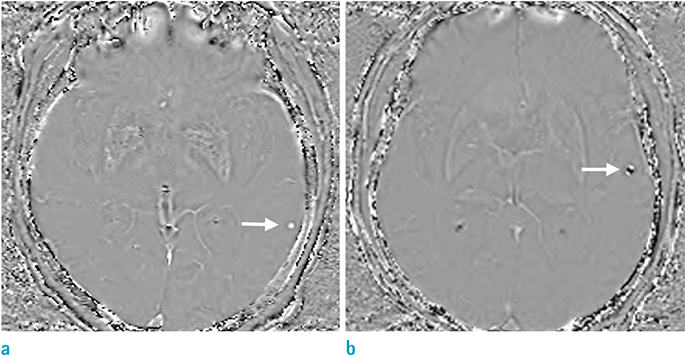
Four types of hemorrhage are observed: subdural and epidural; subarachnoid; parenchymal hemorrhage; and microbleed. The stages of the ICH were classified into 4 groups: acute (n = 34); early subacute (n = 11); late subacute (n = 15); chronic (n = 8); stage-unknown microbleeds (n = 27). The acute and early subacute hemorrhage showed heterogeneous mixed hyper-, iso-, and hypo-signal intensity; the late subacute hemorrhage showed homogeneous hyper-intensity, and the chronic hemorrhage showed a shrunken iso-signal intensity with the hyper-signal rim. All acute subarachnoid hemorrhages showed a homogeneous hyper-signal intensity. All parenchymal hemorrhages (> 3 mm) showed a dipole artifact on the phase images; however, microbleeds of less than 3 mm showed no dipole artifact. Larger hematomas showed a heterogeneous mixture of hyper-, iso-, and hypo-signal intensities.
CONCLUSION
The pattern of the phase value of the SWI showed difference, according to the type, stage, and size.
Keyword
MeSH Terms
Figure
Reference
-
1. Parizel PM, Makkat S, Van Miert E, Van Goethem JW, van den Hauwe L, De Schepper AM. Intracranial hemorrhage: principles of CT and MRI interpretation. Eur Radiol. 2001; 11:1770–1783.2. Bradley WG Jr. MR appearance of hemorrhage in the brain. Radiology. 1993; 189:15–26.3. Allkemper T, Tombach B, Schwindt W, et al. Acute and subacute intracerebral hemorrhages: comparison of MR imaging at 1.5 and 3.0 T--initial experience. Radiology. 2004; 232:874–881.4. Nandigam RN, Viswanathan A, Delgado P, et al. MR imaging detection of cerebral microbleeds: effect of susceptibility-weighted imaging, section thickness, and field strength. AJNR Am J Neuroradiol. 2009; 30:338–343.5. Gupta RK, Rao SB, Jain R, et al. Differentiation of calcification from chronic hemorrhage with corrected gradient echo phase imaging. J Comput Assist Tomogr. 2001; 25:698–704.6. Haacke EM, Mittal S, Wu Z, Neelavalli J, Cheng YC. Susceptibility-weighted imaging: technical aspects and clinical applications, part 1. AJNR Am J Neuroradiol. 2009; 30:19–30.7. Mittal S, Wu Z, Neelavalli J, Haacke EM. Susceptibility-weighted imaging: technical aspects and clinical applications, part 2. AJNR Am J Neuroradiol. 2009; 30:232–252.8. Gomori JM, Grossman RI. Mechanisms responsible for the MR appearance and evolution of intracranial hemorrhage. Radiographics. 1988; 8:427–440.9. Deistung A, Rauscher A, Sedlacik J, Witoszynskyj S, Reichenbach JR. Informatics in Radiology: GUIBOLD: a graphical user interface for image reconstruction and data analysis in susceptibility-weighted MR imaging. Radiographics. 2008; 28:639–651.10. Wu Z, Li S, Lei J, An D, Haacke EM. Evaluation of traumatic subarachnoid hemorrhage using susceptibility-weighted imaging. AJNR Am J Neuroradiol. 2010; 31:1302–1310.11. Liu J, Liu T, de Rochefort L, et al. Morphology enabled dipole inversion for quantitative susceptibility mapping using structural consistency between the magnitude image and the susceptibility map. Neuroimage. 2012; 59:2560–2568.12. Schelhorn J, Gramsch C, Deuschl C, et al. Intracranial hemorrhage detection over time using susceptibility-weighted magnetic resonance imaging. Acta Radiol. 2014; [Epub ahead of print].13. Liu T, Xu W, Spincemaille P, Avestimehr AS, Wang Y. Accuracy of the morphology enabled dipole inversion (MEDI) algorithm for quantitative susceptibility mapping in MRI. IEEE Trans Med Imaging. 2012; 31:816–824.14. McAuley G, Schrag M, Sipos P, et al. Quantification of punctate iron sources using magnetic resonance phase. Magn Reson Med. 2010; 63:106–115.
- Full Text Links
- Actions
-
Cited
- CITED
-
- Close
- Share
- Similar articles
-
- Comparison of Single- and Multi-Echo Susceptibility-Weighted Imaging in Detecting Cerebral Arteriovenous Shunts: A Preliminary Study
- Detection of Traumatic Cerebral Microbleeds by Susceptibility-Weighted Image of MRI
- Associated Brain Parenchymal Abnormalities in Developmental Venous Anomalies: Evaluation with Susceptibility-weighted MR Imaging
- A Case of Traumatic Unilateral Internuclear Ophthalmoplegia: Clinical Significance of Susceptibility-Weighted Imaging
- Cerebral Air Embolism: a Case Report with an Emphasis of its Pathophysiology and MRI Findings


