Nomogram of Naive Bayesian Model for Recurrence Prediction of Breast Cancer
- Affiliations
-
- 1Department of Public Health and Medical Administration, Dongyang University, Yeongju, Korea.
- 2Department of Biomedical Informatics, Ajou University School of Medicine, Suwon, Korea. veritas@ajou.ac.kr
- 3Breast Cancer Center, Ulsan City Hospital, Ulsan, Korea.
- KMID: 2166938
- DOI: http://doi.org/10.4258/hir.2016.22.2.89
Abstract
OBJECTIVES
Breast cancer has a high rate of recurrence, resulting in the need for aggressive treatment and close follow-up. However, previously established classification guidelines, based on expert panels or regression models, are controversial. Prediction models based on machine learning show excellent performance, but they are not widely used because they cannot explain their decisions and cannot be presented on paper in the way that knowledge is customarily represented in the clinical world. The principal objective of this study was to develop a nomogram based on a naïve Bayesian model for the prediction of breast cancer recurrence within 5 years after breast cancer surgery.
METHODS
The nomogram can provide a visual explanation of the predicted probabilities on a sheet of paper. We used a data set from a Korean tertiary teaching hospital of 679 patients who had undergone breast cancer surgery between 1994 and 2002. Seven prognostic factors were selected as independent variables for the model.
RESULTS
The accuracy was 80%, and the area under the receiver operating characteristics curve (AUC) of the model was 0.81.
CONCLUSIONS
The nomogram can be easily used in daily practice to aid physicians and patients in making appropriate treatment decisions after breast cancer surgery.
Keyword
MeSH Terms
Figure
-
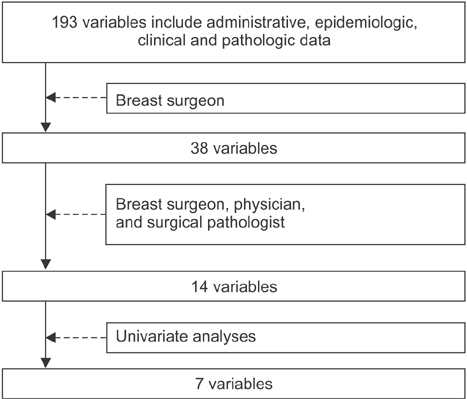
Figure 1 Process of selecting prognostic factors in the model using both previously established clinical knowledge and statistical analysis.
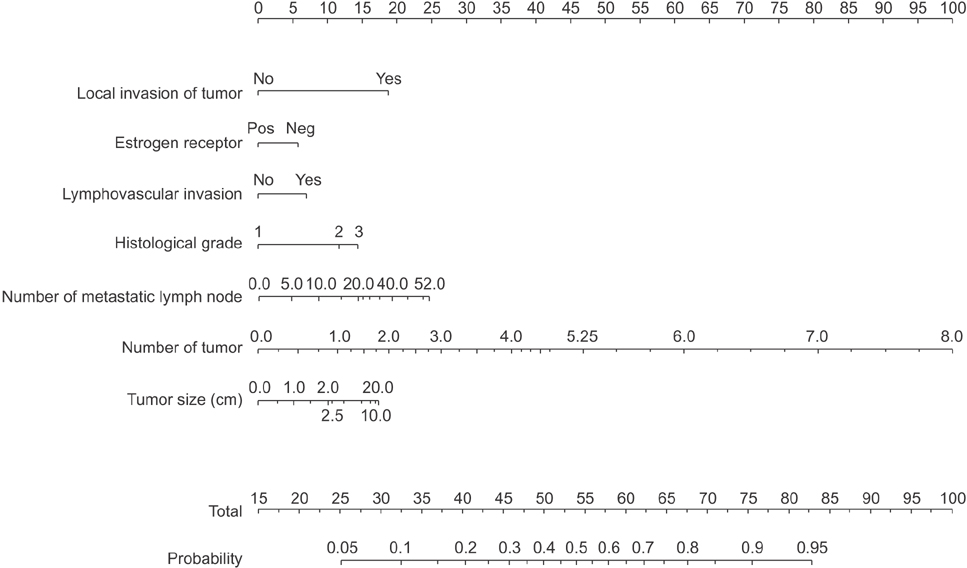
Figure 2 Proposed nomogram for the prediction of breast cancer recurrence within 5 years after breast cancer surgery. By using a measure, each score of the variables can be transferred into the total score, which is linked to the responding probability.
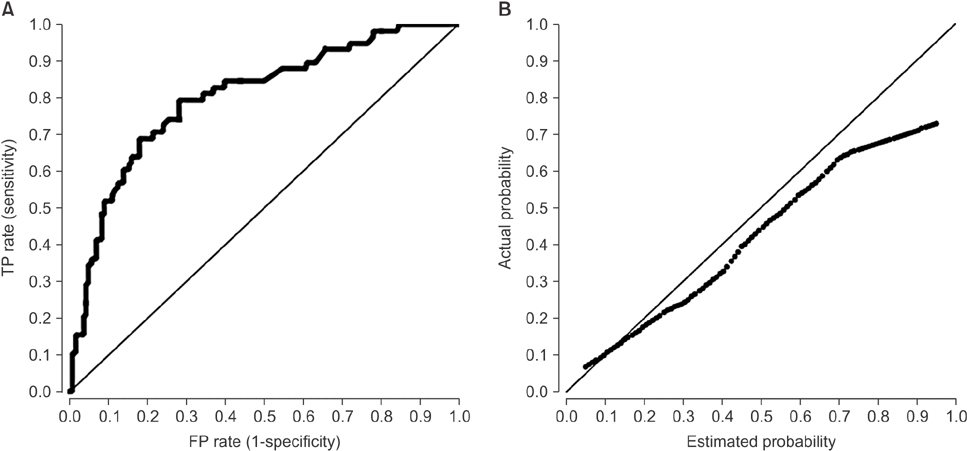
Figure 3 Receiver operating characteristics (ROC) curve and calibration plot for the naïve Bayesian classifier at 5 years after breast cancer surgery. (A) The area under the ROC curve (AUC) was 0.81 for naïve Bayesian classifier. (B) The x-axis represents the predicted probability of recurrence; the y-axis represents observed probability. TP: true positive, FP: false positive.
Reference
-
1. Korean Breast Cancer Society. Breast cancer facts and figures 2006-2008. Seoul: Breast Cancer Society;2008. p. 1–16.2. Bourdes VS, Bonnevay S, Lisboa PJ, Aung MH, Chabaud S, Bachelot T, et al. Breast cancer predictions by neural networks analysis: a comparison with logistic regression. In : Proceedings of 29th Annual International Conference of the IEEE Engineering in Medicine and Biology Society (EMBS); 2007 Aug 22-26; Lyon, France. p. 5424–5427.3. Jerez JM, Franco L, Alba E, Llombart-Cussac A, Lluch A, Ribelles N, et al. Improvement of breast cancer relapse prediction in high risk intervals using artificial neural networks. Breast Cancer Res Treat. 2005; 94(3):265–272.
Article4. Jerez-Aragones JM, Gomez-Ruiz JA, Ramos-Jimenez G, Munoz-Perez J, Alba-Conejo E. A combined neural network and decision trees model for prognosis of breast cancer relapse. Artif Intell Med. 2003; 27(1):45–63.
Article5. Yi M, Buchholz TA, Meric-Bernstam F, Bedrosian I, Hwang RF, Ross MI, et al. Classification of ipsilateral breast tumor recurrences after breast conservation therapy can predict patient prognosis and facilitate treatment planning. Ann Surg. 2011; 253(3):572–579.
Article6. Mozina M, Demsar J, Kattan M, Zupan B. Nomograms for naive Bayesian classifiers and how can they help in medical data analysis. In : Proceedings of International Medical Informatics Association (MEDINFO2004); 2004 Sept 7-11; San Francisco, CA. p. 1762.7. Kim W, Kim KS, Lee JE, Noh DY, Kim SW, Jung YS, et al. Development of novel breast cancer recurrence prediction model using support vector machine. J Breast Cancer. 2012; 15(2):230–238.
Article8. Mozina M, Demsar J, Kattan MW, Zupan B. Nomograms for visualization of naive Bayesian classifier. In : Boulicaut JF, Esposito F, Giannotti F, Pedreschi D, editors. Knowledge discovery in databases: PKDD 2004. Heidelberg: Springer;2004. p. 337–348.9. Huang J, Ling CX. Using AUC and accuracy in evaluating learning algorithms. IEEE Trans Knowl Data Eng. 2005; 17(3):299–310.
Article10. Greiner M, Pfeiffer D, Smith RD. Principles and practical application of the receiver-operating characteristic analysis for diagnostic tests. Prev Vet Med. 2000; 45(1-2):23–41.
Article11. Aitkin M, Laird N, Francis B. A reanalysis of the Stanford heart transplant data. J Am Stat Assoc. 1983; 78(382):264–274.
Article12. Xiang A, Lapuerta P, Ryutov A, Buckley J, Azen S. Comparison of the performance of neural network methods and Cox regression for censored survival data. Comput Stat Data Anal. 2000; 34(2):243–257.
Article13. Ohno-Machado L. A comparison of Cox proportional hazards and artificial neural network models for medical prognosis. Comput Biol Med. 1997; 27(1):55–65.
Article
- Full Text Links
-
- Actions
-
Cited
- CITED
-
- Close
- Share
-
- Similar articles
-
- A Hybrid Bayesian Network Model for Predicting Breast Cancer Prognosis
- Comparisons of predictive modeling techniques for breast cancer in Korean women
- A Nomogram Model for Prediction of Tracheostomy in Patients With Traumatic Cervical Spinal Cord Injury
- External validation of IBTR! 2.0 nomogram for prediction of ipsilateral breast tumor recurrence
- Development of Breast Cancer Predication Model Using Neural Networks
