Evaluation of Renal Oxygenation Level Changes after Water Loading Using Susceptibility-Weighted Imaging and T2* Mapping
- Affiliations
-
- 1Department of Radiology, Third Affiliated Hospital of Suzhou University, Changzhou, Jiangsu 213003, China. suzhxingwei@126.com
- 2Shanghai Key Laboratory of Magnetic Resonance Imaging, East China Normal University, Shanghai 200241, China.
- 3Philips Healthcare, Shanghai 200000, China.
- KMID: 2155556
- DOI: http://doi.org/10.3348/kjr.2015.16.4.827
Abstract
OBJECTIVE
To assess the feasibility of susceptibility-weighted imaging (SWI) while monitoring changes in renal oxygenation level after water loading.
MATERIALS AND METHODS
Thirty-two volunteers (age, 28.0 +/- 2.2 years) were enrolled in this study. SWI and multi-echo gradient echo sequence-based T2* mapping were used to cover the kidney before and after water loading. Cortical and medullary parameters were measured using small regions of interest, and their relative changes due to water loading were calculated based on baseline and post-water loading data. An intraclass correlation coefficient analysis was used to assess inter-observer reliability of each parameter. A receiver operating characteristic curve analysis was conducted to compare the performance of the two methods for detecting renal oxygenation changes due to water loading.
RESULTS
Both medullary phase and medullary T2* values increased after water loading (p < 0.001), although poor correlations were found between the phase changes and the T2* changes (p > 0.05). Interobserver reliability was excellent for the T2* values, good for SWI cortical phase values, and moderate for the SWI medullary phase values. The area under receiver operating characteristic curve of the SWI medullary phase values was 0.85 and was not different from the medullary T2* value (0.84).
CONCLUSION
Susceptibility-weighted imaging enabled monitoring changes in the oxygenation level in the medulla after water loading, and may allow comparable feasibility to detect renal oxygenation level changes due to water loading compared with that of T2* mapping.
Keyword
MeSH Terms
Figure
-

Fig. 1 Drawing of regions of interest (ROIs) in renal parenchyma. 30-year-old male volunteer underwent transverse susceptibility-weighted imaging and T2* mapping before water loading. One cortical ROI and one medullary ROI were drawn in each segment on magnitude image and were applied to phase image and T2* map to measure parameters in cortex and medulla, respectively.
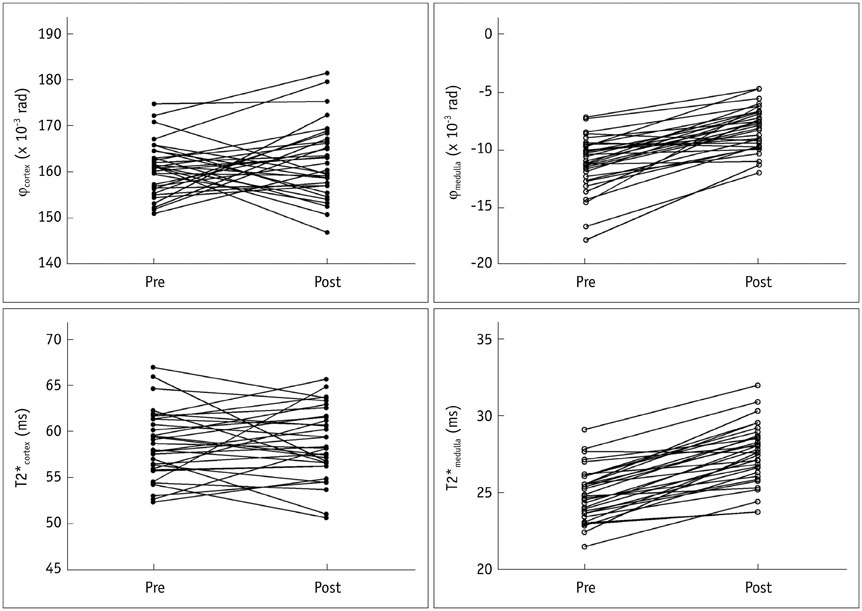
Fig. 2 Distinct change in trend of quantitative parameter measurements appeared in renal medulla after water loading. Very few changes in phase and T2* values occurred in renal cortex, whereas medullary values increased for most of subjects after water loading.
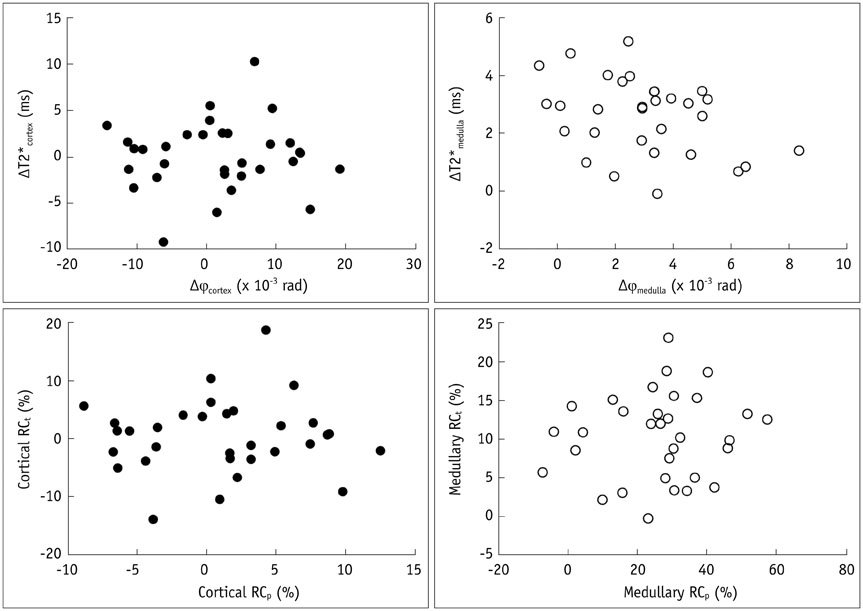
Fig. 3 Correlations between phase changes and T2* changes due to water loading. Poor correlations were present between phase changes and T2* changes (all p > 0.05).

Fig. 4 Receiver operating characteristics curve analysis of two methods for detecting changes in renal oxygenation levels due to water loading. Area under receiver operating characteristic curve (AUC) was not significantly larger for medullary phase (φmedulla), as measured using susceptibility weighted imaging, than medullary T2* values (T2*medulla) using T2* map.
Reference
-
1. Brezis M, Rosen S. Hypoxia of the renal medulla--its implications for disease. N Engl J Med. 1995; 332:647–655.2. Eckardt KU, Bernhardt WM, Weidemann A, Warnecke C, Rosenberger C, Wiesener MS, et al. Role of hypoxia in the pathogenesis of renal disease. Kidney Int Suppl. 2005; (99):S46–S51.3. Epstein FH, Agmon Y, Brezis M. Physiology of renal hypoxia. Ann N Y Acad Sci. 1994; 718:72–81. discussion 81-824. Zhang W, Edwards A. Oxygen transport across vasa recta in the renal medulla. Am J Physiol Heart Circ Physiol. 2002; 283:H1042–H1055.5. Li LP, Vu AT, Li BS, Dunkle E, Prasad PV. Evaluation of intrarenal oxygenation by BOLD MRI at 3.0 T. J Magn Reson Imaging. 2004; 20:901–904.6. Tumkur SM, Vu AT, Li LP, Pierchala L, Prasad PV. Evaluation of intra-renal oxygenation during water diuresis: a time-resolved study using BOLD MRI. Kidney Int. 2006; 70:139–143.7. Ji L, Li LP, Schnitzer T, Du H, Prasad PV. Intra-renal oxygenation in rat kidneys during water loading: effects of cyclooxygenase (COX) inhibition and nitric oxide (NO) donation. J Magn Reson Imaging. 2010; 32:383–387.8. Li LP, Storey P, Pierchala L, Li W, Polzin J, Prasad P. Evaluation of the reproducibility of intrarenal R2* and Delta R2* measurements following administration of furosemide and during waterload. J Magn Reson Imaging. 2004; 19:610–616.9. Li LP, Ji L, Lindsay S, Prasad PV. Evaluation of intrarenal oxygenation in mice by BOLD MRI on a 3.0T human whole-body scanner. J Magn Reson Imaging. 2007; 25:635–638.10. Haacke EM, Xu Y, Cheng YC, Reichenbach JR. Susceptibility weighted imaging (SWI). Magn Reson Med. 2004; 52:612–618.11. Haacke EM, Tang J, Neelavalli J, Cheng YC. Susceptibility mapping as a means to visualize veins and quantify oxygen saturation. J Magn Reson Imaging. 2010; 32:663–676.12. Zuo CS, Rofsky NM, Mahallati H, Yu J, Zhang M, Gilbert S, et al. Visualization and quantification of renal R2* changes during water diuresis. J Magn Reson Imaging. 2003; 17:676–682.13. Wu Z, Mittal S, Kish K, Yu Y, Hu J, Haacke EM. Identification of calcification with MRI using susceptibility-weighted imaging: a case study. J Magn Reson Imaging. 2009; 29:177–182.14. Aukland K, Krog J. Renal oxygen tension. Nature. 1960; 188:671.15. Han F, Xiao W, Xu Y, Wu J, Wang Q, Wang H, et al. The significance of BOLD MRI in differentiation between renal transplant rejection and acute tubular necrosis. Nephrol Dial Transplant. 2008; 23:2666–2672.16. Prasad PV, Epstein FH. Changes in renal medullary pO2 during water diuresis as evaluated by blood oxygenation level-dependent magnetic resonance imaging: effects of aging and cyclooxygenase inhibition. Kidney Int. 1999; 55:294–298.17. Ning N, Zhang L, Gao J, Zhang Y, Ren Z, Niu G, et al. Assessment of iron deposition and white matter maturation in infant brains by using enhanced T2 star weighted angiography (ESWAN): R2* versus phase values. PLoS One. 2014; 9:e89888.18. Yan SQ, Sun JZ, Yan YQ, Wang H, Lou M. Evaluation of brain iron content based on magnetic resonance imaging (MRI): comparison among phase value, R2* and magnitude signal intensity. PLoS One. 2012; 7:e31748.19. Li M, Hu J, Miao Y, Shen H, Tao D, Yang Z, et al. In vivo measurement of oxygenation changes after stroke using susceptibility weighted imaging filtered phase data. PLoS One. 2013; 8:e63013.20. Neugarten J. Renal BOLD-MRI and assessment for renal hypoxia. Kidney Int. 2012; 81:613–614.21. Aquino D, Bizzi A, Grisoli M, Garavaglia B, Bruzzone MG, Nardocci N, et al. Age-related iron deposition in the basal ganglia: quantitative analysis in healthy subjects. Radiology. 2009; 252:165–172.22. Yao B, Li TQ, Gelderen Pv, Shmueli K, de Zwart JA, Duyn JH. Susceptibility contrast in high field MRI of human brain as a function of tissue iron content. Neuroimage. 2009; 44:1259–1266.23. Tao R, Zhang J, Dai Y, You Z, Fan Y, Cui J, et al. An in vitro and in vivo analysis of the correlation between susceptibility-weighted imaging phase values and R2* in cirrhotic livers. PLoS One. 2012; 7:e45477.24. Haacke EM, Miao Y, Liu M, Habib CA, Katkuri Y, Liu T, et al. Correlation of putative iron content as represented by changes in R2* and phase with age in deep gray matter of healthy adults. J Magn Reson Imaging. 2010; 32:561–576.25. Liu C, Li W, Wu B, Jiang Y, Johnson GA. 3D fiber tractography with susceptibility tensor imaging. Neuroimage. 2012; 59:1290–1298.26. Ries M, Jones RA, Basseau F, Moonen CT, Grenier N. Diffusion tensor MRI of the human kidney. J Magn Reson Imaging. 2001; 14:42–49.27. Sigmund EE, Vivier PH, Sui D, Lamparello NA, Tantillo K, Mikheev A, et al. Intravoxel incoherent motion and diffusion-tensor imaging in renal tissue under hydration and furosemide flow challenges. Radiology. 2012; 263:758–769.28. Raman JD, Bensalah K, Bagrodia A, Tracy CR, Kabbani W, Sagalowsky AI, et al. Comparison of tissue oxygenation profiles using 3 different methods of vascular control during porcine partial nephrectomy. Urology. 2009; 74:926–931.29. Djamali A, Sadowski EA, Muehrer RJ, Reese S, Smavatkul C, Vidyasagar A, et al. BOLD-MRI assessment of intrarenal oxygenation and oxidative stress in patients with chronic kidney allograft dysfunction. Am J Physiol Renal Physiol. 2007; 292:F513–F522.30. Li J, Chang S, Liu T, Wang Q, Cui D, Chen X, et al. Reducing the object orientation dependence of susceptibility effects in gradient echo MRI through quantitative susceptibility mapping. Magn Reson Med. 2012; 68:1563–1569.
- Full Text Links
-
- Actions
-
Cited
- CITED
-
- Close
- Share
-
- Similar articles
-
- Quantitative Susceptibility Mapping of Oxygen Metabolism: A Feasibility Study Utilizing a Large-Scale Clinical Dataset
- Feasibility of Ultrashort Echo Time T2* Mapping in Comparison With T2 Mapping for Quantitative Evaluation of Meniscal Degeneration
- The Usefulness of T2-weighted MR Urography and Contrast Enhanced MR Urography in the Evaluation of Obstructive Uropathy: Comparisonal Study with Antegrade Pyelography1
- Relationship between Abnormal Hyperintensity on T2-Weighted Images Around Developmental Venous Anomalies and Magnetic Susceptibility of Their Collecting Veins: In-Vivo Quantitative Susceptibility Mapping Study
- Usefulness of Breath-hold T2-w d T2-weighted MR Imaging in Patients with Myocardial Infarction: Comparison with Delayed Enhancement
