Current Clinical Application of Intracardiac Flow Analysis Using Echocardiography
- Affiliations
-
- 1Division of Cardiology, Severance Cardiovascular Hospital, Yonsei University College of Medicine, Seoul, Korea. grhong@yuhs.ac
- 2School of Medicine, University of Queensland, Herston, QLD, Australia.
- 3University of Trieste, Trieste, Italy.
- 4Department of Cardiovascular Medicine, Piedmont Heart Institute, Atlanta, GA, USA.
- KMID: 2135412
- DOI: http://doi.org/10.4250/jcu.2013.21.4.155
Abstract
- In evaluating the cardiac function, it is important to have a comprehensive assessment of structural factors, such as the myocardial or valvular function and intracardiac flow dynamics that pass the heart. Vortex flow that form during left ventricular filling have specific geometry and anatomical location that are critical determinants of directed blood flow during ejection. The formation of abnormal vortices relates to the abnormal cardiac function. Therefore, vortex flow may offer a novel index of cardiac dysfunction. Intracardiac flow visualization using ultrasound technique has definite advantages with a higher temporal resolution and availability in real time clinical setting. Vector flow mapping based on color-Doppler and contrast echocardiography using particle image velocimetry is currently being used for visualizing the intracardiac flow. The purpose of this review is to provide readers with an update on the current method for analyzing intracardiac flow using echocardiography and its clinical applications.
Figure
-
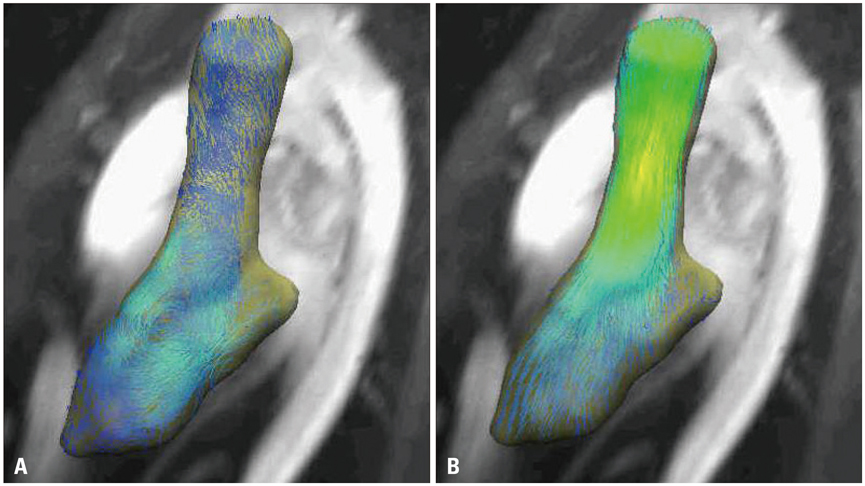
Fig. 1 Four-dimensional flow magnetic resonance imaging (MRI) and visualization of 3-dimensional flow. Four-dimensional cine MRI views of left ventricle and ascending aorta in normal subject in diastole (A) and systole (B).

Fig. 2 Examples of blood velocity mapping in a normal left ventricle overlaid on a sequence of anatomical B-mode apical long-axis images during early diastole (A), isovolumic contraction (B). Redrawn from Garcia et al.21)

Fig. 3 Example of left ventricular vortex flow analyzed by contrast echocardiography using particle image velocimetry method. The echo freeze frames represent the velocity vector on the scan-plane, superimposed to the reconstructed Doppler representation (A). Parametric representations of steady streaming field (B), pulsatile strength field (C) and vortex size change throughout the cardiac cycle (D). Redrawn from Hong et al.2)

Fig. 4 Description of quantitative parameters of the vortex location and shape. Vortex depth (A, black line), vortex transverse position (B, black line), vortex length (C, black arrow), and vortex width (D, black arrow). Redrawn from Son et al.30)
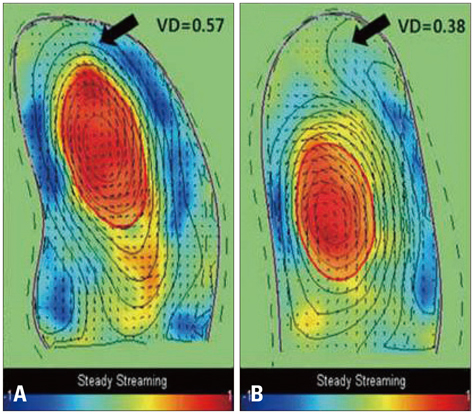
Fig. 5 Parametric representation of the steady streaming field in the non-thrombus (A) and thrombus group (B) are evaluated in apical 4-chamber view. The center of the average vortex flow was located near the apex in the non-thrombus group (A). However, in the thrombus group, the vortex was located in the center of the left ventricle (LV), much farther from the apex and did not reach to the LV apex (B). A black arrow indicates different vortex flow pattern in the apex between the 2 groups. Redrawn from Son et al.30) VD: vortex depth.
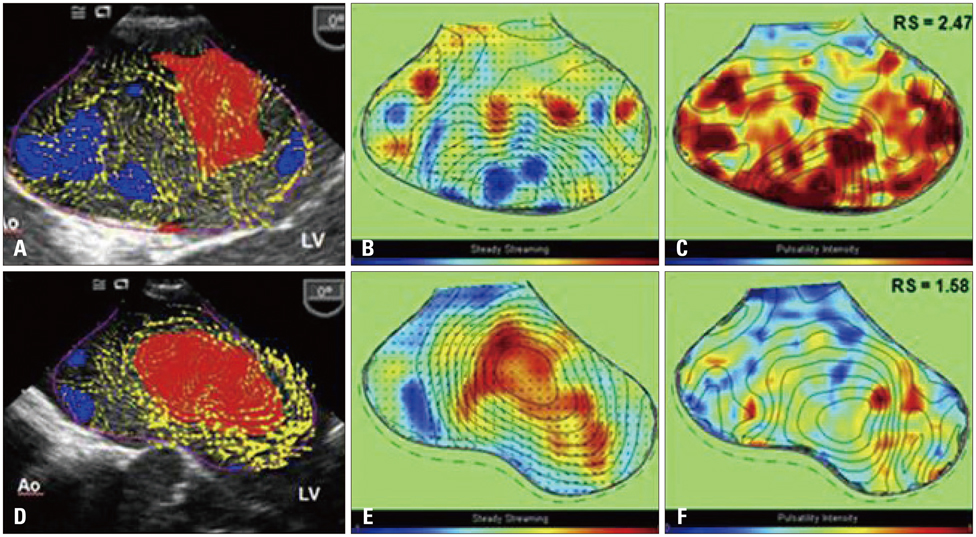
Fig. 6 The echo freeze frames (A and D) parametric representation of steady streaming field (B and E) and the pulsatile strength field (C and F) in the control group (upper panel) and the atrial fibrillation (AF) group (lower panel). The left atrial flow in controls showed several vortices with strong pulsatility in the periphery (B and C, red-colored area), whereas a large, merged, and spherical vortex with weak pulsatility (E and F, blue-colored area) was noted in the AF group. Redrawn from Park et al.42) Ao: aorta, LV: left ventricle, RS: relative strength.
Reference
-
1. Sengupta PP, Pedrizzetti G, Kilner PJ, Kheradvar A, Ebbers T, Tonti G, Fraser AG, Narula J. Emerging trends in CV flow visualization. JACC Cardiovasc Imaging. 2012; 5:305–316.
Article2. Hong GR, Pedrizzetti G, Tonti G, Li P, Wei Z, Kim JK, Baweja A, Liu S, Chung N, Houle H, Narula J, Vannan MA. Characterization and quantification of vortex flow in the human left ventricle by contrast echocardiography using vector particle image velocimetry. JACC Cardiovasc Imaging. 2008; 1:705–717.
Article3. Wu JZ, Ma HY, Zhou MD. Vorticity and vortex dynamics. Berlin-Heidelberg: Springer-Verlag;2006.4. Pedrizzetti G, Domenichini F. Nature optimizes the swirling flow in the human left ventricle. Phys Rev Lett. 2005; 95:108101.
Article5. Mohiaddin RH, Yang GZ, Kilner PJ. Visualization of flow by vector analysis of multidirectional cine MR velocity mapping. J Comput Assist Tomogr. 1994; 18:383–392.
Article6. Cenedese A, Del Prete Z, Miozzi M, Querzoli G. A laboratory investigation of the flow in the left ventricle of a human heart with prosthetic, tilting-disk valves. Exp Fluids. 2005; 39:322–335.
Article7. Kim WY, Walker PG, Pedersen EM, Poulsen JK, Oyre S, Houlind K, Yoganathan AP. Left ventricular blood flow patterns in normal subjects: a quantitative analysis by three-dimensional magnetic resonance velocity mapping. J Am Coll Cardiol. 1995; 26:224–238.
Article8. Grosberg A, Gharib M, Kheradvar A. Effect of fiber geometry on pulsatile pumping and energy expenditure. Bull Math Biol. 2009; 71:1580–1598.
Article9. Föll D, Taeger S, Bode C, Jung B, Markl M. Age, gender, blood pressure, and ventricular geometry influence normal 3D blood flow characteristics in the left heart. Eur Heart J Cardiovasc Imaging. 2013; 14:366–373.
Article10. Moran PR. A flow velocity zeugmatographic interlace for NMR imaging in humans. Magn Reson Imaging. 1982; 1:197–203.
Article11. Bryant DJ, Payne JA, Firmin DN, Longmore DB. Measurement of flow with NMR imaging using a gradient pulse and phase difference technique. J Comput Assist Tomogr. 1984; 8:588–593.
Article12. Pelc NJ, Herfkens RJ, Shimakawa A, Enzmann DR. Phase contrast cine magnetic resonance imaging. Magn Reson Q. 1991; 7:229–254.13. Rodriguez Muñoz D, Markl M, Moya Mur JL, Barker A, Fernández-Golfín C, Lancellotti P, Zamorano Gómez JL. Intracardiac flow visualization: current status and future directions. Eur Heart J Cardiovasc Imaging. 2013; 14:1029–1038.
Article14. Firmin DN, Gatehouse PD, Konrad JP, Yang GZ, Kilner PJ, Longmore DB. Rapid 7-dimensional imaging of pulsatile flow. In : Proceedings of Computers in Cardiology Conference; 1993 Sep 5-8; London: IEEE Computer Society Press;1993. p. 353–356.15. Wigström L, Sjöqvist L, Wranne B. Temporally resolved 3D phase-contrast imaging. Magn Reson Med. 1996; 36:800–803.
Article16. Napel S, Lee DH, Frayne R, Rutt BK. Visualizing three-dimensional flow with simulated streamlines and three-dimensional phase-contrast MR imaging. J Magn Reson Imaging. 1992; 2:143–153.
Article17. Buonocore MH. Visualizing blood flow patterns using streamlines, arrows, and particle paths. Magn Reson Med. 1998; 40:210–226.
Article18. Ishizu T, Seo Y, Ishimitsu T, Obara K, Moriyama N, Kawano S, Watanabe S, Yamaguchi I. The wake of a large vortex is associated with intraventricular filling delay in impaired left ventricles with a pseudonormalized transmitral flow pattern. Echocardiography. 2006; 23:369–375.
Article19. Shandas R, Gharib M, Sahn DJ. Nature of flow acceleration into a finite-sized orifice: steady and pulsatile flow studies on the flow convergence region using simultaneous ultrasound Doppler flow mapping and laser Doppler velocimetry. J Am Coll Cardiol. 1995; 25:1199–1212.
Article20. Uejima T, Koike A, Sawada H, Aizawa T, Ohtsuki S, Tanaka M, Furukawa T, Fraser AG. A new echocardiographic method for identifying vortex flow in the left ventricle: numerical validation. Ultrasound Med Biol. 2010; 36:772–788.
Article21. Garcia D, Del Alamo JC, Tanne D, Yotti R, Cortina C, Bertrand E, Antoranz JC, Perez-David E, Rieu R, Fernandez-Aviles F, Bermejo J. Two-dimensional intraventricular flow mapping by digital processing conventional color-Doppler echocardiography images. IEEE Trans Med Imaging. 2010; 29:1701–1713.
Article22. Ohtsuki S, Tanaka M. The flow velocity distribution from the Doppler information on a plane in three-dimensional flow. J Vis (Tokyo). 2006; 9:69–82.
Article23. Mulvagh SL, DeMaria AN, Feinstein SB, Burns PN, Kaul S, Miller JG, Monaghan M, Porter TR, Shaw LJ, Villanueva FS. Contrast echocardiography: current and future applications. J Am Soc Echocardiogr. 2000; 13:331–342.
Article24. Thanigaraj S, Chugh R, Schechtman KB, Lee LV, Wade RL, Pérez JE. Defining left ventricular segmental and global function by echocardiographic intraventricular contrast flow patterns. Am J Cardiol. 2000; 85:65–68.
Article25. Adrian RJ. Particle-imaging techniques for experimental fluid mechanics. Annu Rev Fluid Mech. 1991; 23:261–304.
Article26. Mukdadi OM, Kim HB, Hertzberg J, Shandas R. Numerical modeling of microbubble backscatter to optimize ultrasound particle image velocimetry imaging: initial studies. Ultrasonics. 2004; 42:1111–1121.
Article27. Domenichini F, Querzoli G, Cenedese A, Pedrizzetti G. Combined experimental and numerical analysis of the flow structure into the left ventricle. J Biomech. 2007; 40:1988–1994.
Article28. Sengupta PP, Pedrizetti G, Narula J. Multiplanar visualization of blood flow using echocardiographic particle imaging velocimetry. JACC Cardiovasc Imaging. 2012; 5:566–569.
Article29. Mangual JO, Domenichini F, Pedrizzetti G. Describing the highly three dimensional Right Ventricle flow. Ann Biomed Eng. 2012; 40:1790–1801.
Article30. Son JW, Park WJ, Choi JH, Houle H, Vannan MA, Hong GR, Chung N. Abnormal left ventricular vortex flow patterns in association with left ventricular apical thrombus formation in patients with anterior myocardial infarction: a quantitative analysis by contrast echocardiography. Circ J. 2012; 76:2640–2646.
Article31. Zhang H, Zhang J, Zhu X, Chen L, Liu L, Duan Y, Yu M, Zhou X, Zhu T, Zhu M, Li H. The left ventricular intracavitary vortex during the isovolumic contraction period as detected by vector flow mapping. Echocardiography. 2012; 29:579–587.
Article32. Nogami Y, Ishizu T, Atsumi A, Yamamoto M, Kawamura R, Seo Y, Aonuma K. Abnormal early diastolic intraventricular flow 'kinetic energy index' assessed by vector flow mapping in patients with elevated filling pressure. Eur Heart J Cardiovasc Imaging. 2013; 14:253–260.
Article33. Kheradvar A, Gharib M. On mitral valve dynamics and its connection to early diastolic flow. Ann Biomed Eng. 2009; 37:1–13.
Article34. Belohlavek M. Vortex formation time: an emerging echocardiographic index of left ventricular filling efficiency? Eur Heart J Cardiovasc Imaging. 2012; 13:367–369.
Article35. Kheradvar A, Assadi R, Falahatpisheh A, Sengupta PP. Assessment of transmitral vortex formation in patients with diastolic dysfunction. J Am Soc Echocardiogr. 2012; 25:220–227.
Article36. Poh KK, Lee LC, Shen L, Chong E, Tan YL, Chai P, Yeo TC, Wood MJ. Left ventricular fluid dynamics in heart failure: echocardiographic measurement and utilities of vortex formation time. Eur Heart J Cardiovasc Imaging. 2012; 13:385–393.
Article37. Pedrizzetti G, Domenichini F, Tonti G. On the left ventricular vortex reversal after mitral valve replacement. Ann Biomed Eng. 2010; 38:769–773.
Article38. Cimino S, Pedrizzetti G, Tonti G, Canali E, Petronilli V, De Luca L, Iacoboni C, Agati L. In vivo analysis of intraventricular fluid dynamics in healthy hearts. Eur J Mech. B Fluid. 2012; 35:40–46.39. Nishimura RA, Miller FA Jr, Callahan MJ, Benassi RC, Seward JB, Tajik AJ. Doppler echocardiography: theory, instrumentation, technique, and application. Mayo Clin Proc. 1985; 60:321–343.
Article40. Pop GA, Meeder HJ, Roelandt JR, van Oudenaarden W, Bulens C, Verweij W, Gijsbers C, van Domburg R, Koudstaal PJ. Transthoracic echo/Doppler in the identification of patients with chronic non-valvular atrial fibrillation at risk for thromboembolic events. Eur Heart J. 1994; 15:1545–1551.
Article41. Fyrenius A, Wigström L, Ebbers T, Karlsson M, Engvall J, Bolger AF. Three dimensional flow in the human left atrium. Heart. 2001; 86:448–455.
Article42. Park KH, Son JW, Park WJ, Lee SH, Kim U, Park JS, Shin DG, Kim YJ, Choi JH, Houle H, Vannan MA, Hong GR. Characterization of the left atrial vortex flow by two-dimensional transesophageal contrast echocardiography using particle image velocimetry. Ultrasound Med Biol. 2013; 39:62–71.
Article43. Sengupta PP, Khandheria BK, Korinek J, Jahangir A, Yoshifuku S, Milosevic I, Belohlavek M. Left ventricular isovolumic flow sequence during sinus and paced rhythms: new insights from use of high-resolution Doppler and ultrasonic digital particle imaging velocimetry. J Am Coll Cardiol. 2007; 49:899–908.
Article44. Frydrychowicz A, Harloff A, Jung B, Zaitsev M, Weigang E, Bley TA, Langer M, Hennig J, Markl M. Time-resolved, 3-dimensional magnetic resonance flow analysis at 3 T: visualization of normal and pathological aortic vascular hemodynamics. J Comput Assist Tomogr. 2007; 31:9–15.45. Hope MD, Meadows AK, Hope TA, Ordovas KG, Saloner D, Reddy GP, Alley MT, Higgins CB. Clinical evaluation of aortic coarctation with 4D flow MR imaging. J Magn Reson Imaging. 2010; 31:711–718.
Article
- Full Text Links
-
- Actions
-
Cited
- CITED
-
- Close
- Share
-
- Similar articles
-
- Catheter ablation of outflow tract ventricular arrhythmia with intracardiac echocardiography assistance
- Intracardiac Echocardiography to Guide Biopsy for Two Cases of Intracardiac Masses
- Use of Three-dimensional Transesophageal Echocardiography for the Chiari Network
- Role of Echocardiography in Atrial Fibrillation
- Contrast Echocardiography
