Korean J Physiol Pharmacol.
2010 Dec;14(6):413-417. 10.4196/kjpp.2010.14.6.413.
The Role of the Pattern Edge in Goldfish Visual Motion Detection
- Affiliations
-
- 1Natural Sciences Section, Department of Medical Lifescience, College of Medicine, The Catholic University of Korea, Seoul 137-701, Korea. cjung@catholic.ac.kr
- KMID: 2071714
- DOI: http://doi.org/10.4196/kjpp.2010.14.6.413
Abstract
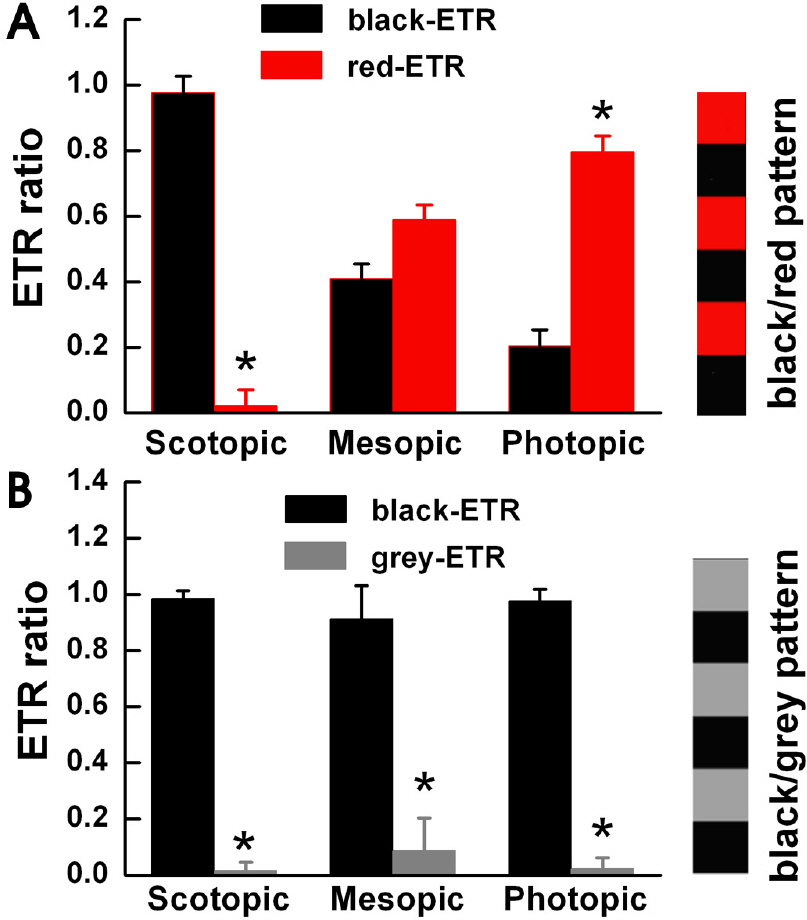
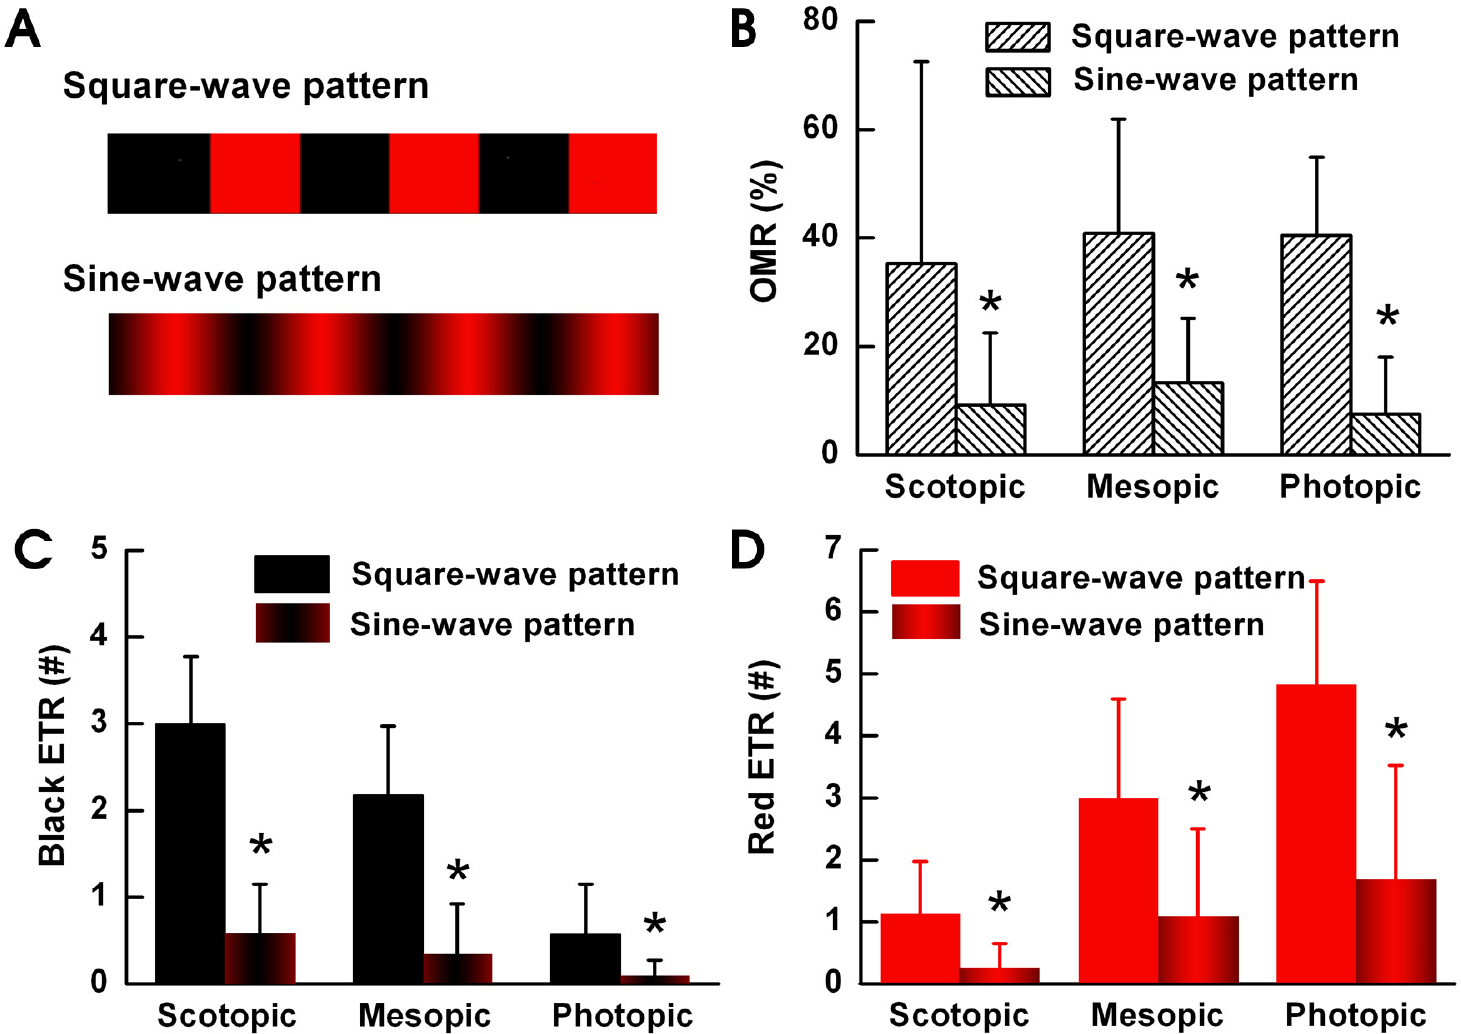
- To understand the function of edges in perception of moving objects, we defined four questions to answer. Is the focus point in visual motion detection of a moving object: (1) the body or the edge of the object, (2) the leading edge or trailing edge of the object, (3) different in scotopic, mesopic and photopic luminance levels, or (4) different for colored objects? We measured the Optomotor Response (OMR) and Edge Triggering Response (ETR) of goldfish. We used a square and sine wave patterns with black and red stripes and a square wave pattern with black and grey stripes to generate OMR's and ETR's in the goldfish. When we used black and red stripes, the black leading edges stimulated an ETR under scotopic conditions, red leading edges stimulated an ETR under photopic conditions, and both black and red leading edges stimulated an ETR under mesopic luminance levels. For black and gray stripes, only black leading edges stimulated an ETR in all three light illumination levels. We observed less OMR and ETR results using the sine wave pattern compared to using the square wave pattern. From these results, we deduced that the goldfish tend to prefer tracking the leading edge of the pattern. The goldfish can also detect the color of the moving pattern under photopic luminance conditions. We decided that ETR is an intriguing factor in OMR, and is suitable as a method of behavioral measurement in visual system research.
Keyword
MeSH Terms
Figure
Cited by 1 articles
-
Gap Junction Contributions to the Goldfish Electroretinogram at the Photopic Illumination Level
Doh-Yeon Kim, Chang-Sub Jung
Korean J Physiol Pharmacol. 2012;16(3):219-224. doi: 10.4196/kjpp.2012.16.3.219.
Reference
-
References
1. Field DJ, Tolhurst DJ. The structure and symmetry of simple-cell receptive-field profiles in the cat's visual cortex. Proc R Soc Lond B Biol Sci. 1986; 228:379–400.2. Hesse GS, Georgeson MA. Edge and bars: Where do people see features in 1-D images? Vision Res. 2005; 45:507–525.3. Kern R, Egelhaaf M, Srinivasan MV. Edge detection by landing honeybees: Behavioural analysis and model simulations of the underlying mechanism. Vision Res. 1997; 37:2103–2117.
Article4. Kulikowski JJ, Abadi R, King-Smith PE. Orientational selectivity of grating and line detectors in human vision. Vision Res. 1973; 13:1479–1486.
Article5. Marr D, Hildreth E. Theory of edge detection. Proc R Soc Lond B Biol Sci. 1980; 207:187–217.6. Morrone MC, Burr DC. Feature detection in human vision: a phase-dependent energy model. Proc R Soc Lond B Biol Sci. 1988; 235:221–245.7. Shapley RM, Tolhurst DJ. Edge detectors in human vision. J Physiol. 1973; 229:165–183.
Article8. Tolhurst DJ. On the possible existence of edge detector neurones in the human visual system. Vision Res. 1972; 12:797–804.
Article9. Enroth-Cugell C, Robson JG. The contrast sensitivity of retinal ganglion cells of the cat. J Physiol. 1966; 187:517–552.
Article10. Goodwin AW, Henry GH, Bishop PO. Direction selectivity of simple striate cells: properties and mechanism. J Neurophysiol. 1975; 38:1500–1523.
Article11. Dreher B, Sanderson KJ. Receptive field analysis: Responses to moving visual contours by single lateral geniculate neurones in the cat. J Physiol. 1973; 234:95–118.
Article12. Cronly-Dillon JR, Muntz WRA. The spectral sensitivity of the goldfish and the clawed toad tadpole under photopic conditions. J Exp Biol. 1965; 42:481–493.
Article13. Schaerer S, Neumeyer C. Motion detection in goldfish investigated with the optomotor response is “color blind”. Vision Res. 1996; 36:4025–4034.
Article14. Hood DC, Finkelstein MA. Sensitivity to light. Boff KR, Kaufman L, Thomas JP, editors. Handbook of Perception and Human Performance. New York: Wiley;1986. p. 5–1–5–66.15. Lee SY, Jung CS. Intraocular injection of muscimol induces illusory motion reversal in goldfish. Korean J Physiol Pharmacol. 2009; 13:469–473.
Article16. Anstis S, Hutahajan P, Cavanagh P. Optomotor test for wavelength sensitivity in Guppyfish (Poecilia reticylata). Vision Res. 1998; 38:45–53.17. Faber DS, Fetcho JR, Korn H. Neuronal networks underlying the escape response in goldfish. General implications for motor control. Ann NY Acad Sci. 1989; 563:11–33.
- Full Text Links
- Actions
-
Cited
- CITED
-
- Close
- Share
- Similar articles
-
- Intraocular Injection of Muscimol Induces Illusory Motion Reversal in Goldfish
- Effects of taurine on cadmium exposure in muscle, gill, and bone tissues of Carassius auratus
- Two Types of Voltage-activated Calcium Currents in Goldfish Horizontal Cells
- Clinical Evaluation of Arnblyopic Eyes with Eccentric Fixation
- Seven cases of normal-tension glaucoma with temporal visual field defect only


