Mannitol-induced Metabolic Alkalosis
- Affiliations
-
- 1Department of Internal Medicine, Research Institute of Clinical Medicine, Chonbuk National University Medical School, Chonbuk, Korea. hope@chonbuk.ac.kr
- KMID: 2052272
- DOI: http://doi.org/10.5049/EBP.2006.4.2.61
Abstract
- Mannitol is an osmotic diuretic agent useful in a variety of clinical conditions. This study is based on acid-base and electrolyte changes seen after the intravenous infusion of hypertonic mannitol for the prevention of cerebral edema. The study subjects were divided into 3 groups: for group A, an amount of 300-900 mL 15% mannitol was intravenously infused over the period of 60 to 90 minutes; for group B, 1,200-2,600 mL over 12 to 24 hours; and for group C, 3,200-4,900 mL over more than 24 hours. In group A, blood pH is increased from 7.43+/-0.07 to 7.46+/-0.04, and plasma HCO3- from 25.3+/-2.1 to 28.9+/-2.9 mEq/L, but plasma K+ is decreased from 4.3+/-0.6 to 3.7+/-0.8 mEq/L. In group B, blood pH is increased from 7.42+/-0.02 to 7.47+/-0.06, and plasma HCO3- from 25.2+/-1.8 to 29.1+/-2.9 mEq/L, but plasma K+ is decreased from 4.2+/-0.3 to 3.8+/-0.5 mEq/L. In group C, blood pH is increased from 7.41+/-0.01 to 7.52+/-0.04, and plasma HCO3- from 24.9+/-1.2 to 27.7+/-2.5 mEq/L, but plasma K+ is decreased from 4.2+/-0.1 to 3.9+/-0.2 mEq/L. These results showed that intravenous infusion of mannitol could induce metabolic alkalosis and hypokalemia, regardless of its dose. The mannitol induced metabolic alkalosis may be due to increased renal HCO3- production.
MeSH Terms
Figure
-
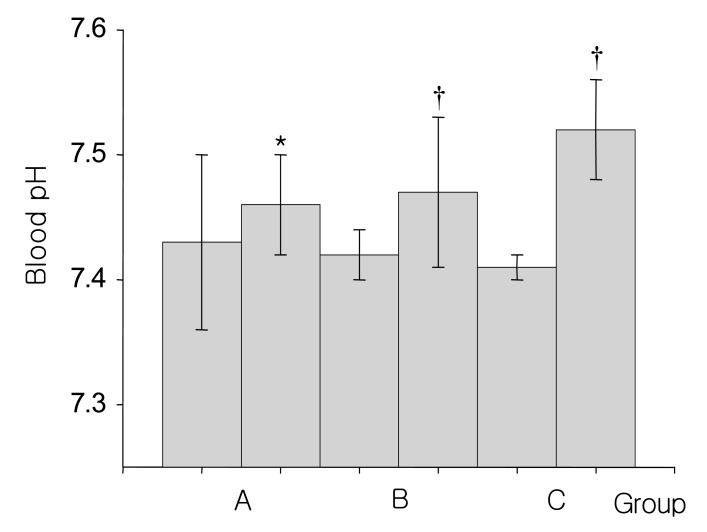
Fig. 1 Changes of blood pH before and after 15% mannitol infusion for 60-90 minutes (A group), 12-24 hours (B group) and over 24 hours (C group). *p<0.01, †p<0.05 differing from the baseline values
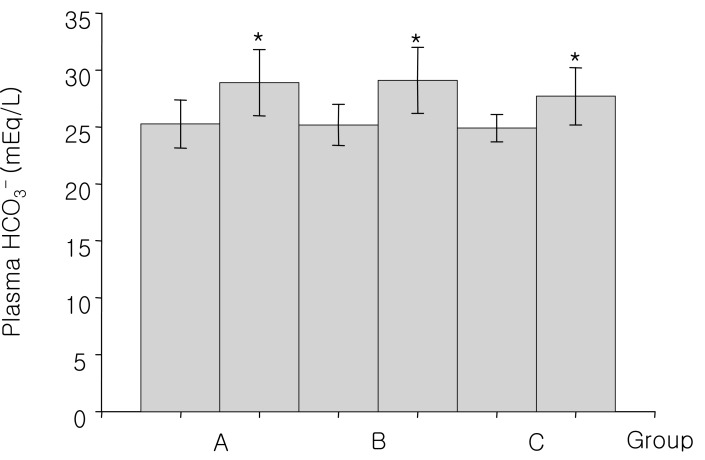
Fig. 2 Changes of plasma HCO3- concentration before and after 15% mannitol infusion for 60-90 minutes (A group), 12-24 hours (B group) and over 24 hours (C group). *p<0.01, differing from the baseline values
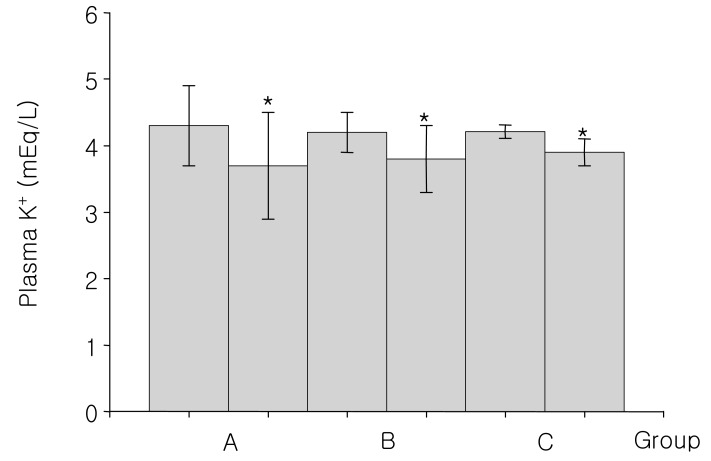
Fig. 3 Changes of plasma potassium concentration before and after 15% mannitol infusion for 60-90 minutes (A group), 12-24 hours (B group) and over 24 hours (C group). *p<0.01, differing from the baseline values.
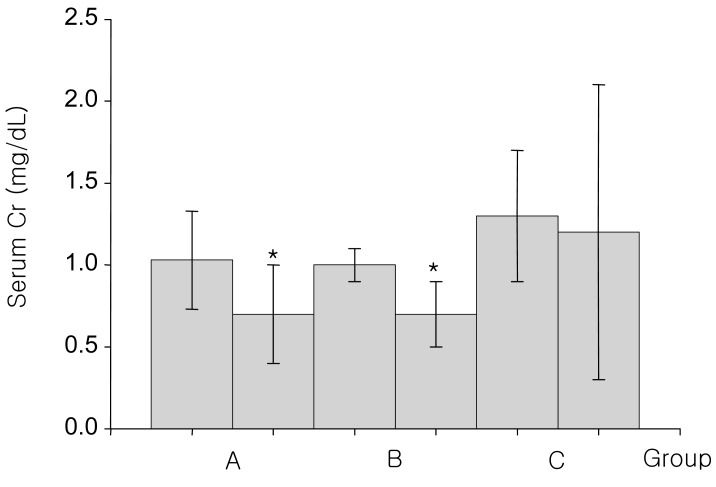
Fig. 4 Changes of serum creatinine concentration before and after 15% mannitol infusion for 60-90 minutes (A group), 12-24 hours (B group) and over 24 hours (C group). *p<0.01, differing from the baseline values
Reference
-
1. Hodgkin JE, Soeprono FF, Chan DM. Incidence of metabolic alkalemia in hospitalized patients. Crit Care Med. 1980; 8:725–732. PMID: 6778655.
Article2. Rose BD, Post TW. Metabolic alkalosis. Clinical physiology of acid-base and electrolyte disorders 5th ed., International Edition. 2001. Singapore: McGraw-Hill;p. 551–577.3. Anderson LE, Henrich WL. Alkalemia-associated morbidity and mortality in medical and surgical patients. South Med J. 1987; 80:729–733. PMID: 3589765.
Article4. Nissenson AR, Weston RE, Kleeman CR. Mannitol. West J Med. 1979; 131:277–284. PMID: 388867.5. Wise BL. Effects of infusion of hypertonic mannitol on electrolyte balance and osmolarity of serum and cerebrospinal fluid. J Neurosurg. 1964; 20:961–967. PMID: 14186098.
- Full Text Links
-
- Actions
-
Cited
- CITED
-
- Close
- Share
-
- Similar articles
-
- Mannitol-Induced Metabolic Alkalosis
- Metabolic alkalosis induced by plasmapheresis in a patient with systemic lupus erythematosus
- Effects of Acid-Base Balance on the Isolated Rabbit Vascular Tone
- Mannitol induced acute oliguric renal failure
- Analysis of Laboratory Data on Induced Hypotension with Trimetaphan for Cerebral Aneurysm Surgery
