Focal Liver Lesion Detection in Gadoxetic Acid-enhanced Liver MRI: Effects of Scan Delay, Hepatic Function, and Magnetic Field Strength
- Affiliations
-
- 1Department of Diagnostic Radiology and Institution of Radiological Science, Severance Hospital, Yonsei University College of Medicine, Seoul, South Korea. kimnex@yuhs.ac
- 2Department of Diagnostic Radiology, Gangnam Severance Hospital, Yonsei University College of Medicine, Seoul, South Korea.
- KMID: 2000051
- DOI: http://doi.org/10.13104/jksmrm.2011.15.3.226
Abstract
- PURPOSE
To determine the effects of scan delay, hepatic function, and magnetic field strength on the performance of gadoxetic acid enhanced magnetic resonance imaging.
MATERIALS AND METHODS
Gadoxetic acid enhanced MRI conducted in 72 patients with 10 minutes and 20 minutes delay were reviewed retrospectively. For quantitative analysis, liver-to-lesion signal difference ratio (SDR) was measured and compared according to scan delay time, hepatic function and magnetic field strength. For qualitative analysis, two board-certificated radiologists reviewed 10-minute delay and 20-minute delay images. The sensitivity and specificity of each reader was compared.
RESULTS
The SDR of 20-minute images in non-cirrhotic patients was significantly higher (p < 0.01) than that of 10-minute delay images. However, in cirrhotic patients, it was comparable (p > 0.05) to 10-min delay images. In comparisons according to the magnetic strength, there was no significant difference between 1.5-T and 3.0-T systems. Comparisons of ROC curves showed no statistically significant differences in sensitivity and specificity between 10-minute and 20-minute delay images.
CONCLUSION
An increase in the liver-to-lesion signal difference ratio was dependent on the patients' hepatic function but not dependent on the magnetic strength. There was no significant difference in sensitivity or specificity between the 10-minute and 20-minute delay images.
MeSH Terms
Figure
-

Fig. 1 An example of the ROI measurement 1) Liver: ROI on the right lobe posterior segment with minimum area of 100 mm2 2) Lesion: minimum ROI area of 50 mm2, avoiding necrotic areas 3) Background noise signal: ROI on right anterior quadrant in oval shape with minimum ROI of 400 mm2 4) Spleen: minimum ROI area of 200 mm2
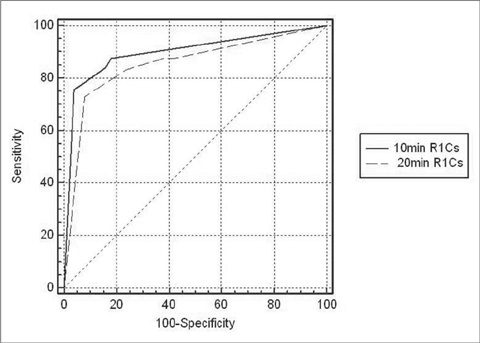
Fig. 2 ROC curve of Reader 1 There is no significant difference in sensitivity and specificity between 10-minute and 20-minute delay images (p = 0.117).
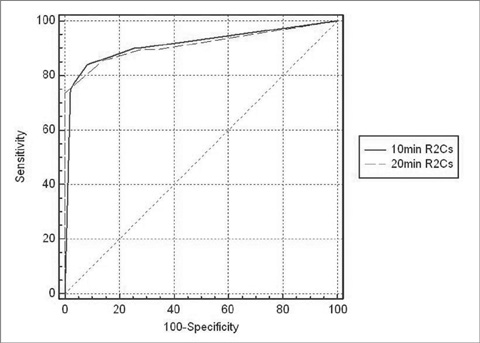
Fig. 3 ROC curve of Reader 2 There is no significant difference in sensitivity and specificity between 10-minute and 20-minute delay images (p = 0.936).

Fig. 4 Liver-to-Lesion Signal Difference Ratio (SDR): cirrhosis vs. non-cirrhosis Shown is a summary plot based on the median, quartiles, and extreme values. The box represents the interquartile range which contains 50% of all values. The whiskers extend from the box to the highest and lowest values, excluding outliers. A line across the box indicates the median. The SDRs of 20-min images are significantly higher than those of 10-min images in non-cirrhotic patients, but the difference is not significant in cirrhotic patients. There is no significant difference between non-cirrhotic and cirrhotic patients for each value. The mean SDRs for 10- and 20-min delay images are significantly higher compared to those of precontrast images in both non-cirrhotic and cirrhotic patients.

Fig. 5 Liver-to-Lesion Signal Difference Ratio (SDR): 1.5-T vs. 3.0-T There was a significant difference in all comparisons of SDRs of precontrast, 10-min, and 20-min delay images from both systems. However, there was no significant difference between the 1.5-T and 3-T systems for each variable.
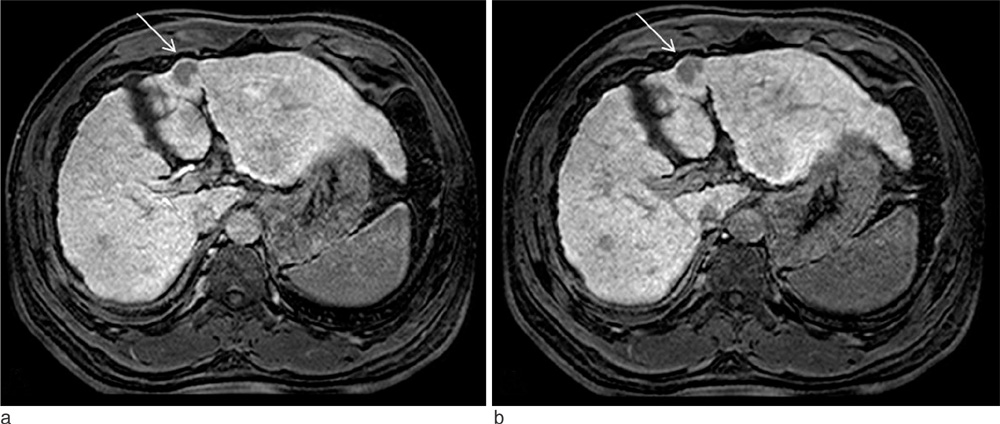
Fig. 6 A 77-year-old male with hepatic dysfunction The liver shows features of advanced cirrhosis including a nodular liver surface and right lobe atrophy. The patient was diagnosed with hepatocellular carcinoma (white arrows). There was no definite increase in the liver parenchymal enhancement and the SDR measured was 0.43 on a 10-minute delay image (a) and 0.49 on the 20-minute delay image (b).
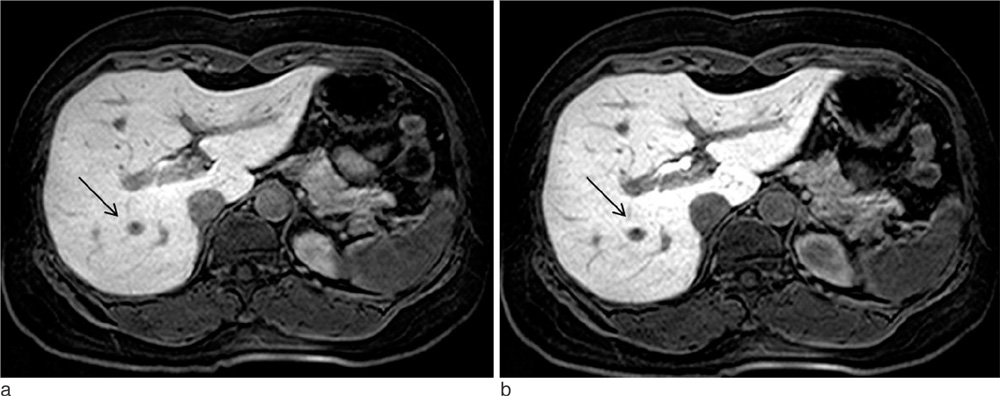
Fig. 7 A 59-year-old female without hepatic dysfunction There is a cyst on liver segment 6 (black arrows). The 20-minute delay image (b) shows increased hepatic parenchymal enhancement compared to the 10-minute delay image (a). SDR was calculated to be 0.57 on the 10-minute delay image and 0.68 on the 20-minute delay image.
Reference
-
1. Weinmann HJ, Schuhmann-Giampieri G, Schmitt-Willich H, Vogler H, Frenzel T, Gries H. A new lipophilic gadolinium chelate as a tissue-specific contrast medium for MRI. Magn Reson Med. 1991. 22:233–237. discussion 242.2. Schuhmann-Giampieri G, Schmitt-Willich H, Press WR, Negishi C, Weinmann HJ, Speck U. Preclinical evaluation of Gd-EOB-DTPA as a contrast agent in MR imaging of the hepatobiliary system. Radiology. 1992. 183:59–64.3. Schuhmann-Giampieri G, Mahler M, Roll G, Maibauer R, Schmitz S. Pharmacokinetics of the liver-specific contrast agent Gd-EOB-DTPA in relation to contrast-enhanced liver imaging in humans. J Clin Pharmacol. 1997. 37:587–596.4. Muhler A, Weinmann HJ. Biodistribution and excretion of 153Gd-labeled gadolinium ethoxybenzyl diethylenetriamine pentaacetic acid following repeated intravenous administration to rats. Acad Radiol. 1995. 2:313–318.5. Clement O, Muhler A, Vexler V, Berthezene Y, Brasch RC. Gadolinium-ethoxybenzyl-DTPA, a new liver-specific magnetic resonance contrast agent. Kinetic and enhancement patterns in normal and cholestatic rats. Invest Radiol. 1992. 27:612–619.6. Ryeom HK, Kim SH, Kim JY, et al. Quantitative evaluation of liver function with MRI Using Gd-EOB-DTPA. Korean J Radiol. 2004. 5:231–239.7. Tschirch FT, Struwe A, Petrowsky H, Kakales I, Marincek B, Weishaupt D. Contrast-enhanced MR cholangiography with Gd-EOB-DTPA in patients with liver cirrhosis: visualization of the biliary ducts in comparison with patients with normal liver parenchyma. Eur Radiol. 2008. 18:1577–1586.8. Yamada A, Hara T, Li F, et al. Quantitative evaluation of liver function with use of gadoxetate disodium-enhanced MR imaging. Radiology. 2011. 260:727–733.9. Sofue K, Tsurusaki M, Tokue H, Arai Y, Sugimura K. Gd-EOB-DTPA-enhanced 3.0 T MR imaging: quantitative and qualitative comparison of hepatocyte-phase images obtained 10 min and 20 min after injection for the detection of liver metastases from colorectal carcinoma. Eur Radiol. 2011. 21:2336–2343.10. Tamada T, Ito K, Higaki A, et al. Gd-EOB-DTPA-enhanced MR imaging: Evaluation of hepatic enhancement effects in normal and cirrhotic livers. Eur J Radiol. 2011. 80:e311–e316.11. Tamada T, Ito K, Sone T, Kanki A, Sato T, Higashi H. Gd-EOB-DTPA enhanced MR imaging: Evaluation of biliary and renal excretion in normal and cirrhotic livers. Eur J Radiol. 2011. 80:e207–e211.12. Hamm B, Staks T, Muhler A, et al. Phase I clinical evaluation of Gd-EOB-DTPA as a hepatobiliary MR contrast agent: safety, pharmacokinetics, and MR imaging. Radiology. 1995. 195:785–792.13. Abe Y, Fujii K, Nagata N, et al. The Toll-like receptor 3-mediated antiviral response is important for protection against poliovirus infection in poliovirus receptor transgenic mice. J Virol. 2011.14. Iwasaki H, Takeuchi O, Teraguchi S, et al. The IkappaB kinase complex regulates the stability of cytokine-encoding mRNA induced by TLR-IL-1R by controlling degradation of regnase-1. Nat Immunol. 2011. 12(12):1167–1175.
- Full Text Links
-
- Actions
-
Cited
- CITED
-
- Close
- Share
-
- Similar articles
-
- Hepatic Angiomyolipoma Presenting as a Hyperintense Lesion During the Hepatobiliary Phase of Gadoxetic Acid Enhanced-MRI: a Case Report
- Gadoxetic acid-enhanced magnetic resonance imaging: Hepatocellular carcinoma and mimickers
- Evaluation and Prediction of Post-Hepatectomy Liver Failure Using Imaging Techniques: Value of Gadoxetic Acid-Enhanced Magnetic Resonance Imaging
- The MR imaging diagnosis of liver diseases using gadoxetic acid: Emphasis on hepatobiliary phase
- Diagnosis of Hepatocellular Carcinoma with Gadoxetic Acid-Enhanced MRI: 2016 Consensus Recommendations of the Korean Society of Abdominal Radiology
