Quantitative Analysis of Intraoperative Indocyanine Green Video Angiography in Aneurysm Surgery
- Affiliations
-
- 1Department of Neurosurgery, Seoul National University Boramae Hospital, Republic of Korea. nsyang@brm.co.kr
- 2Department of Neurosurgery, Seoul National University College of Medicine, Seoul, Republic of Korea.
- KMID: 1980433
- DOI: http://doi.org/10.7461/jcen.2013.15.2.76
Abstract
OBJECTIVE
Indocyanine green (ICG) videoangiography (VA) is being used in assessment of blood flow during cerebrovascular surgery. However, data collected during ICG angiography are usually interpreted qualitatively. In this study, quantitative analysis of ICG angiogram was attempted.
MATERIALS AND METHODS
ICG VA, performed during aneurysm surgery was analyzed retrospectively. The angiogram was captured serially in regular time interval. The stacked images were then fed into an image analysis program, ImageJ. The selected areas of interest were as follows: parent and branch vessels, and dome of aneurysm. Changes of signals of measurement points were plotted. The time to peak, washout time, and the peak intensity between areas were compared.
RESULTS
Among the 16 cases enrolled in this study, five cases were anterior communicating artery aneurysms, and 11 cases were middle cerebral artery bifurcation aneurysms. There was no signal intensity of aneurysm dome in our series. No difference in time to peak or maximum signal intensity was observed between vessels in each case. The average time to peak was 9.0 and washout time was 31.3 seconds. No significant difference in time profile was observed between anterior communicating artery aneurysms and middle cerebral artery bifurcation aneurysms.
CONCLUSION
Findings of this study demonstrate that quantitative analysis is possible using a personal computer and common video capture and analysis software. It can be a good adjunctive to evaluation of vascular status during aneurysm surgery. It displays time profiles of multiple points of interest over time, and is helpful in objective evaluation of changes of blood flow over time. It might be helpful in various fields of cerebrovascular surgery.
MeSH Terms
Figure
-
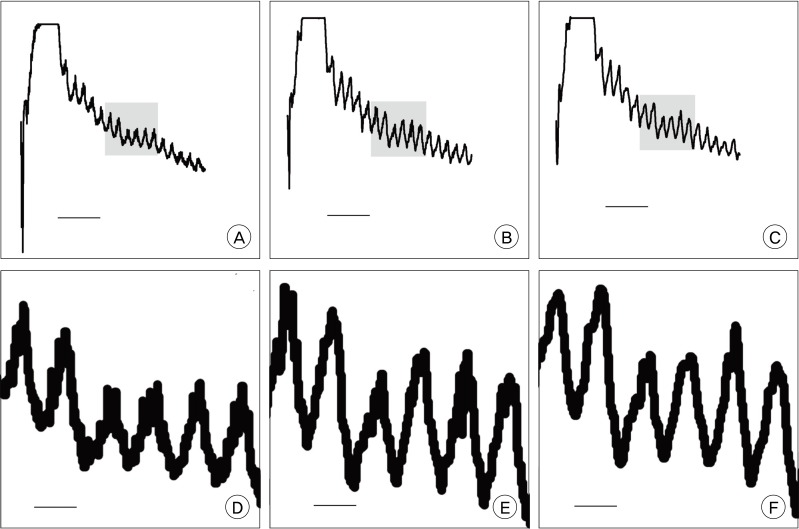
Fig. 1 Comparison of graph details according to sampling interval. A, D are made in 0.1 seconds; B, E in 0.2 seconds; C, F in 0.4 seconds. The waves in the lower row (D, E, and F) are five times magnified view of a part of waves, shaded area, in the upper row (A, B, and C). It is notable that there is some loss of detail in the 0.4 second interval compared to 0.1 and 0.2 second intervals (F). The horizontal bar in A, B, and C is 10 seconds, in D, E, and F is 2 seconds.
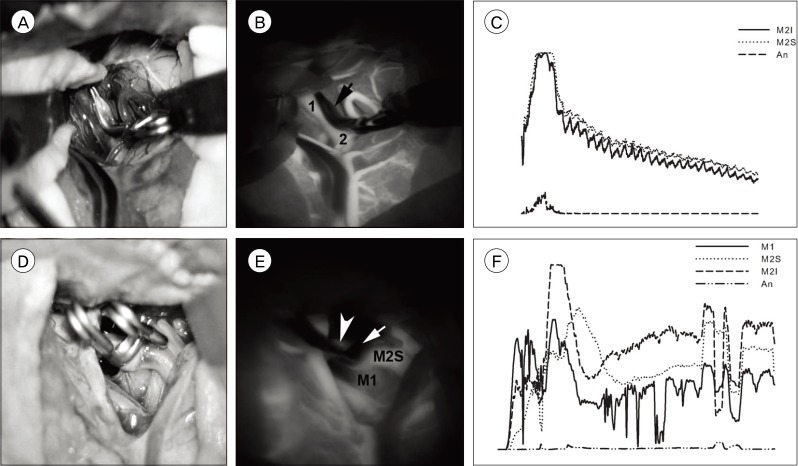
Fig. 2 Example of good data quality (A, B, and C) and of poor quality (D, E, and F). A and D are photographs of operative fields, B and E are averaged images of serial captures of indocyanine green (ICG) videoangiography (VA), C and F are graphs. There is no blurring of contours of structures in B (1: M2 inferior division, 2: M2 superior division, arrow: aneurysm) whereas E shows blurring due to panning of the field during recording (M1: middle cerebral artery main trunk proximal to bifurcation, M2S: superior division of M2, Arrowhead: inferior division of M2, arrow: aneurysm). C (M2I: inferior division of M2, M2S: superior division of M2, An: aneurysm) shows good waveforms, compared to waves in F (M1: middle cerebral artery main trunk proximal to bifurcation, M2S: superior division of M2, M2I: inferior division of M2, An: aneurysm).
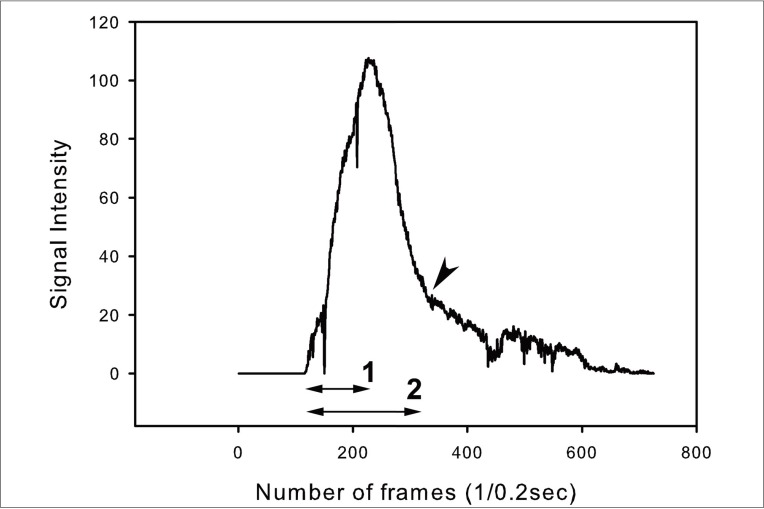
Fig. 3 Time profile of wave. 1: time to peak, 2: washout time. Arrowhead marks the point of transition of the curve. In this case, time to peak is 24.0 seconds, washout time 44.0.
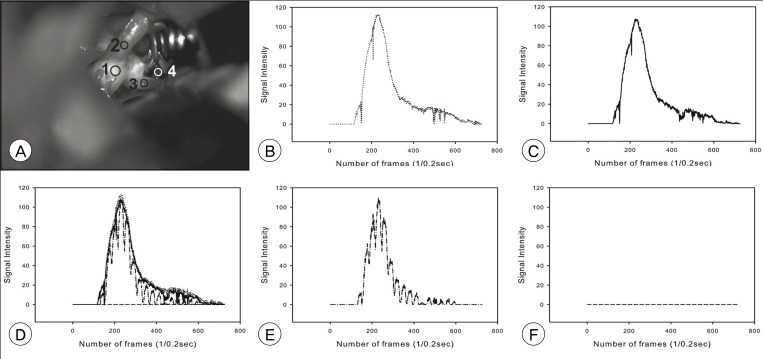
Fig. 4 A case of an anterior communicating artery aneurysm. A is a photograph of the operative field. B to F are graphs of measurement depicted in A. B is a graph of point 1 (A1); C, point 2 (ipsilateral A1); E, point 3 (contralateral A2); F, point 4 (aneurysm). D is combined graphs B, C, E, and F. There is no difference in time profile between vessels, whereas no definite signal intensity at the aneurysm.
Cited by 2 articles
-
Intravenous Fluid Selection for Unruptured Intracranial Aneurysm Clipping : Balanced Crystalloid versus Normal Saline
Jian Kang, Young Joo Song, Sujeong Jeon, Junghwa Lee, Eunsook Lee, Ju-Yeun Lee, Euni Lee, Jae Seung Bang, Si Un Lee, Moon-Ku Han, Chang Wan Oh, Tackeun Kim
J Korean Neurosurg Soc. 2021;64(4):534-542. doi: 10.3340/jkns.2020.0262.Numerical Model for Cerebrovascular Hemodynamics with Indocyanine Green Fluorescence Videoangiography
Hwayeong Cheon, Young-Je Son, Sung Bae Park, Pyoung-Seop Shim, Joo-Hiuk Son, Hee-Jin Yang
J Korean Neurosurg Soc. 2023;66(4):382-392. doi: 10.3340/jkns.2022.0180.
Reference
-
1. Awano T, Sakatani K, Yokose N, Kondo Y, Igarashi T, Hoshino T, et al. Intraoperative EC-IC bypass blood flow assessment with indocyanine green angiography in moyamoya and non-moyamoya ischemic stroke. World Neurosurg. 2010; 6. 73(6):668–674. PMID: 20934154.
Article2. Chen SF, Kato Y, Oda J, Kumar A, Watabe T, Imizu S, et al. The application of intraoperative near-infrared indocyanine green videoangiography and analysis of fluorescence intensity in cerebrovascular surgery. Surg Neurol Int. 2011; 3. 2:42. PMID: 21541008.
Article3. Cherrick GR, Stein SW, Leevy CM, Davidson CS. Indocyanine green: observations on its physical properties, plasma decay, and hepatic extraction. J Clin Invest. 1960; 4. 39:592–600. PMID: 13809697.
Article4. Dashti R, Laakso A, Niemela M, Porras M, Celik O, Navratil O, et al. Application of microscope integrated indocyanine green video-angiography during microneurosurgical treatment of intracranial aneurysms: A review. Acta Neurochir Suppl. 2010; 107:107–109. PMID: 19953380.
Article5. de Oliveira JG, Beck J, Seifert V, Teixeira MJ, Raabe A. Assessment of flow in perforating arteries during intracranial aneurysm surgery using intraoperative near-infrared indocyanine green videoangiography. Neurosurgery. 2007; 9. 61(3 Suppl):63–72. discussion 72-3. PMID: 17876226.
Article6. Detter C, Wipper S, Russ D, Iffland A, Burdorf L, Thein E, et al. Fluorescent cardiac imaging: a novel intraoperative method for quantitative assessment of myocardial perfusion during graded coronary artery stenosis. Circulation. 2007; 8. 116(9):1007–1014. PMID: 17684152.7. Fischer G, Stadie A, Oertel JM. Near-infrared indocyanine green videoangiography versus microvascular Doppler sonography in aneurysm surgery. Acta Neurochir (Wien). 2010; 9. 152(9):1519–1525. PMID: 20623360.
Article8. Hanggi D, Etminan N, Steiger HJ. The impact of microscope-integrated intraoperative near-infrared indocyanine green videoangiography on surgery of arteriovenous malformations and dural arteriovenous fistulae. Neurosurgery. 2010; 10. 67(4):1094–1103. discussion 1103-4. PMID: 20881574.9. Hope-Ross M, Yannuzzi LA, Gragoudas ES, Guyer DR, Slakter JS, Sorenson JA, et al. Adverse reactions due to indocyanine green. Ophthalmology. 1994; 3. 101(3):529–533. PMID: 8127574.
Article10. Lee CH, Jung YS, Yang HJ, Son YJ, Lee SH. An innovative method for detecting surgical errors using indocyanine green angiography during carotid endarterectomy: a preliminary investigation. Acta Neurochir (Wien). 2012; 1. 154(1):67–73. PMID: 22068716.
Article11. Lee JC, Jang KS, Jang DK, Han YM, Park SK, Yun WS, et al. Analysis of incomplete occlusion of cerebral aneurysm by intraoperative indocyanine green videoangiography. Korean J Cerebrovasc Surg. 2010; 9. 12(3):206–212.12. Matsui A, Lee BT, Winer JH, Laurence RG, Frangioni JV. Quantitative assessment of perfusion and vascular compromise in perforator flaps using a near-infrared fluorescence-guided imaging system. Plast Reconstr Surg. 2009; 8. 124(2):451–460. PMID: 19644259.
Article13. Mothes H, Dinkelaker T, Donicke T, Friedel R, Hofmann GO, Bach O. Outcome prediction in microsurgery by quantitative evaluation of perfusion using ICG fluorescence angiography. J Hand Surg Eur Vol. 2009; 4. 34(2):238–246. PMID: 19369300.
Article14. Oda J, Kato Y, Chen SF, Sodhiya P, Watabe T, Imizu S, et al. Intraoperative near-infrared indocyanine green-videoangiography (ICG-VA) and graphic analysis of fluorescence intensity in cerebral aneurysm surgery. J Clin Neurosci. 2011; 8. 18(8):1097–1100. PMID: 21715173.
Article15. Raabe A, Beck J, Gerlach R, Zimmermann M, Seifert V. Near-infrared indocyanine green video angiography: a new method for intraoperative assessment of vascular flow. Neurosurgery. 2003; 1. 52(1):132–139. discussion 139. PMID: 12493110.
Article16. Schuette AJ, Cawley CM, Barrow DL. Indocyanine green videoangiography in the management of dural arteriovenous fistulae. Neurosurgery. 2010; 9. 67(3):658–662. discussion 662. PMID: 20647967.
Article
- Full Text Links
-
- Actions
-
Cited
- CITED
-
- Close
- Share
-
- Similar articles
-
- Value of Indocyanine Green Videoangiography in Deciding the Completeness of Cerebrovascular Surgery
- Indocyanine green angiography of retinal astrocytomas associated with tuberous sclerosis
- Indocyanine Green-Guided Video-Assisted Thoracoscopic Surgery for Resection of an Ectopic Mediastinal Parathyroid Adenoma
- Indocyanine Green Videoangiography for Confirmation of Bypass Graft Patency
- Utility of Indocyanine Green Fluorescence Imaging in Wound Assessment
