Development of a Poikilocyte Measuring Method Using Image Analysis Software
- Affiliations
-
- 1Department of Laboratory Medicine, Hanyang University Hospital, Seoul, Korea. wslee@hanyang.ac.kr
- KMID: 1845390
- DOI: http://doi.org/10.3343/lmo.2013.3.1.6
Abstract
- BACKGROUND
To achieve consistency in poikilocytes grading in peripheral blood cell examinations, we made an image-based differential count (IDC) software to measure the degree of abnormalities in individual red blood cells (RBCs) and relative fractions of poikilocytes.
METHODS
Thirty peripheral blood samples were analyzed. Smear slides were examined on a microscope with charge-coupled device (CCD) camera. To verify this program, we compared the IDC results with the results of manual differential counting (MDC). Relative fractions of schistocytes, echinocytes, and elliptocytes were measured by IDC and MDC. The error rate of IDC was measured by confirming the final processed images of IDC. Correlations of IDC and MDC results were compared using linear regression analysis and the time required for each test was measured. For presentation of the mathematical decision criteria of poikilocytes, IDC algorithms for recognizing schistocytes, echinocytes, and elliptocytes were made using simple geometrical or mathematical formulas.
RESULTS
The error rate of IDC was 2.8%. For analysis of 1,000 RBCs, MDC took 7.3 minutes and IDC took 2.7 minutes. Linear regression coefficients were 0.776 (P<0.001) for schistocytes, 0.895 (P<0.001) for echinocytes, and 1.001 (P<0.001) for elliptocytes.
CONCLUSIONS
It was possible to define poikilocytes with geometrical or mathematical formulas using image analysis programs. The IDC program would be helpful for consistent grading of poikilocytes.
Keyword
MeSH Terms
Figure
-

Fig. 1 The main algorithm of red cell morphology analysis (Wright stain, ×400). (A) Original image of peripheral blood smear. (B) Color adjusted image. (C) Background separated image. (D) Cell boundary recognition and cell separation. (E) Morphology data collection. (F) Poikilocytes recognition.
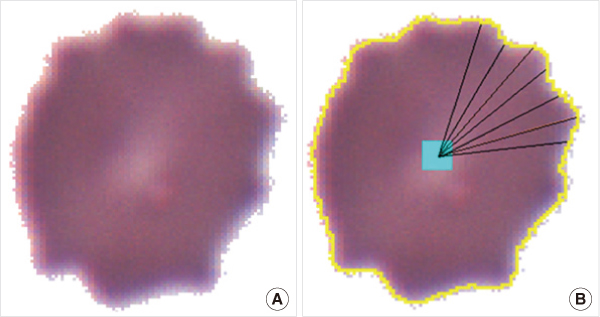
Fig. 2 The echinocyte recognizing algorithm (Wright stain, ×400). (A) Background separated image. (B) Echinocyte recognition. Acute angles of AOB, BOC, COD, DOE, EOF, FOG are 10°. c1=BO-CO. c2=CO-DO. If c1×c2 is smaller than 0 and absolute value of c2 is 1.2 or more than the point C is a pike. If total number of pikes is 5 or more, then the RBC is recognized as an echinocyte.

Fig. 3 The schistocyte recognizing algorithm (Wright stain, ×400). (A) Original image. (B) Color adjusted image. (C) Background separated image. (D) A bead (yellow circle) is moving from left to right. (E) Pixels of a RBC (red color) were erased by the bead. (F) The remaining area of this RBC (purple color) is the schistocyte value. If schistocyte value is larger than 70, then the RBC is recognized as a schistocyte.

Fig. 4 Correlations of manual differential counting (MDC) and image-based differential counting (IDC) for schistocytes, echinocytes, and elliptocytes (all P-values were <0.001).

Fig. 5 Errors of image-based differential counting (Wright stain, ×400). (A) Recognizing an echinocyte as a schistocyte. (B) Recognizing echinocytes as normal red blood cells. The poor focusing makes protrusions of echinocytes smaller. (C) Recognizing a normal red blood cell as an echinocyte. Poor background image separations transform normal red blood cells into echinocytes. (D) Recognizing two normal red blood cells as an elliptocyte. Cell-to-cell image separation failures increase the fraction of elliptocytes (X, schistocyte; ■, echinocyte; -, elliptocyte; +, normal red blood cell; yellow line, outline of blood cells; black line, separating line of attached blood cells).
Reference
-
1. Bull BS. Lichtman MA, editor. Morphology of the erythron. Williams hematology. 2006. 7th ed. New York: McGraw-Hill;377–382.2. Hyun BH, Gulati GL, Ashton JK. Differential leukocyte count: manual or automated, what should it be? Yonsei Med J. 1991. 32:283–291.
Article3. Gulati GL, editor. Blood cell morphology grading guide. 2009. 1st ed. Chicago: American Society of Clinical Pathology Press;1–33.4. Briggs C, Longair I, Slavik M, Thwaite K, Mills R, Thavaraja V, et al. Can automated blood film analysis replace the manual differential? An evaluation of the CellaVision DM96 automated image analysis system. Int J Lab Hematol. 2009. 31:48–60.
Article5. Rümke CL. The imprecision of the ratio of two percentages observed in differential white blood cell counts: a warning. Blood Cells. 1985. 11:137–140.6. Beucher S. Watersheds of functions and picture segmentation. Proc IEEE Int Conf Acoust Speech Signal Process. 1982. 7:1928–1931.
Article7. Ceelie H, Dinkelaar RB, Van Gelder W. Examination of peripheral blood films using automated microscopy; evaluation of Diffmaster Octavia and Cellavision DM96. J Clin Pathol. 2007. 60:72–79.
Article8. Lesesve JF, Salignac S, Alla F, Defente M, Benbih M, Bordigoni P, et al. Comparative evaluation of schistocyte counting by an automated method and by microscopic determination. Am J Clin Pathol. 2004. 121:739–745.
Article9. Sir JU, Kim TY. A new digital image processing technique for mixed pattern analysis of anti-neutrophil cytoplasmic antibody test. J Korean Rheum Assoc. 2004. 11:333–341.
- Full Text Links
-
- Actions
-
Cited
- CITED
-
- Close
- Share
-
- Similar articles
-
- Accuracy of the Point-Based Image Registration Method in Integrating Radiographic and Optical Scan Images: A Pilot Study
- Development of an Analytic Software Using Pencil Beam Scanning Proton Beam
- Digital X-ray Imaging in Dentistry
- Development of Pupillography Using Image Processing
- Mammography with a fully automated breast volumetric software as a novel method for estimating the preoperative breast volume prior to mastectomy
