Effect of Heart Rate and Body Mass Index on the Interscan and Interobserver Variability of Coronary Artery Calcium Scoring at Prospective ECG-Triggered 64-Slice CT
- Affiliations
-
- 1Department of Clinical Radiology, Hiroshima University Hospital, Hiroshima, 734-8551, Japan. horiguch@hiroshima-u.ac.jp
- 2Department of Radiology, Division of Medical Intelligence and Informatics, Programs for Applied Biomedicine, Graduate School of Biomedical Sciences, Hiroshima University, Hiroshima, 734-8551, Japan.
- 3Department of Molecular and Internal Medicine, Division of Clinical Medical Science, Programs for Applied Biomedicine, Graduate School of Biomedical Sciences, Hiroshima University, Hiroshima, 734-8551, Japan.
- KMID: 1777261
- DOI: http://doi.org/10.3348/kjr.2009.10.4.340
Abstract
OBJECTIVE
To test the effects of heart rate, body mass index (BMI) and noise level on interscan and interobserver variability of coronary artery calcium (CAC) scoring on a prospective electrocardiogram (ECG)-triggered 64-slice CT.
MATERIALS AND METHODS
One hundred and ten patients (76 patients with CAC) were scanned twice on prospective ECG-triggered scans. The scan parameters included 120 kV, 82 mAs, a 2.5 mm thickness, and an acquisition center at 45% of the RR interval. The interscan and interobserver variability on the CAC scores (Agatston, volume, and mass) was calculated. The factors affecting the variability were determined by plotting it against heart rate, BMI, and noise level (defined as the standard deviation: SD).
RESULTS
The estimated effective dose was 1.5 +/- 0.2 mSv. The mean heart rate was 63 +/- 12 bpm (range, 44-101 bpm). The patient BMIs were 24.5 +/- 4.5 kg/m2 (range, 15.5-42.3 kg/m2). The mean and median interscan variabilities were 11% and 6%, respectively by volume, and 11% and 6%, respectively, by mass. Moreover, the mean and median of the algorithms were lower than the Agatston algorithm (16% and 9%, respectively). The mean and median interobserver variability was 10% and 4%, respectively (average of algorithms). The mean noise levels were 15 +/- 4 Hounsfield unit (HU) (range, 8-25 HU). The interscan and interobserver variability was not correlated with heart rate, BMI, or noise level.
CONCLUSION
The interscan and interobserver variability of CAC on a prospective ECG-triggered 64-slice CT with high image quality and 45% of RR acquisition is not significantly affected by heart rate, BMI, or noise level. The volume or mass algorithms show reduced interscan variability compared to the Agatston scoring (p < 0.05).
MeSH Terms
Figure
-
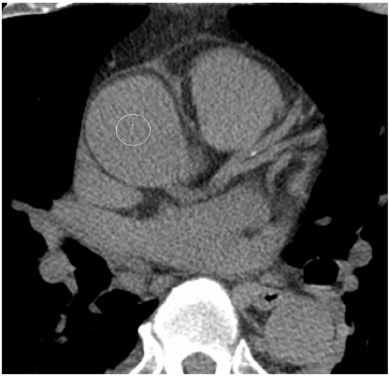
Fig. 1 Measurement of image noise. Region of interest (typically about 150 mm2) is set in ascending aorta on slice image at level of left coronary artery. Mean and standard deviation of CT values are 40 HU and 17 HU, respectively. Image noise is defined as standard deviation.
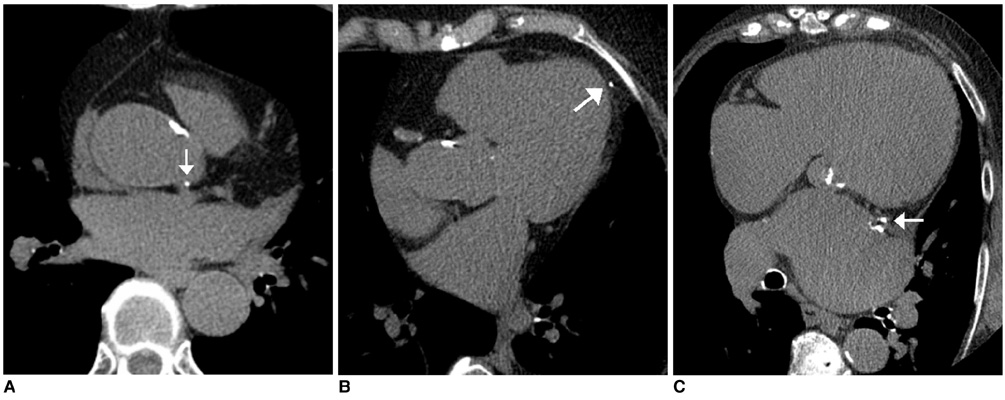
Fig. 2 Discrepancy in interpretation of calcium deposit. A-C. Calcium (arrow in A) is interpreted to be located in aorta by one observer and in left main coronary artery by other observer; calcium (arrow in B) interpreted to be in epicardium versus in left anterior descending artery; calcium (arrow in C) interpreted to be in left atrial wall versus in left circumflex artery.

Fig. 3 Interscan and interobserver variability of Agatston, volume, and mass scores. Graph shows interscan and interobserver variability (Agatston; black, volume; white, mass; gray). Bars and vertical lines indicate mean and standard deviation, respectively. Interscan variability was different between scoring algorithms (p < 0.05) and observers (p < 0.05). Mean variability values are referenced in text.
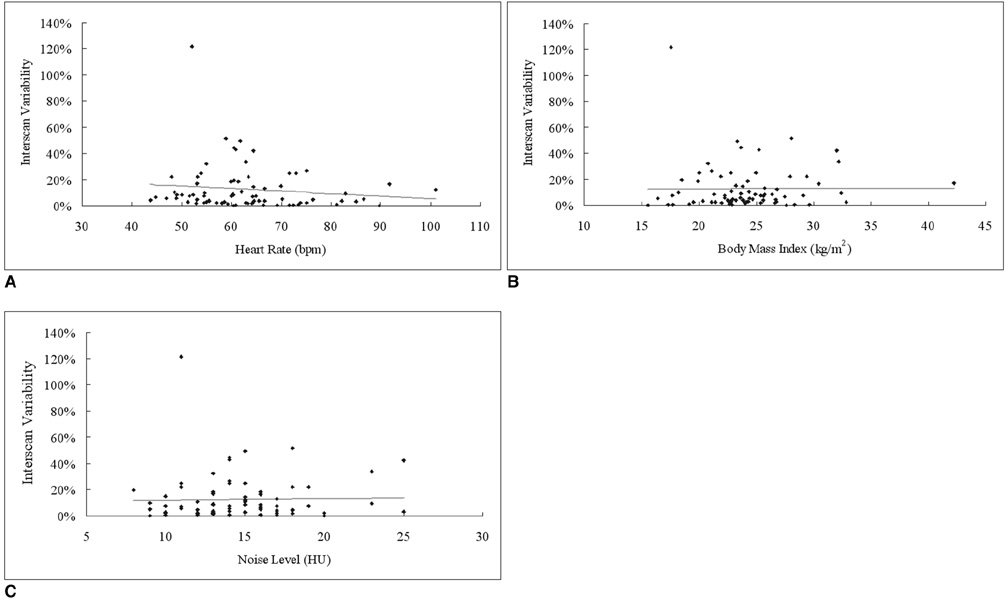
Fig. 4 Scatterplots show ratio (A) between heart rate (bpm) and interscan variability: r2 = 0.016, slope = -0.002 /bpm, intersection = 25%, p = 0.27 ratio (B) between body mass index (kg/m2) and interscan variability: r2 < 0.001, slope = 0.0003 /kg per millimeter squared, intersection = 12%, p = 0.94 and ratio (C) between noise level (HU) and interscan variability: r2 = 0.0007, slope = 0.0013 /HU, intersection = 11%, p = 0.82. Exceptional high variability is observed in case with low coronary artery calcium score.

Fig. 5 Scatterplot shows ratio between body mass index (kg/m2) and standard deviation (HU). r2 = 0.260, slope = 0.40 HU/kg per millimeter squared, intersection = 4.72 HU. Some exceptionally high (or low) standard deviations are due to individual body habitus (i.e., spinal spur is responsible for noisy image) or motion artifacts.
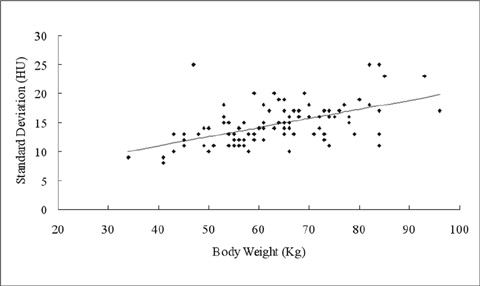
Fig. 6 Scatterplot shows ratio between body weight (kg) and standard deviation (HU). r2 = 0.301, slope = 0.16 HU/kg per millimeter squared, intersection = 4.67 HU.
Reference
-
1. Greenland P, Bonow RO, Brundage BH, Budoff MJ, Eisenberg MJ, Grundy SM, et al. ACCF/AHA 2007 clinical expert consensus document on coronary artery calcium scoring by computed tomography in global cardiovascular risk assessment and in evaluation of patients with chest pain: a report of the American College of Cardiology Foundation Clinical Expert Consensus Task Force (ACCF/AHA Writing Committee to Update the 2000 Expert Consensus Document on Electron Beam Computed Tomography) developed in collaboration with the Society of Atherosclerosis Imaging and Prevention and the Society of Cardiovascular Computed Tomography. J Am Coll Cardiol. 2007. 49:378–402.2. Callister TQ, Raggi P, Cooil B, Lippolis NJ, Russo DJ. Effect of HMG-CoA reductase inhibitors on coronary artery disease as assessed by electron-beam computed tomography. N Engl J Med. 1998. 339:1972–1978.3. Qanadli SD, Mesurolle B, Aegerter P, Joseph T, Oliva VL, Guertin MC, et al. Volumetric quantification of coronary artery calcifications using dual-slice spiral CT scanner: improved reproducibility of measurements with 180 degrees linear interpolation algorithm. J Comput Assist Tomogr. 2001. 25:278–286.4. Achenbach S, Ropers D, Möhlenkamp S, Schmermund A, Muschiol G, Groth J, et al. Variability of repeated coronary artery calcium measurements by electron beam tomography. Am J Cardiol. 2001. 87:210–213.5. Horiguchi J, Matsuura N, Yamamoto H, Hirai N, Kiguchi M, Fujioka C, et al. Variability of repeated coronary artery calcium measurements by 1.25-mm- and 2.5-mm-thickness images on prospective electrocardiograph-triggered 64-slice CT. Eur Radiol. 2008. 18:209–216.6. Horiguchi J, Shen Y, Hirai N, Yamamoto H, Akiyama Y, Ishifuro M, et al. Timing on 16-slice scanner and implications for 64-slice cardiac CT: do you start scanning immediately after breath hold? Acad Radiol. 2006. 13:173–176.7. Morin RL, Gerber TC, McCollough CH. Radiation dose in computed tomography of the heart. Circulation. 2003. 107:917–922.8. Agatston AS, Janowitz WR, Hildner FJ, Zusmer NR, Viamonte M Jr, Detrano R. Quantification of coronary calcium using ultrafast computed tomography. J Am Coll Cardiol. 1990. 15:827–832.9. Yoon HC, Greaser LE 3rd, Mather R, Sinha S, McNitt-Gray MF, Goldin JG. Coronary artery calcium: alternate methods for accurate and reproducible quantitation. Acad Radiol. 1997. 4:666–673.10. Hong C, Bae KT, Pilgram TK, Suh J, Bradley D. Coronary artery calcium measurement with multi-detector row CT: in vitro assessment of effect of radiation dose. Radiology. 2002. 225:901–906.11. Mahnken AH, Wildberger JE, Simon J, Koos R, Flohr TG, Schaller S, et al. Detection of coronary calcifications: feasibility of dose reduction with a body weight-adapted examination protocol. AJR Am J Roentgenol. 2003. 181:533–538.12. McCollough CH, Ulzheimer S, Halliburton SS, Shanneik K, White RD, Kalender WA. Coronary artery calcium: a multiinstitutional, multimanufacturer international standard for quantification at cardiac CT. Radiology. 2007. 243:527–538.13. Goldin JG, Yoon HC, Greaser LE 3rd, Heinze SB, McNitt-Gray MM, Brown MS, et al. Spiral versus electron-beam CT for coronary artery calcium scoring. Radiology. 2001. 221:213–221.14. Leschka S, Wildermuth S, Boehm T, Desbiolles L, Husmann L, Plass A, et al. Noninvasive coronary angiography with 64-section CT: effect of average heart rate and heart rate variability on image quality. Radiology. 2006. 241:378–385.15. Wintersperger BJ, Nikolaou K, von Ziegler F, Johnson T, Rist C, Leber A, et al. Image quality, motion artifacts, and reconstruction timing of 64-slice coronary computed tomography angiography with 0.33-second rotation speed. Invest Radiol. 2006. 41:436–442.16. Bielak LF, Kaufmann RB, Moll PP, McCollough CH, Schwartz RS, Sheedy PF 2nd. Small lesions in the heart identified at electron beam CT: calcification or noise? Radiology. 1994. 192:631–636.17. Budoff MJ, Achenbach S, Blumenthal RS, Carr JF, Goldin JG, Greenland P, et al. Assessment of coronary artery disease by cardiac computed tomography: scientific statement from the American Heart Association Committee on Cardiovascular Imaging and Intervention, Council on Cardiovascular Radiology and Intervention, and Committee on Cardiac Imaging, Council on Clinical Cardiology. Circulation. 2006. 114:1761–1791.18. Mühlenbruch G, Hohl C, Das M, Wildberger JE, Suess C, Klotz E, et al. Evaluation of automated attenuation-based tube current adaptation for coronary calcium scoring in MDCT in a cohort of 262 patients. Eur Radiol. 2007. 17:1850–1857.19. Sevrukov A, Pratap A, Doss C, Jelnin V, Hoff JA, Kondos GT. Electron beam tomography imaging of coronary calcium: the effect of body mass index on radiologic noise. J Comput Assist Tomogr. 2002. 26:592–597.
- Full Text Links
-
- Actions
-
Cited
- CITED
-
- Close
- Share
-
- Similar articles
-
- Cardiac CT
- Evaluation of a Chest Circumference-Adapted Protocol for Low-Dose 128-Slice Coronary CT Angiography with Prospective Electrocardiogram Triggering
- The Effect of Low-Dose beta-Blocker on Heart Rate and Heart Rate Variability in Healthy Subjects with a Resting Heart Rate of Less than 65 Beats per Minute: Effect on the Image Quality of Prospective Electrocardiography-Gated Coronary CT Angiography
- The Influence of Heart Rate and its Variations on Image Quality: A Comparative Study of 16- and 64-Slice Multidetector Row Computed Tomography
- Diagnostic Value of 64-Slice Dual-Source CT Coronary Angiography in Patients with Atrial Fibrillation: Comparison with Invasive Coronary Angiography
