The Value of Measuring Eustachian Tube Aeration on Temporal Bone CT in Patients with Chronic Otitis Media
- Affiliations
-
- 1Department of Otorhinolaryngology, Eulji University College of Medicine, Seoul, Korea.
- 2Department of Otorhinolaryngology, Kyung Hee University School of Medicine, Seoul, Korea. yeo2park@yahoo.co.kr
- KMID: 1460590
- DOI: http://doi.org/10.3342/ceo.2010.3.2.59
Abstract
OBJECTIVES
To evaluate that the cross-sectional area of the air space in the Eustachian tube (ET) on computed tomography (CT) images could be useful for predicting the postoperative aeration of the middle ear.
METHODS
The patient group consisted of 80 patients (80 ears) with chronic otitis media and who underwent middle ear surgery from 2006-2007 and who were followed up for more than 1 yr. The control group consisted of 100 ears of 50 individuals with normal tympanic membranes and who underwent CT for other causes (such as tinnitus or hearing loss). The largest cross-sectional areas of the aerated ET were measured on the coronal images of the temporal bone CT by a single otologist using the computer-based "Region of Interest" picture archiving and communications system. The patient group was divided into two subgroups, 1) those with good postoperative aeration and 2) those with poor postoperative aeration. The largest cross-sectional areas of the aerated ETs were compared between the patients and the controls, and between the patients with good aeration and the patients with poor aeration.
RESULTS
The mean cross-sectional areas significantly differed between the patient group and the control group, and between the good and poor aeration subgroups (P<0.05 each). The mean area of the poor aeration subgroup was smaller than that of the control group (P<0.05), but the mean area of the good aeration subgroup did not significantly differ from that of the controls.
CONCLUSION
The cross-sectional area of the aerated ET, as measured on the preoperative coronal images of temporal bone CT scans, may be useful for predicting the postoperative condition of the tympanic cavity.
MeSH Terms
Figure
-
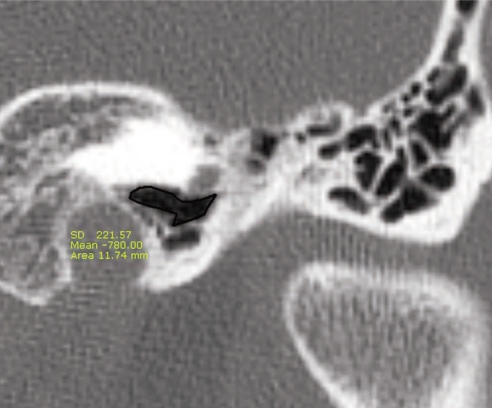
Fig. 1 The coronal computed tomography image captured during measurement of the largest cross-sectional areas of the aerated Eustachian tube using the "Region of Interest" picture archiving and communications system. The "area" circumscribed by the black-colored curved line was determined by automatic calculation, whereas the "mean" was the average number of Housefield unit of the corresponding region and "SD" was the standard deviation in Housefield unit.
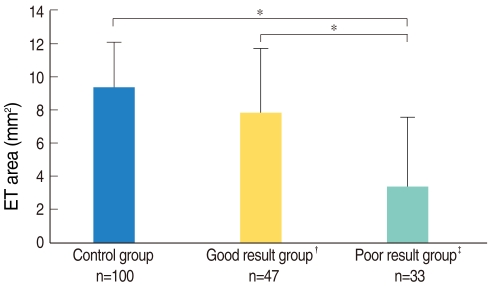
Fig. 2 Measurements of the largest cross-sectional areas of the aerated Eustachian tube (ET). We observed significant differences between the poor aeration subgroup and the good aeration subgroup (*P<0.05) and between the poor aeration subgroup and the control group; by contrast, the areas of the good aeration subgroup and the control group did not significantly differ. †Good aeration group: the patients showing normal tympanic membranes and A type on tympanometry after surgery; ‡Poor aeration group: the patients showing adhesive tympanic membranes or B/C on tympanometry after surgery. The error bar means SD.
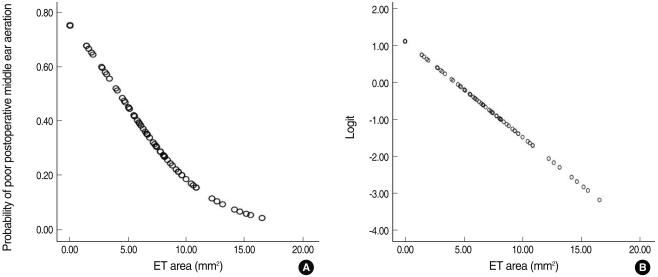
Fig. 3 The correlation between the largest cross-sectional areas of the aerated Eustachian tube (ET) and the postoperative middle ear aeration (A), and the logit transformation of the postoperative middle ear aeration (B). It means that the largest cross-sectional areas of the aerated Eustachian tube are related with the postoperative middle ear aeration. The odds ratio was 0.772 (P=0.000).
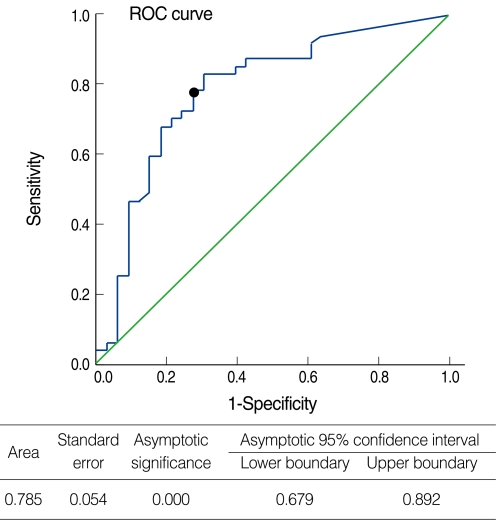
Fig. 4 Receiver operating characteristic (ROC) curve for the largest cross-sectional area of the aerated Eustachian tube for predicting good postoperative middle ear aeration. The cut-off value for differentiating good aeration from poor aeration was estimated to be 5.53 mm2 (circle).
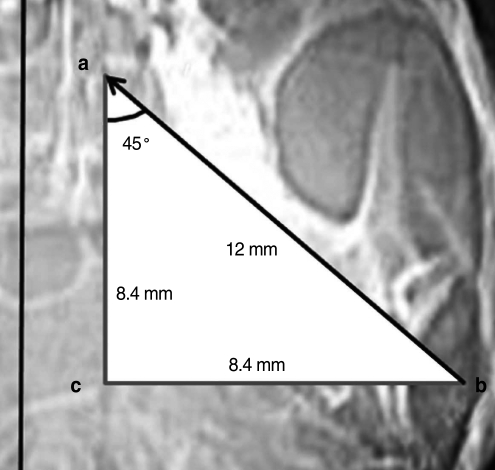
Fig. 5 Eustachian tube (ET) measurements on the coronal view of temporal bone CT. The anteroposterior distance (a-c) of the bony ET was calculated to be 8.4 mm from the average length of the bony ET (a-b) in a normal adult (12 mm), and the angle of a-b to the sagittal plane was about 45°. a: midpoint of the medial border of the bony ET; b: midpoint of the lateral border of the bony ET; c: imaginary point of intersection where the two lines from a and b.
Reference
-
1. Tos M. Importance of eustachian tube function in middle ear surgery. Ear Nose Throat J. 1998; 9. 77(9):744–747. PMID: 9787517.
Article2. Bluestone CD. Cummings CW, Flint PW, Harker LA, Haughey BH, Richardson MA, Robbins BW, editors. Anantomy and physiology of the Eustachian tube. Cummings otolaryngology: head and neck surgery. 1998. 3rd ed. Philadelphia: Elsevier Mosby Inc;p. 3003–3025.3. Riedel CL, Wiley TL, Block MG. Tympanometric measures of eustachian tube function. J Speech Hear Res. 1987; 6. 30(2):207–214. PMID: 3599952.
Article4. Poe DS, Abou-Halawa A, Abdel-Razek O. Analysis of the dysfunctional eustachian tube by video endoscopy. Otol Neurotol. 2001; 9. 22(5):590–595. PMID: 11568663.
Article5. Yoshida H, Takahashi H, Morikawa M, Kobayashi T. Anatomy of the bony portion of the eustachian tube in tubal stenosis: multiplanar reconstruction approach. Ann Otol Rhinol Laryngol. 2007; 9. 116(9):681–686. PMID: 17926591.
Article6. Yoshida H, Kobayashi T, Takasaki K, Takahashi H, Ishimaru H, Morikawa M, et al. Imaging of the patulous Eustachian tube: high-resolution CT evaluation with multiplanar reconstruction technique. Acta Otolaryngol. 2004; 10. 124(8):918–923. PMID: 15513527.
Article7. Yoshida H, Kobayashi T, Morikawa M, Hayashi K, Tsujii H, Sasaki Y. CT imaging of the patulous eustachian tube: comparison between sitting and recumbent positions. Auris Nasus Larynx. 2003; 5. 30(2):135–140. PMID: 12753983.8. Kikuchi T, Oshima T, Ogura M, Hori Y, Kawase T, Kobayashi T. Three-dimensional computed tomography imaging in the sitting position for the diagnosis of patulous eustachian tube. Otol Neurotol. 2007; 2. 28(2):199–203. PMID: 17255887.
Article9. Takahashi H, Sato H, Nakamura H, Naito Y, Umeki H. Correlation between middle-ear pressure-regulation functions and outcome of type-I tympanoplasty. Auris Nasus Larynx. 2007; 6. 34(2):173–176. PMID: 17055205.
Article10. Bluestone CD, Hebda PA, Alper CM, Sando I, Buchman CA, Stangerup SE, et al. Recent advances in otitis media: 2. Eustachian tube, middle ear, and mastoid anatomy; physiology, pathophysiology, and pathogenesis. Ann Otol Rhinol Laryngol Suppl. 2005; 1. 194:16–30. PMID: 15700932.11. Magnuson B. Tubal opening and closing ability in unilateral middle ear disease. Am J Otolaryngol. 1981; 8. 2(3):199–209. PMID: 7283063.
Article12. Bluestone CD. Studies in otitis media: Children's Hospital of Pittsburgh-University of Pittsburgh progress report-2004. Laryngoscope. 2004; 11. 114(11 Pt 3 Suppl 105):1–26. PMID: 15514559.
Article13. Sade J, Luntz M. Eustachian tube lumen: comparison between normal and inflamed specimens. Ann Otol Rhinol Laryngol. 1989; 8. 98(8 Pt 1):630–634. PMID: 2764447.
Article14. Sade J, Luntz M, Berger G. The eustachian tube profile in children: a quantitative histopathological study of the ET lumen and mucosal lining involvement in acute and secretory otitis media. Adv Otorhinolaryngol. 1988; 39:18–36. PMID: 3394566.15. Prades JM, Dumollard JM, Calloc'h F, Merzougui N, Veyret C, Martin C. Descriptive anatomy of the human auditory tube. Surg Radiol Anat. 1998; 20(5):335–340. PMID: 9894313.
Article16. Djeric D, Savic D. Anatomical variations and relations of the bony portion of the eustachian tube. Acta Otolaryngol. 1985; May–Jun. 99(5-6):543–550. PMID: 4024903.
- Full Text Links
-
- Actions
-
Cited
- CITED
-
- Close
- Share
-
- Similar articles
-
- Eustachian Tube Function and Mastoid Pneumatization as Prognostic Factors of Type 1 Tympanoplasty
- Book Review: Eustachian Tube: Structure, Function, Role in Otitis Media
- Postoperative Mastoid Aeration Following Canal Wall Up Mastoidectomy according to Preoperative Middle Ear Disease: Analysis of Temporal Bone Computed Tomography Scans
- Development of Animal Models of Otitis Media
- Analysis of Eustachian Tube Dysfunction by Dynamic Slow Motion Video Endoscopy and Eustachian Tube Dysfunction Questionnaire in Chronic Otitis Media
