Quantitative Assessment of Tumor Responses after Radiation Therapy in a DLD-1 Colon Cancer Mouse Model Using Serial Dynamic Contrast-Enhanced Magnetic Resonance Imaging
- Affiliations
-
- 1Department of Radiology and Research Institute of Radiological Science, Yonsei University College of Medicine, Seoul, Korea. hotsong@yuhs.ac
- 2Department of Radiation Oncology, Yonsei University College of Medicine, Seoul, Korea.
- KMID: 1414257
- DOI: http://doi.org/10.3349/ymj.2012.53.6.1147
Abstract
- PURPOSE
The purpose of this study was to investigate the predictability of pretreatment values including Dynamic Contrast-Enhanced Magnetic Resonance Imaging (DCE-MRI) derived parameters (Ktrans, Kep and Ve), early changes in parameters (Ktrans, tumor volume), and heterogeneity (standard deviation of Ktrans) for radiation therapy responses via a human colorectal cancer xenograft model.
MATERIALS AND METHODS
A human colorectal cancer xenograft model with DLD-1 cancer cells was produced in the right hind limbs of five mice. Tumors were irradiated with 3 fractions of 3 Gy each for 3 weeks. Baseline and follow up DCE-MRI were performed. Quantitative parameters (Ktrans, Kep and Ve) were calculated based on the Tofts model. Early changes in Ktrans, standard deviation (SD) of Ktrans, and tumor volume were also calculated. Tumor responses were evaluated based on histology. With a cut-off value of 0.4 for necrotic factor, a comparison between good and poor responses was conducted.
RESULTS
The good response group (mice #1 and 2) exhibited higher pretreatment Ktrans than the poor response group (mice #3, 4, and 5). The good response group tended to show lower pretreatment Kep, higher pretreatment Ve, and larger baseline tumor volume than the poor response group. All the mice in the good response group demonstrated marked reductions in Ktrans and SD value after the first radiation. All tumors showed increased volume after the first radiation therapy.
CONCLUSION
The good response after radiation therapy group in the DLD-1 colon cancer xenograft nude mouse model exhibited a higher pretreatment Ktrans and showed an early reduction in Ktrans, demonstrating a more homogenous distribution.
Keyword
MeSH Terms
Figure
-
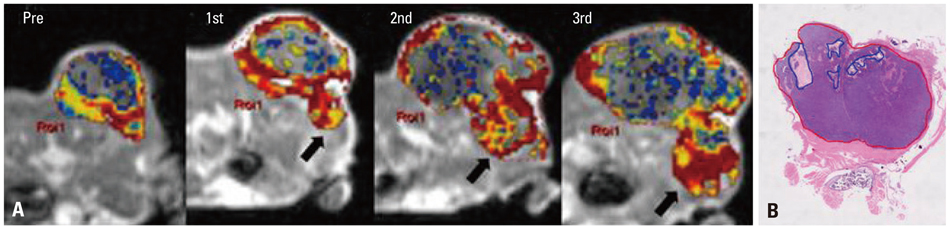
Fig. 1 An exceptional case, mouse #3, was assigned to the poor response group although it showed a large area of necrosis (NF=0.49). (A) Serial DCE-MRI with color mapping shows the change in Ktrans. Pretreatment Ktrans showed a relatively low value (0.11). Ktrans increased after the first radiation therapy (K1R=1.51). Red color represents the higher value of Ktrans and blue color represents the lower value. An outgrowing tumor was identified after the first radiation therapy (arrow). (B) H&E staining of the newly grown tumor, which separated from the main mass, showed rare necrosis. The original magnification is ×2. The red line indicates the tumor border and the blue line indicates the area of necrosis. NF, necrotic fraction; H&E, hematoxylin and eosin.
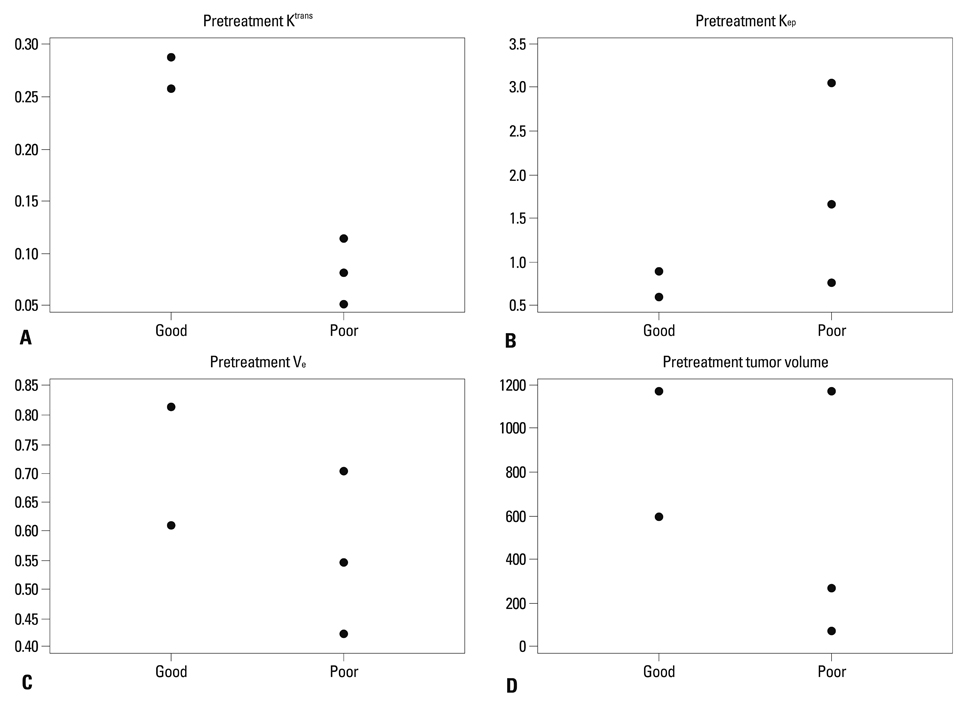
Fig. 2 Comparison of quantitative parameters between the good and the poor response groups upon baseline imaging. (A) Ktrans, (B) Kep, (C) Ve, (D) pretreatment tumor volume.
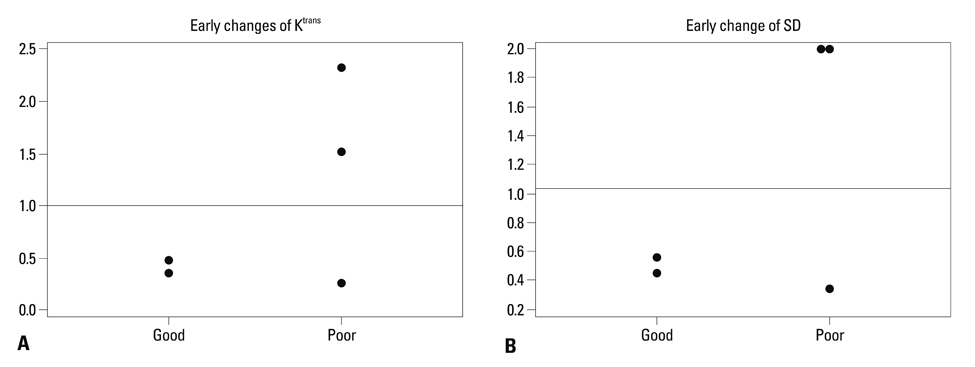
Fig. 3 Comparison of Ktrans between the good and the poor response groups after the 1st radiation therapy. (A) Early changes in Ktrans and (B) early changes in standard deviation for Ktrans (SD). The y-axis represents the ratio of the value after the 1st radiation therapy to the pretreatment value. The horizontal solid line at the ratio of 1 represents no change within the interval.
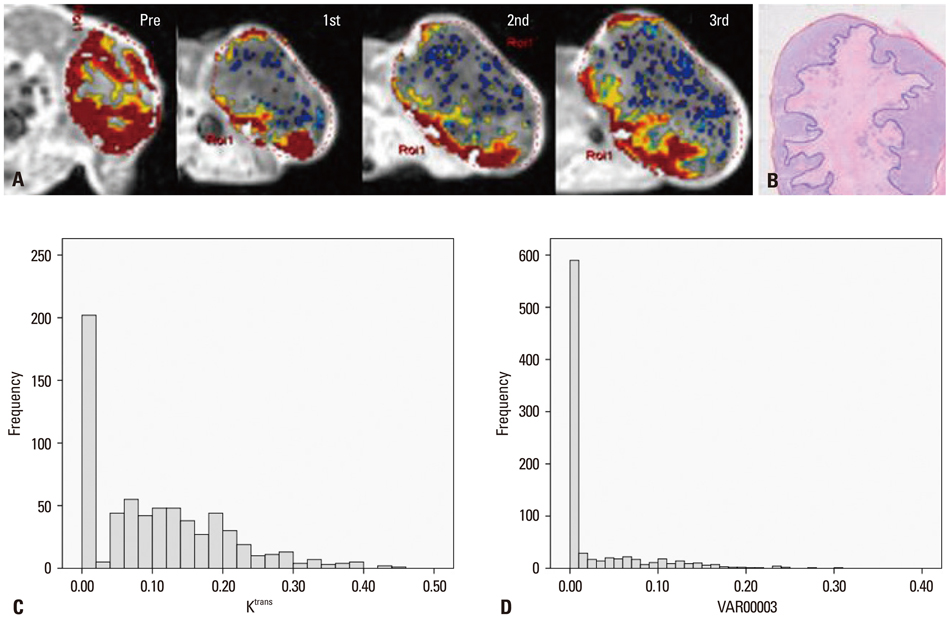
Fig. 4 A representative case of good response in mouse #2. (A) Serial DCE-MRI with color mapping shows higher pretreatment Ktrans (0.29) and marked reduction in Ktrans after the first radiation therapy (K1R=0.47). (B) H&E staining of the corresponding section in mouse #2. The original magnification is ×2. Necrosis is identified in the center of the tumor. The red line indicates the tumor border and the blue line indicates the area of necrosis. The necrosis factor was 0.46. Histogram shows the heterogeneous distribution of Ktrans at baseline with an SD of 0.09 (C) and the homogenous distribution of Ktrans with an SD of 0.05 after the first radiation therapy (D). DCE-MRI, dynamic contrast-enhanced magnetic resonance imaging; SD, standard deviation; H&E, hematoxylin and eosin.
Cited by 1 articles
-
The Effectiveness of Ferritin as a Contrast Agent for Cell Tracking MRI in Mouse Cancer Models
Chan Wha Lee, Sun Il Choi, Sang Jin Lee, Young Taek Oh, Gunwoo Park, Na Yeon Park, Kyoung-Ah Yoon, Sunshin Kim, Daehong Kim, Yun-Hee Kim, Jin-Suck Suh
Yonsei Med J. 2017;58(1):51-58. doi: 10.3349/ymj.2017.58.1.51.
Reference
-
1. Lindmark G, Gerdin B, Påhlman L, Bergström R, Glimelius B. Prognostic predictors in colorectal cancer. Dis Colon Rectum. 1994. 37:1219–1227.
Article2. Marsh PJ, James RD, Schofield PF. Adjuvant preoperative radiotherapy for locally advanced rectal carcinoma. Results of a prospective, randomized trial. Dis Colon Rectum. 1994. 37:1205–1214.
Article3. Sauer R, Becker H, Hohenberger W, Rödel C, Wittekind C, Fietkau R, et al. Preoperative versus postoperative chemoradiotherapy for rectal cancer. N Engl J Med. 2004. 351:1731–1740.
Article4. Påhlman L, Glimelius B. The value of adjuvant radio(chemo)therapy for rectal cancer. Eur J Cancer. 1995. 31A:1347–1350.
Article5. Harrison LB, Chadha M, Hill RJ, Hu K, Shasha D. Impact of tumor hypoxia and anemia on radiation therapy outcomes. Oncologist. 2002. 7:492–508.
Article6. McDonald DM, Choyke PL. Imaging of angiogenesis: from microscope to clinic. Nat Med. 2003. 9:713–725.
Article7. Tofts PS, Brix G, Buckley DL, Evelhoch JL, Henderson E, Knopp MV, et al. Estimating kinetic parameters from dynamic contrast-enhanced T(1)-weighted MRI of a diffusable tracer: standardized quantities and symbols. J Magn Reson Imaging. 1999. 10:223–232.
Article8. George ML, Dzik-Jurasz AS, Padhani AR, Brown G, Tait DM, Eccles SA, et al. Non-invasive methods of assessing angiogenesis and their value in predicting response to treatment in colorectal cancer. Br J Surg. 2001. 88:1628–1636.
Article9. Ah-See ML, Makris A, Taylor NJ, Harrison M, Richman PI, Burcombe RJ, et al. Early changes in functional dynamic magnetic resonance imaging predict for pathologic response to neoadjuvant chemotherapy in primary breast cancer. Clin Cancer Res. 2008. 14:6580–6589.
Article10. Yu HJ, Chen JH, Mehta RS, Nalcioglu O, Su MY. MRI measurements of tumor size and pharmacokinetic parameters as early predictors of response in breast cancer patients undergoing neoadjuvant anthracycline chemotherapy. J Magn Reson Imaging. 2007. 26:615–623.
Article11. Issa B, Buckley DL, Turnbull LW. Heterogeneity analysis of Gd-DTPA uptake: improvement in breast lesion differentiation. J Comput Assist Tomogr. 1999. 23:615–621.
Article12. Chang YC, Huang CS, Liu YJ, Chen JH, Lu YS, Tseng WY. Angiogenic response of locally advanced breast cancer to neoadjuvant chemotherapy evaluated with parametric histogram from dynamic contrast-enhanced MRI. Phys Med Biol. 2004. 49:3593–3602.
Article13. Tofts PS. Modeling tracer kinetics in dynamic Gd-DTPA MR imaging. J Magn Reson Imaging. 1997. 7:91–101.
Article14. Jackson A, O'Connor JP, Parker GJ, Jayson GC. Imaging tumor vascular heterogeneity and angiogenesis using dynamic contrast-enhanced magnetic resonance imaging. Clin Cancer Res. 2007. 13:3449–3459.
Article15. Patankar TF, Haroon HA, Mills SJ, Balériaux D, Buckley DL, Parker GJ, et al. Is volume transfer coefficient (K(trans)) related to histologic grade in human gliomas? AJNR Am J Neuroradiol. 2005. 26:2455–2465.16. Tomayko MM, Reynolds CP. Determination of subcutaneous tumor size in athymic (nude) mice. Cancer Chemother Pharmacol. 1989. 24:148–154.
Article17. Ahn SJ, An CS, Koom WS, Song HT, Suh JS. Correlations of 3T DCE-MRI quantitative parameters with microvessel density in a human-colorectal-cancer xenograft mouse model. Korean J Radiol. 2011. 12:722–730.
Article18. Rich TA, Skibber JM, Ajani JA, Buchholz DJ, Cleary KR, Dubrow RA, et al. Preoperative infusional chemoradiation therapy for stage T3 rectal cancer. Int J Radiat Oncol Biol Phys. 1995. 32:1025–1029.
Article19. de Vries A, Griebel J, Kremser C, Judmaier W, Gneiting T, Debbage P, et al. Monitoring of tumor microcirculation during fractionated radiation therapy in patients with rectal carcinoma: preliminary results and implications for therapy. Radiology. 2000. 217:385–391.
Article20. Sahani DV, Kalva SP, Hamberg LM, Hahn PF, Willett CG, Saini S, et al. Assessing tumor perfusion and treatment response in rectal cancer with multisection CT: initial observations. Radiology. 2005. 234:785–792.
Article21. Choi S, Liu H, Shin TB, Lee JH, Yoon SK, Oh JY, et al. Perfusion imaging of the brain using Z-score and dynamic images obtained by subtracting images from before and after contrast injection. Korean J Radiol. 2004. 5:143–148.
Article22. Cooper RA, Carrington BM, Loncaster JA, Todd SM, Davidson SE, Logue JP, et al. Tumour oxygenation levels correlate with dynamic contrast-enhanced magnetic resonance imaging parameters in carcinoma of the cervix. Radiother Oncol. 2000. 57:53–59.
Article23. Loncaster JA, Carrington BM, Sykes JR, Jones AP, Todd SM, Cooper R, et al. Prediction of radiotherapy outcome using dynamic contrast enhanced MRI of carcinoma of the cervix. Int J Radiat Oncol Biol Phys. 2002. 54:759–767.
Article24. Hawighorst H, Knopp MV, Debus J, Hoffmann U, Grandy M, Griebel J, et al. Pharmacokinetic MRI for assessment of malignant glioma response to stereotactic radiotherapy: initial results. J Magn Reson Imaging. 1998. 8:783–788.
Article25. Pickles MD, Lowry M, Manton DJ, Gibbs P, Turnbull LW. Role of dynamic contrast enhanced MRI in monitoring early response of locally advanced breast cancer to neoadjuvant chemotherapy. Breast Cancer Res Treat. 2005. 91:1–10.
Article26. Hayes C, Padhani AR, Leach MO. Assessing changes in tumour vascular function using dynamic contrast-enhanced magnetic resonance imaging. NMR Biomed. 2002. 15:154–163.
Article27. de Lussanet QG, Backes WH, Griffioen AW, Padhani AR, Baeten CI, van Baardwijk A, et al. Dynamic contrast-enhanced magnetic resonance imaging of radiation therapy-induced microcirculation changes in rectal cancer. Int J Radiat Oncol Biol Phys. 2005. 63:1309–1315.
Article
- Full Text Links
-
- Actions
-
Cited
- CITED
-
- Close
- Share
-
- Similar articles
-
- Correlations of 3T DCE-MRI Quantitative Parameters with Microvessel Density in a Human-Colorectal-Cancer Xenograft Mouse Model
- Dynamic Contrast-Enhanced MR Imaging of Tietze’s Syndrome: a Case Report
- Dynamic Contrast-Enhanced T2*-Weighted Imaging in Acute Cerebral Infarction: Usefulness in Assessment of Cerebral Hemodynamics
- Medical imaging of prostate cancer
- Dynamic contrast-enhanced magnetic resonance imaging parameter changes as an early biomarker of tumor responses following radiation therapy in patients with spinal metastases: a systematic review
