Investig Magn Reson Imaging.
2020 Mar;24(1):55-60. 10.13104/imri.2020.24.1.55.
Dynamic Contrast-Enhanced MR Imaging of Tietze’s Syndrome: a Case Report
- Affiliations
-
- 1Department of Radiology, Dankook University Hospital, Cheonan, Korea
- KMID: 2508219
- DOI: http://doi.org/10.13104/imri.2020.24.1.55
Abstract
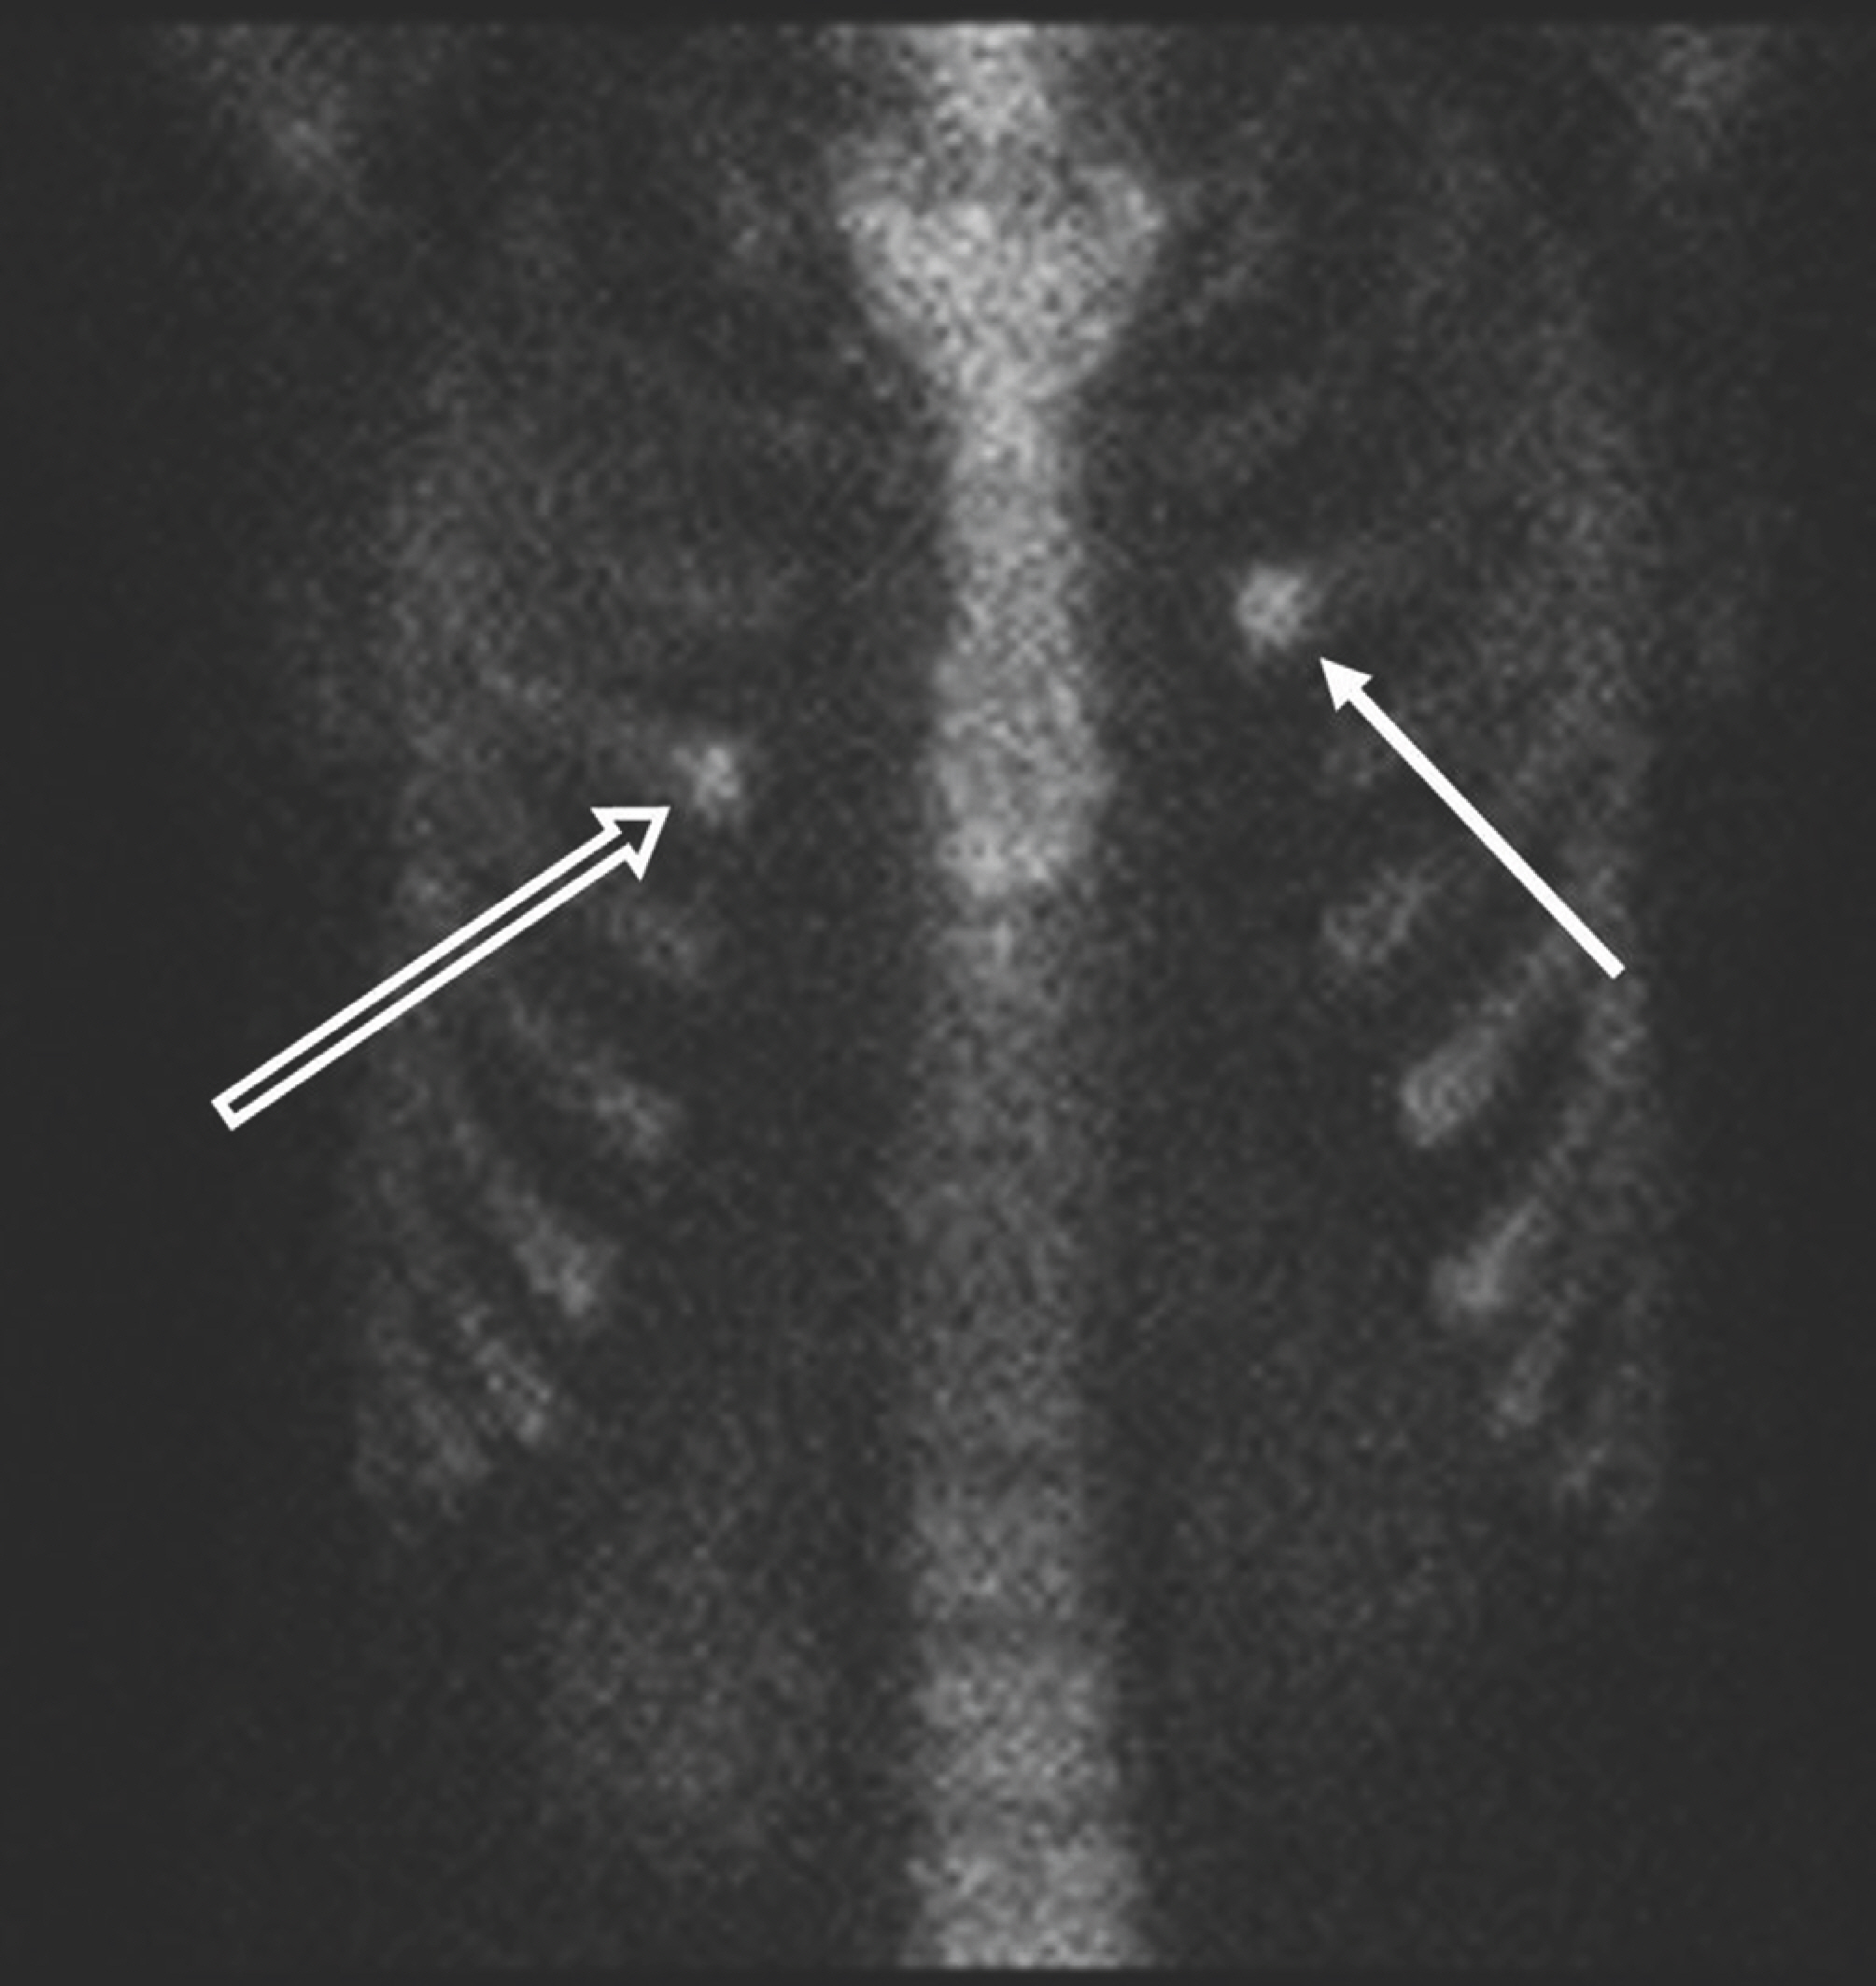
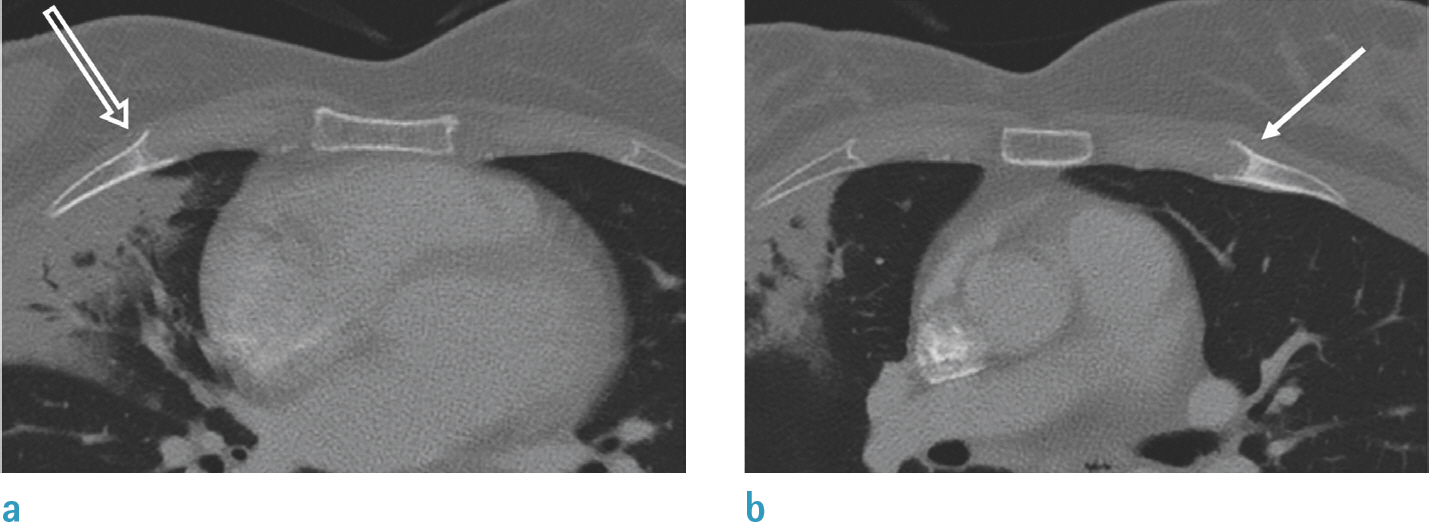
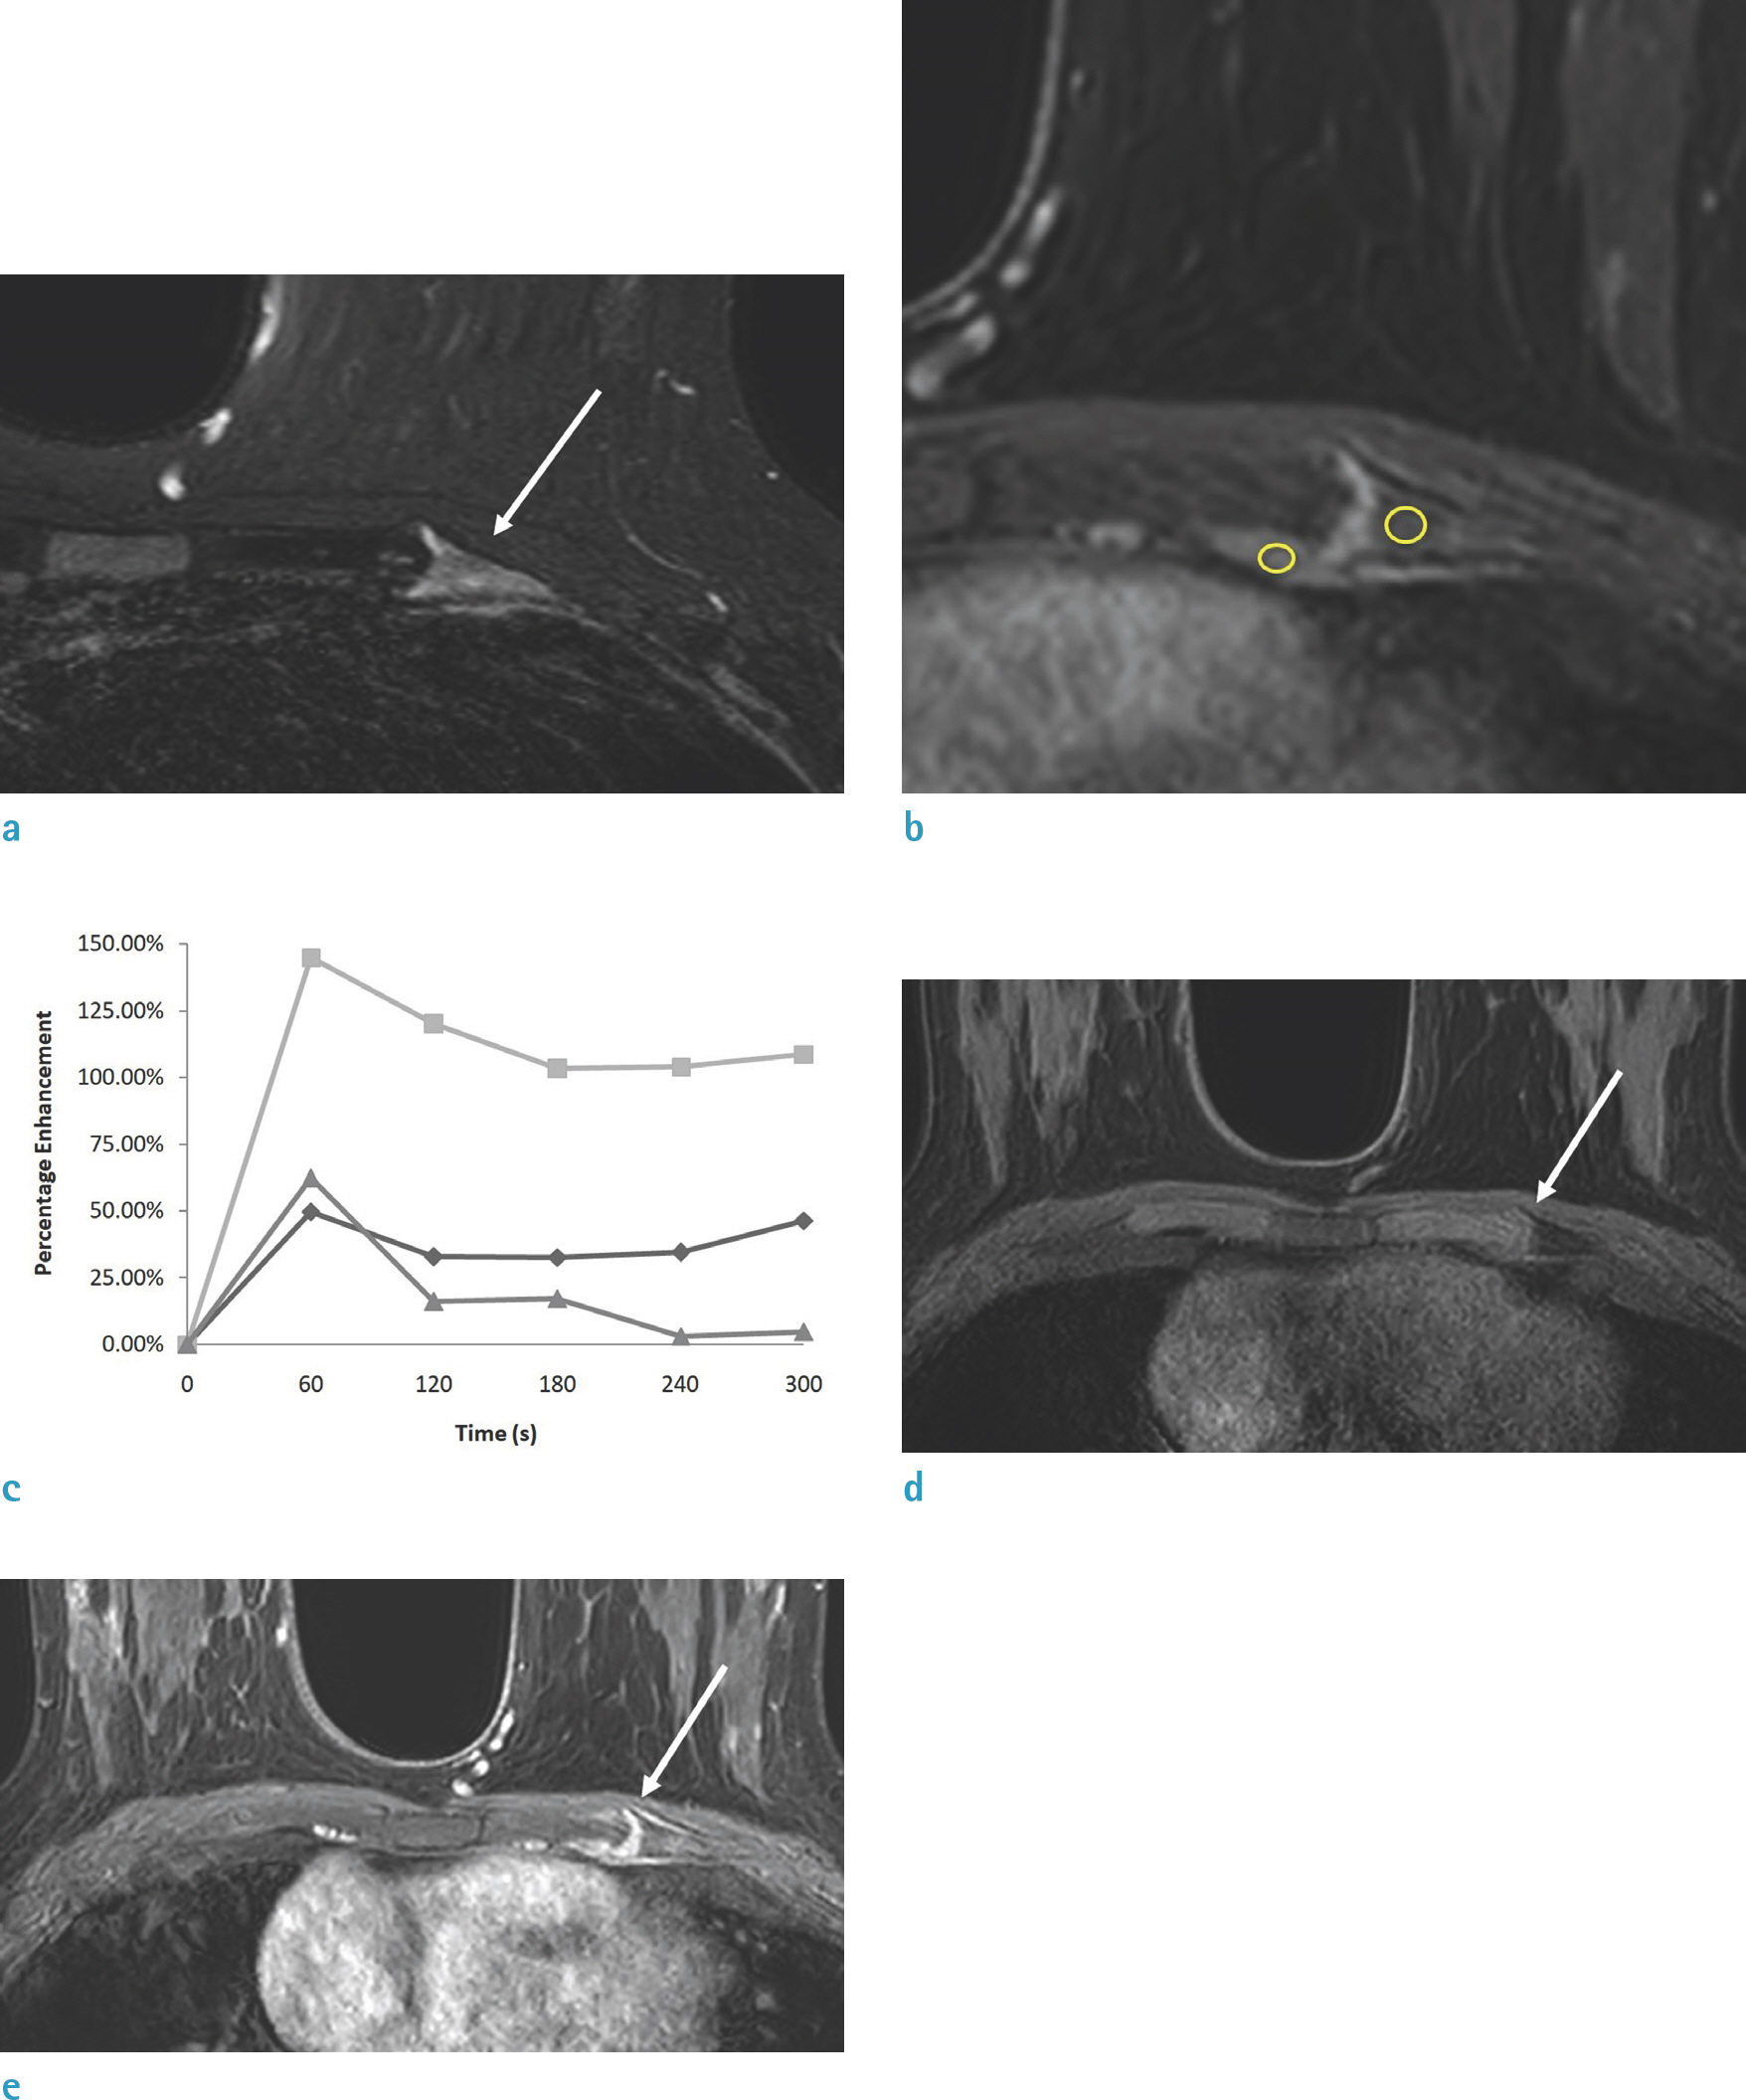
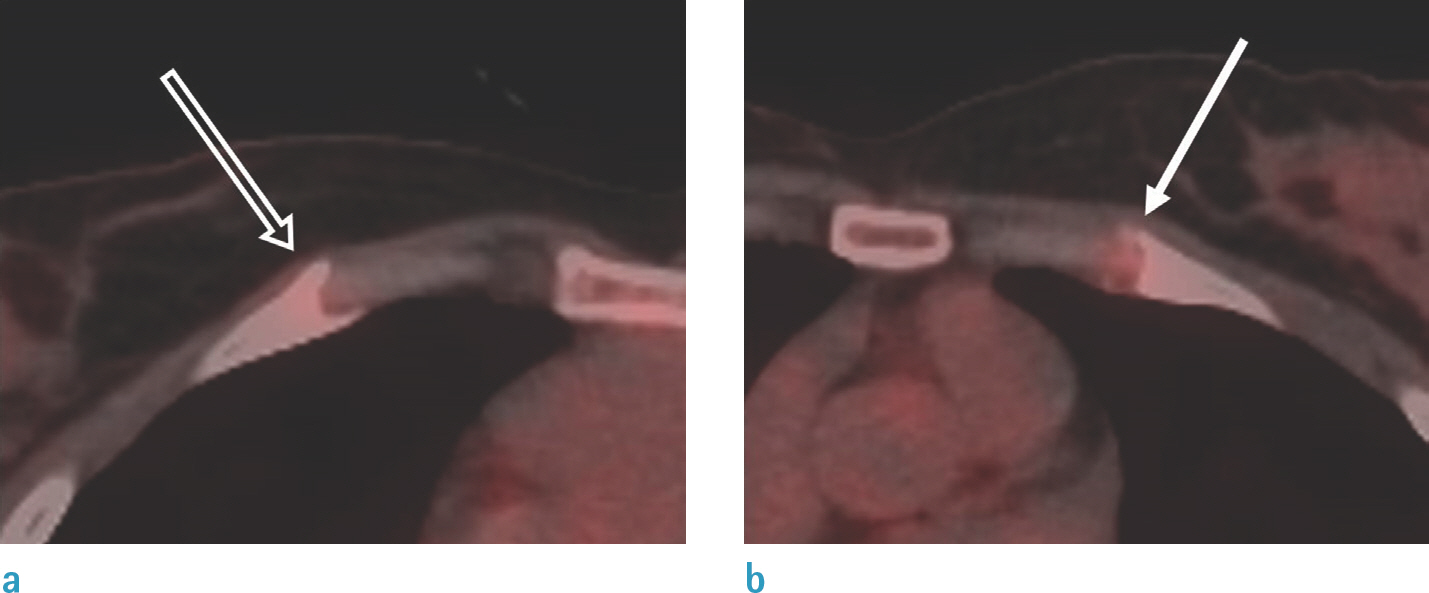
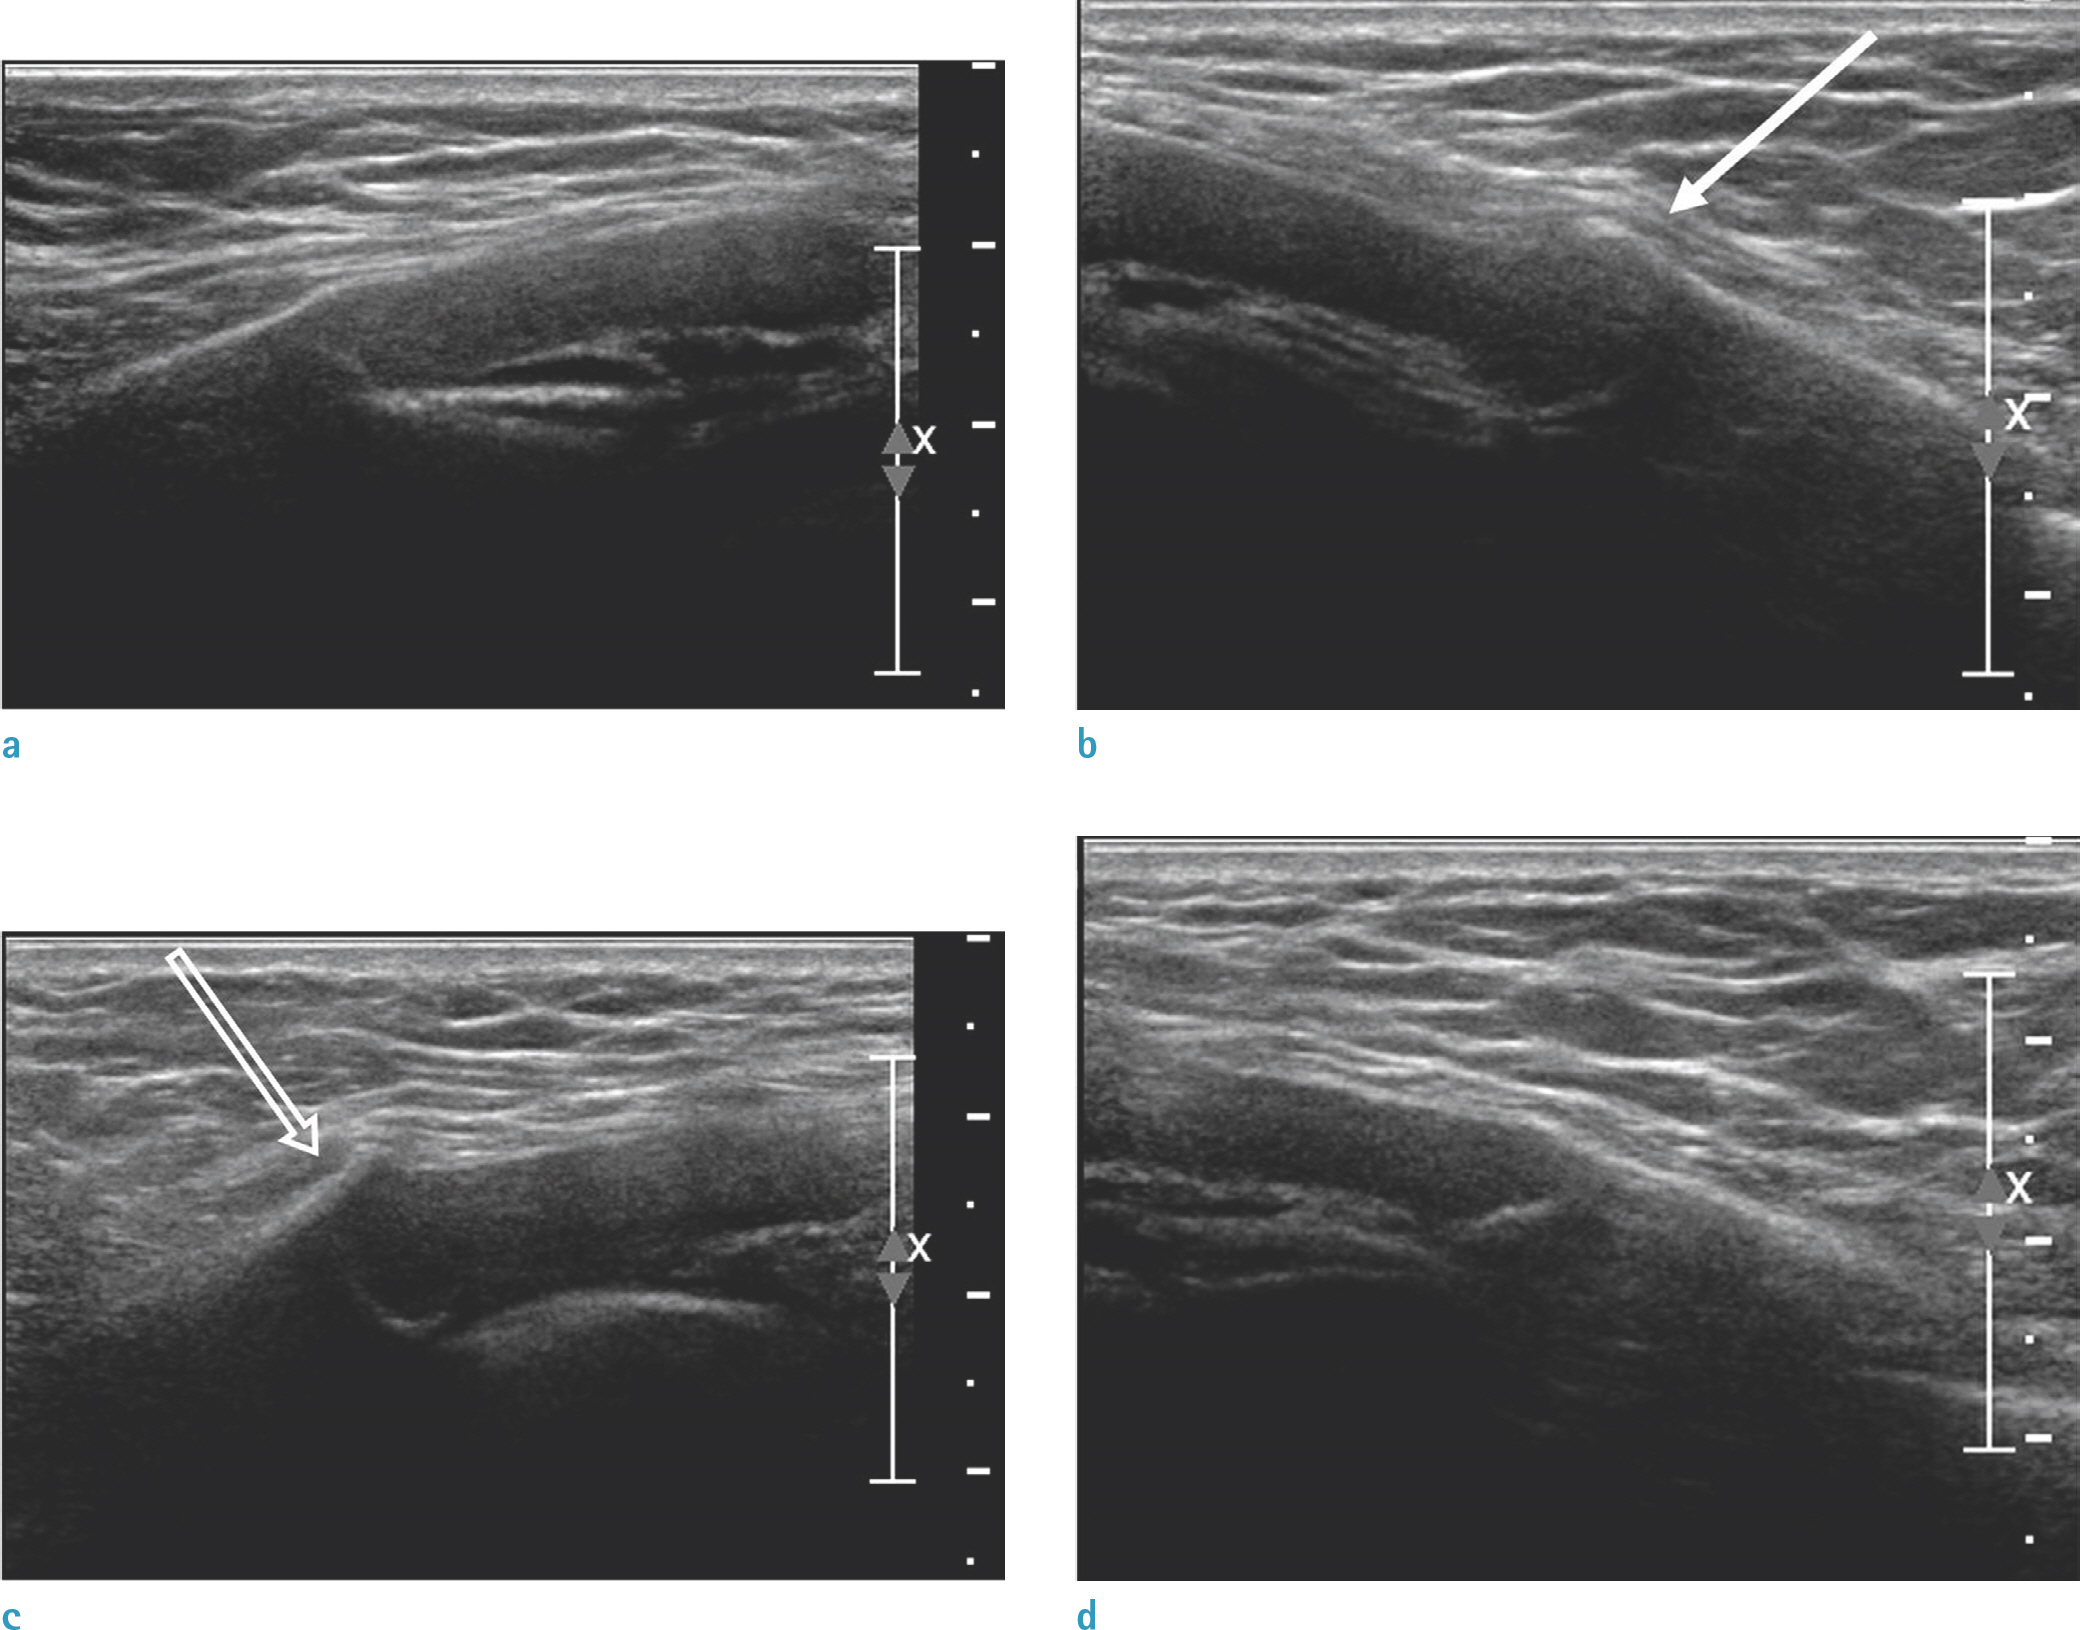
- Tietze's syndrome is an inflammatory condition associated with painful swelling of the costochondral, costosternal, and sternoclavicular joints. Tietze's syndrome has been mostly attributed to microtrauma until now; however, this etiology is currently disputed. The diagnosis is based on clinical findings, although a few studies suggest the advantages of imaging. We report a case of Tietze's syndrome with a review of radiological findings, especially magnetic resonance imaging (MRI) with dynamic contrast enhancement.
Figure
Reference
-
1.Kaplan T., Gunal N., Gulbahar G, et al. Painful chest wall swellings: Tietze syndrome or chest wall tumor? Thorac Cardiovasc Surg. 2016. 64:239–244.
Article2.Volterrani L., Mazzei MA., Giordano N., Nuti R., Galeazzi M., Fioravanti A. Magnetic resonance imaging in Tietze's syndrome. Clin Exp Rheumatol. 2008. 26:848–853.3.Cameron HU., Fornasier VL. Tietze's disease. J Clin Pathol. 1974. 27:960–962.
Article4.Aeschlimann A., Kahn MF. Tietze's syndrome: a critical review. Clin Exp Rheumatol. 1990. 8:407–412.5.Edelstein G., Levitt RG., Slaker DP., Murphy WA. Computed tomography of Tietze syndrome. J Comput Assist Tomogr. 1984. 8:20–23.
Article6.Martino F., D'amore M., Angelelli G., Macarini L., Cantatore FP. Echographic study of Tietze's syndrome. Clin Rheumatol. 1991. 10:2–4.
Article7.Hoffer PB., Genant HK. Radionuclide joint imaging. Semin Nucl Med. 1976. 6:121–137.
Article8.Oh JH., Park SB., Oh HC. 18F-FDG PET/CT and bone scintigraphy findings in Tietze syndrome. Clin Nucl Med. 2018. 43:832–834.
Article9.Schwenzer NF., Kotter I., Henes JC, et al. The role of dynamic contrast-enhanced MRI in the differential diagnosis of psoriatic and rheumatoid arthritis. AJR Am J Roentgenol. 2010. 194:715–720.
Article10.van der Leij C., van de Sande MG., Lavini C., Tak PP., Maas M. Rheumatoid synovial inflammation: pixel-by-pixel dynamic contrast-enhanced MR imaging time-intensity curve shape analysis–a feasibility study. Radiology. 2009. 253:234–240.
Article
- Full Text Links
- Actions
-
Cited
- CITED
-
- Close
- Share
- Similar articles
-
- Dynamic Contrast-Enhanced T2*-Weighted Imaging in Acute Cerebral Infarction: Usefulness in Assessment of Cerebral Hemodynamics
- Detectability of Hepatocellular Carcinoma: Comparison of Gd-DT PA-Enhanced and SPIO-Enhanced MR Imaging
- Hepatic Cavernous Hemangioma in Cirrhotic Liver: Imaging Findings
- Carcinoma of the Cervix: Usefulness of Dynamic and Contrast-Enhanced T1-weighted MR Imaging in Assessing theDepth of Stromal Invasion
- MR Finding of Primary Renal Lymphoma: A Case Report

