Diagnosis of Myocardial Viability by Fluorodeoxyglucose Distribution at the Border Zone of a Low Uptake Region
- Affiliations
-
- 1Department of Cardiology, Kawasaki Medical School, Kurashiki, Okayama, Japan. oyota@kyokuto.or.jp
- 2Department of Nuclear Medicine, Kawasaki Medical School, Kurashiki, Okayama, Japan.
- 3Department of Radiological Technology, Kawasaki Medical School, Kurashiki, Okayama, Japan.
- 4Department of Cardiology, Okayama Kyokuto Hospital, Okayama, Japan.
- KMID: 1126015
- DOI: http://doi.org/10.3349/ymj.2010.51.2.178
Abstract
-
PURPOSE: In cardiac 2-[F-18]fluoro-2-deoxy-D-glucose (FDG)-positron emission tomography (PET) examination, interpretation of myocardial viability in the low uptake region (LUR) has been difficult without additional perfusion imaging. We evaluated distribution patterns of FDG at the border zone of the LUR in the cardiac FDG-PET and established a novel parameter for diagnosing myocardial viability and for discriminating the LUR of normal variants.
MATERIALS AND METHODS
Cardiac FDG-PET was performed in patients with a myocardial ischemic event (n = 22) and in healthy volunteers (n = 22). Whether the myocardium was not a viable myocardium (not-VM) or an ischemic but viable myocardium (isch-VM) was defined by an echocardiogram under a low dose of dobutamine infusion as the gold standard. FDG images were displayed as gray scaled-bull's eye mappings. FDG-plot profiles for LUR (= true ischemic region in the patients or normal variant region in healthy subjects) were calculated. Maximal values of FDG change at the LUR border zone (a steepness index; S(max) scale/pixel) were compared among not-VM, isch-VM, and normal myocardium.
RESULTS
S(max) was significantly higher for n-VM compared to those with isch-VM or normal myocardium (ANOVA). A cut-off value of 0.30 in Smax demonstrated 100% sensitivity and 83% specificity for diagnosing n-VM and isch-VM. S(max) less than 0.23 discriminated LUR in normal myocardium from the LUR in patients with both n-VM and isch-VM with a 94% sensitivity and a 93% specificity.
CONCLUSION
S(max) of the LUR in cardiac FDG-PET is a simple and useful parameter to diagnose n-VM and isch-VM, as well as to discriminate thr LUR of normal variants.
Keyword
MeSH Terms
Figure
-
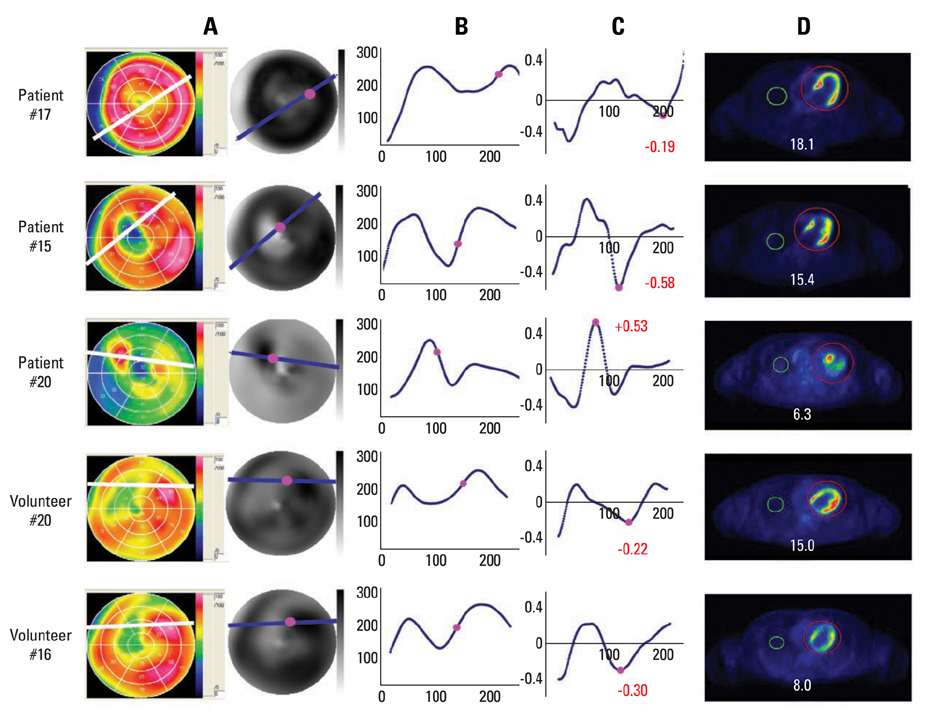
Fig. 1 Representative images of cardiac FDG-PET and Smax in patients with myocardial ischemic event as well as healthy volunteers. Myocardium in patient #17 was defined as viable by an echocardiogram under low dose of dobutamine stress. Myocardium in patient #15 and #20 were defined as not viable. (A) FDG bull's eye mapping (colored and gray scaled). Low uptake regions were observed in both patients (#17, #15, and #20) and healthy volunteers (#20 and #16). (B) FDG plot profile along white and blue lines in the panel A. (C) Changing rate of FDG gray scale per pixel along the line. Absolute values (red) indicate Smax values. The pink dots in the panels A, B, and C indicate the location of Smax. (D) Hmax/Lmax values are shown. FDG, cardiac 2-[F-18] fluoro-2-deoxy-D-glucose; PET, positron emission tomegraphy.
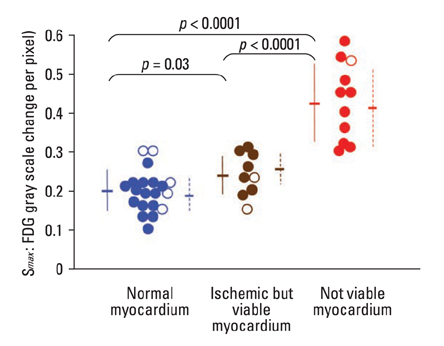
Fig. 2 Difference of Smax in three myocardial conditions. The Smax is the highest in the not viable myocardium (red circles), intermediate in ischemic but viable myocardium (brown circles), and the lowest in normal myocardium (blue circles). Closed circles and solid lines (mean ± SD): data from the subjects with Hmax/Lmax ≥10. Open circles: data of the subjects with Hmax/Lmax < 10. Dashed lines (mean ± SD) were analyzed by including all data (both Hmax/Lmax≥10 and <10).
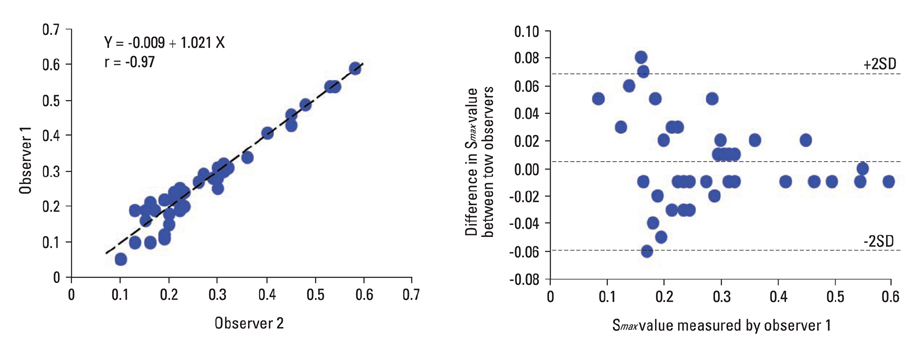
Fig. 3 Inter-observer variability of Smax values.
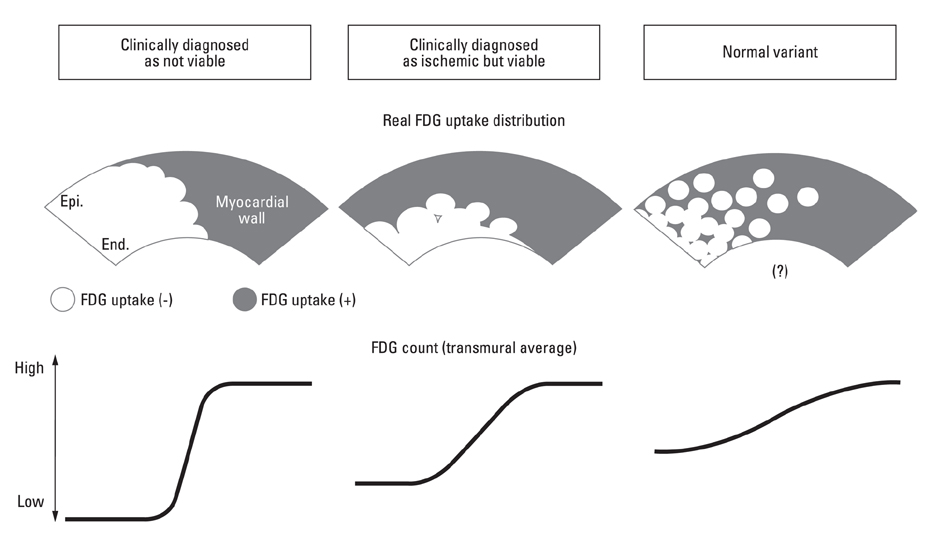
Fig. 4 Schematic diagram of real FDG uptake in the myocardial wall and FDG-PET count. Gray area: positive FDG uptake. White area: negative FDG uptake. Voxel size of the PET scanner in the present study was 3.3×3.3×3.3 mm3. FDG count is displayed as its average of that in the transmural wall. Steepness of the FDG slope at the border zone of the low uptake region is different for not viable myocardium, ischemic but viable myocardium, and normal variant (speculated). FDG, cardiac 2-[F-18] fluoro-2-deoxy-D-glucose; PET, positron emission tomegraphy.
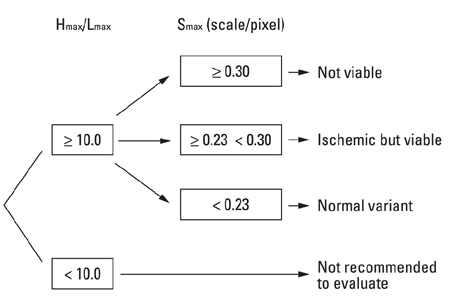
Fig. 5 Diagram of strategy to diagnose myocardial viability and discrimination of normal variant.
Reference
-
1. Baumgartner H, Porenta G, Lau YK, Wutte M, Klaar U, Mehrabi M, et al. Assessment of myocardial viability by dobutamine echocardiography, positron emission tomography and thallium-201 SPECT: correlation with histopathology in explanted hearts. J Am Coll Cardiol. 1998. 32:1701–1708.
Article2. Schelbert HR, Beanlands R, Bengel F, Knuuti J, Dicarli M, Machac J, et al. PET myocardial perfusion and glucose metabolism imaging: Part 2-Guidelines for interpretation and reporting. J Nucl Cardiol. 2003. 10:557–571.
Article3. Bax JJ, Fath-Ordoubadi F, Boersma E, Wijns W, Camici PG. Accuracy of PET in predicting functional recovery after revascularisation in patients with chronic ischaemic dysfunction: head-to-head comparison between blood flow, glucose utilisation and water-perfusable tissue fraction. Eur J Nucl Med Mol Imaging. 2002. 29:721–727.
Article4. Knuuti MJ, Nuutila P, Ruotsalainen U, Teräs M, Saraste M, Härkönen R, et al. The value of quantitative analysis of glucose utilization in detection of myocardial viability by PET. J Nucl Med. 1993. 34:2068–2075.5. Baer FM, Voth E, Deutsch HJ, Schneider CA, Horst M, de Vivie ER, et al. Predictive value of low dose dobutamine transesophageal echocardiography and fluorine-18 fluorodeoxyglucose positron emission tomography for recovery of regional left ventricular function after successful revascularization. J Am Coll Cardiol. 1996. 28:60–69.
Article6. Altehoefer C, Kaiser HJ, Dörr R, Feinendegen C, Beilin I, Uebis R, et al. Fluorine-18 deoxyglucose PET for assessment of viable myocardium in perfusion defects in 99mTc-MIBI SPET: a comparative study in patients with coronary artery disease. Eur J Nucl Med. 1992. 19:334–342.
Article7. Porenta G, Kuhle W, Czernin J, Ratib O, Brunken RC, Phelps ME, et al. Semiquantitative assessment of myocardial blood flow and viability using polar map displays of cardiac PET images. J Nucl Med. 1992. 33:1628–1636.8. Nekolla SG, Miethaner C, Nguyen N, Ziegler SI, Schwaiger M. Reproducibility of polar map generation and assessment of defect severity and extent assessment in myocardial perfusion imaging using positron emission tomography. Eur J Nucl Med. 1998. 25:1313–1321.9. Inglese E, Leva L, Matheoud R, Sacchetti G, Secco C, Gandolfo P, et al. Spatial and temporal heterogeneity of regional myocardial uptake in patients without heart disease under fasting conditions on repeated whole-body 18F-FDG PET/CT. J Nucl Med. 2007. 48:1662–1669.
Article10. Choi Y, Brunken RC, Hawkins RA, Huang SC, Buxton DB, Hoh CK, et al. Factors affecting myocardial 2-[F-18]fluoro-2-deoxy-D-glucose uptake in positron emission tomography studies of normal humans. Eur J Nucl Med. 1993. 20:308–318.
Article11. Gropler RJ, Siegel BA, Lee KJ, Moerlein SM, Perry DJ, Bergmann SR, et al. Nonuniformity in myocardial accumulation of fluorine-18-fluorodeoxyglucose in normal fasted humans. J Nucl Med. 1990. 31:1749–1756.12. Schelbert HR. 18F-deoxyglucose and the assessment of myocardial viability. Semin Nucl Med. 2002. 32:60–69.13. Sawada S, Elsner G, Segar DS, O'Shaughnessy M, Khouri S, Foltz J, et al. Evaluation of patterns of perfusion and metabolism in dobutamine-responsive myocardium. J Am Coll Cardiol. 1997. 29:55–61.14. Ince C, Ashruf JF, Avontuur JA, Wieringa PA, Spaan JA, Bruining HA. Heterogeneity of the hypoxic state in rat heart is determined at capillary level. Am J Physiol. 1993. 264:H294–H301.
Article15. Matsumoto T, Goto M, Tachibana H, Ogasawara Y, Tsujioka K, Kajiya F. Microheterogeneity of myocardial blood flow in rabbit hearts during normoxic and hypoxic states. Am J Physiol. 1996. 270:H435–H441.16. Watanabe N, Akasaka T, Toyota E, Fujimoto K, Kajita T, Shigeto F, et al. Three-dimensional microstructural abnormality of the coronary capillary network after myocardial reperfusion--comparison between 'reflow' and 'no-reflow'. Circ J. 2004. 68:868–872.
Article17. Deussen A. Local myocardial glucose uptake is proportional to, but not dependent on blood flow. Pflugers Arch. 1997. 433:488–496.
Article18. Bacharach SL, Bax JJ, Case J, Delbeke D, Kurdziel KA, Martin WH, et al. PET myocardial glucose metabolism and perfusion imaging: Part 1-Guidelines for data acquisition and patient preparation. J Nucl Cardiol. 2003. 10:543–556.19. Bax JJ, Veening MA, Visser FC, van Lingen A, Heine RJ, Cornel JH, et al. Optimal metabolic conditions during fluorine-18 fluorodeoxyglucose imaging; a comparative study using different protocols. Eur J Nucl Med. 1997. 24:35–41.
- Full Text Links
-
- Actions
-
Cited
- CITED
-
- Close
- Share
-
- Similar articles
-
- Assessment of Viability in Regional Myocardium with Reversed Redistribution by Thallium Reinjection in Patients with Acute Myocardial Infarction
- Defect of 18F-FDG Uptake Observed in Infarcted Myocardium Showing Reverse Redistribution on Rest / 24-Hour Delayed 201Tl Myocardial SPECT after Acute Myocardial Infarction
- Evaluation by Contrast-Enhanced MR Imaging of the Lateral Border Zone in Reperfused Myocardial Infarction in a Cat Model
- One-stop Diagnosis of Ischemic Heart Disease Using Cardiac MRI
- Long-Acting Nitrate Single-Photon Emission Computed Tomography Myocardial Viability Study: A Serial Case Report
