Changes in Muscular Lipids in Unilateral Isolated Hypertrophy of Gastrocnemius Muscle Can Be Revealed by 1H MR Spectroscopy
- Affiliations
-
- 1Section on Experimental Radiology, Department of Diagnostic Radiology, University of Tuebingen, Hoppe-Seyler-Strasse 3, 72076 Tuebingen, Germany. fritz.schick@med.uni-tuebingen.de
- 2Department of Neurology, University of Tuebingen, Hoppe-Seyler-Strasse 3, 72076 Tuebingen, Germany.
- KMID: 1102561
- DOI: http://doi.org/10.3348/kjr.2009.10.6.581
Abstract
OBJECTIVE
To test whether proton magnetic resonance spectroscopy (1H-MRS) reveals changes in the lipid content of the gastrocnemius muscle (GM) and soleus muscle (SOL) of a patient with unilateral isolated hypertrophy of the right GM. MATERIALS AND METHODS: 1H-MRS was performed on a 1.5 Tesla (T) whole-body unit. Muscular lipids inside SOL and GM were assessed in both calves of the patient by a STEAM (stimulated echo acquisition mode) localization sequence. Results were compared to a control group of four healthy volunteers. RESULTS: Total amount of muscular lipids in the hypertrophic GM of the patient was clearly increased compared to the controls (38.7 versus 21.8+/-3.5 a.u.) while intramyocellular lipids of the adjacent SOL were lower compared to the contralateral healthy leg. CONCLUSION: Muscular lipids are substrates for metabolism and can be assessed non-invasively by 1H-MRS. 1H-MRS is considered to be a helpful tool in clinical assessment of muscle metabolism in cases with muscular hypo- or hypertrophy.
Keyword
MeSH Terms
Figure
-

Fig. 1 Axial T1-weighted image of lower legs performed in 13-year-old girl with unilateral hypertrophy of right calf. Right medial gastrocnemius muscle is hypertrophic, lateral portion shows slight augmentation. White boxes indicate voxel positions for spectroscopic examinations. A = right medial gastrocnemius muscle (GM), B = left GM, C = right soleus muscle (SOL), D = left SOL.
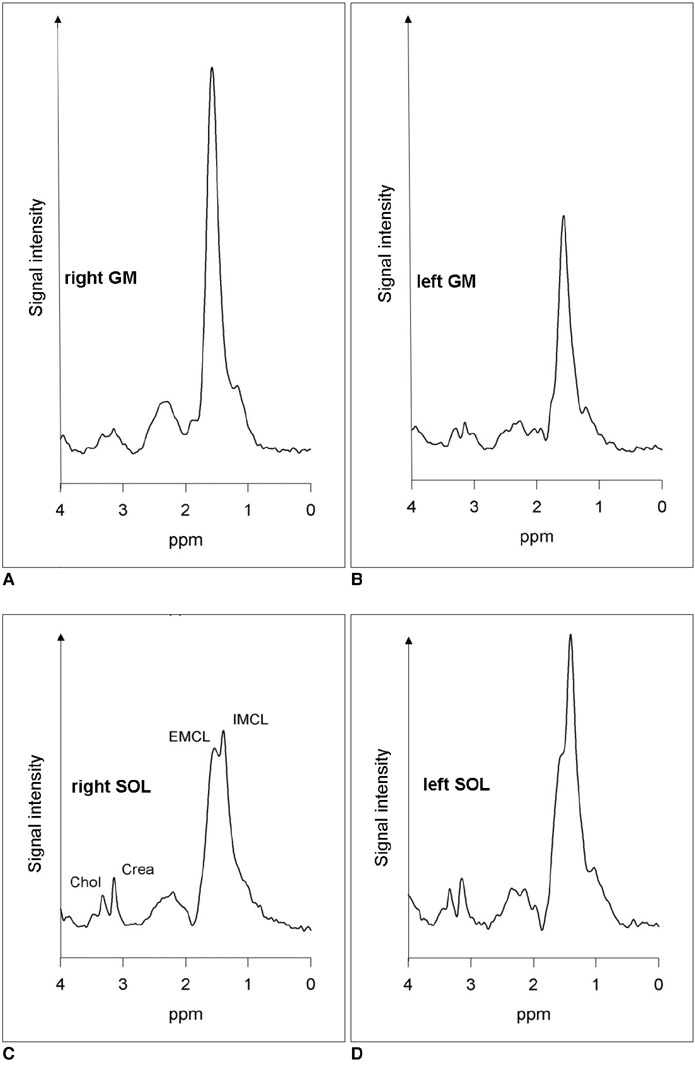
Fig. 2 1H-MRS of right (A) and left (B) GM and right (C) and left (D) SOL performed in 13-year-old girl with unilateral hypertrophy of right calf. Signals are indicated in C as Chol (choline; 3.4 ppm), Crea (creatine; 3.15 ppm), IMCL (intramyocellular lipids; 1.3-1.5 ppm), and EMCL (extramyocellular lipids; 1.5-1.7 ppm). Spectra are referenced on creatine signal of each muscle. Signal intensities are given in arbitrary units as usual in 1H-MRS. GM = gastrocnemius muscle, SOL = soleus muscle

Fig. 3 Comparison of total muscle lipid ratio between gastrocnemius muscle and soleus muscle, for normal controls (white diamonds) and patient (grey hexagons). Mean value of normal controls is indicated as black dot with 95%-intervals as error bars. Total muscle lipid-ratio of patient's right leg (with gastrocnemius muscle hypertrophy) is clearly above normal range. TML = total muscle lipid
Reference
-
1. Vahlensieck M, Genant HK, Reiser M, Winter P, Bollow M, Lang P. MRI of the musculoskeletal system. 2000. Stuttgart: Thieme;257–282.2. Olsen NJ, Qi J, Park JH. Imaging and skeletal muscle disease. Curr Rheumatol Rep. 2005. 7:106–114.3. Maurer J, Konstanczak P, Söllner O, Ehrenstein T, Knollmann F, Wolff R, et al. Muscle metabolism of professional athletes using 31P-spectroscopy. Acta Radiol. 1999. 40:73–77.4. Giannesini B, Cozzone PJ, Bendahan D. In vivo MR investigation of skeletal muscle function in small animals. MAGMA. 2004. 17:210–218.5. Schick F, Eismann B, Jung WI, Bongers H, Bunse M, Lutz O. Comparison of localized proton NMR signals of skeletal muscle and fat tissue in vivo: two lipid compartments in muscle tissue. Magn Reson Med. 1993. 29:158–167.6. Boesch C, Slotboom J, Hoppeler H, Kreis R. In vivo determination of intra-myocellular lipids in human muscle by means of localized 1H-MR-spectroscopy. Magn Reson Med. 1997. 37:484–493.7. Szczepaniak LS, Babcock EE, Schick F, Dobbins RL, Garg A, Burns DK, et al. Measurement of intracellular triglyceride stores by 1H spectroscopy: validation in vivo. Am J Physiol. 1999. 276:E977–E989.8. Henriksen O. MR spectroscopy in clinical research. Acta Radiol. 1994. 35:96–116.9. Weigert C, Thamer C, Brodbeck K, Guirguis A, Machicao F, Machann J, et al. The -913 G/A glutamine: fructose-6-phosphate aminotransferase gene polymorphism is associated with measures of obesity and intramyocellular lipid content in nondiabetic subjects. J Clin Endocrinol Metab. 2005. 90:1639–1643.10. Roden M. Muscle triglycerides and mito-chondrial function: possible mechanisms for the development of type 2 diabetes. Int J Obes (Lond). 2005. 29:S111–S115.11. Boesch C, Machann J, Vermathen P, Schick F. Role of proton MR for the study of muscle lipid metabolism. NMR Biomed. 2006. 19:968–988.12. Goff LM, Bell JD, So PW, Dornhorst A, Frost GS. Veganism and its relationship with insulin resistance and intramyocellular lipid. Eur J Clin Nutr. 2005. 59:291–298.13. Krssak M, Falk Petersen K, Dresner A, DiPietro L, Vogel SM, Rothman DL, et al. Intramyocellular lipid concentrations are correlated with insulin sensitivity in humans: a 1H NMR spectroscopy study. Diabetologia. 1999. 42:113–116.14. Jacob S, Machann J, Rett K, Brechtel K, Volk A, Renn W, et al. Association of increased intramyocellular lipid content with insulin resistance in lean nondiabetic offspring of type 2 diabetic subjects. Diabetes. 1999. 48:1113–1119.15. Brechtel K, Niess AM, Machann J, Rett K, Schick F, Claussen CD, et al. Utilisation of intramyocellular lipids (IMCLs) during exercise as assessed by proton magnetic resonance spectroscopy (1H-MRS). Horm Metab Res. 2001. 33:63–66.16. Nakae I, Mitsunami K, Matsuo S, Horie M. Creatine depletion and altered fatty acid metabolism in diseased human hearts: clinical investigation using 1H magnetic resonance spectroscopy and 123I BMIPP myocardial scintigraphy. Acta Radiol. 2007. 48:436–443.17. Zehnder M, Christ ER, Ith M, Acheson KJ, Pouteau E, Kreis R, et al. Intramyocellular lipid stores increase markedly in athletes after 1.5 days lipid supplementation and are utilized during exercise in proportion to their content. Eur J Appl Physiol. 2006. 98:341–354.18. Vermathen P, Kreis R, Boesch C. Distribution of intramyocellular lipids in human calf muscles as determined by MR spectroscopic imaging. Magn Reson Med. 2004. 51:253–262.19. Petersilge CA, Pathria MN, Gentili A, Recht MP, Resnick D. Denervation hypertrophy of muscle: MR features. J Comput Assist Tomogr. 1995. 19:596–600.20. De Beuckeleer L, Vanhoenacker F, De Schepper A Jr, Seynaeve P, De Schepper A. Hypertrophy and pseudohypertrophy of the lower leg following chronic radiculopathy and neuropathy: imaging findings in two patients. Skeletal Radiol. 1999. 28:229–232.21. Merkli H, Pál E, Gáti I. Asymmetric calf hypertrophy of neurogenic origin. Pathol Oncol Res. 2006. 12:254–256.22. Wessig C, Kenn W, Koltzenburg M, Bendszus M. Denervation hypertrophy may mimic local tumor spread on magnetic resonance imaging. Muscle Nerve. 2006. 34:108–110.23. Narayana PA, Slopis JM, Jackson EF, Jankovic J, Butler IJ. Proton magnetic resonance spectroscopic studies of hypertrophied muscle. Effect of botulinum toxin treatment. Invest Radiol. 1991. 26:58–64.
- Full Text Links
-
- Actions
-
Cited
- CITED
-
- Close
- Share
-
- Similar articles
-
- In vivo H MR spectroscopy of human brain in six normal volunteers
- Localized, water-suppressed in vivo H MR spectroscopy of human brain tumors: Preliminary results
- Progressive Multifocal Leucoencephalopathy Isolated to Posterior Fossa in a Patient with AIDS: DWI and 1H-MRS Features
- Calf Reduction Using Radiofrequency(RF) Directed to the Gastrocnemius Muscle
- A Case of Spinal Muscular Atrophy with Hypertrophy of Calf-Muscles
