Perfusion MR Imaging in Gliomas: Comparison with Histologic Tumor Grade
- Affiliations
-
- 1Gyeongsang Natl Univ Hosp, Dept Radiol, 90 Chiram Dong, Jinju si 660702, South Korea.
- KMID: 754116
- DOI: http://doi.org/10.3348/kjr.2001.2.1.1
Abstract
OBJECTIVE
To determine the usefulness of perfusion MR imaging in assessing the histologic grade of cerebral gliomas. MATERIALS AND METHODS: In order to determine relative cerebral blood volume (rCBV), 22 patients with pathologically proven gliomas (9 glioblastomas, 9 anaplastic gliomas and 4 low-grade gliomas) underwent dynamic contrast-enhanced T2*-weighted and conventional T1- and T2-weighted imaging. rCBV maps were obtained by fitting a gamma-variate function to the contrast material concentration versus time curve. rCBV ratios between tumor and normal white matter (maximum rCBV of tumor / rCBV of contralateral white matter) were calcu-lated and compared between glioblastomas, anaplastic gliomas and low-grade gliomas. RESULTS: Mean rCBV ratios were 4.90'+/-1.01 for glioblastomas, 3.97'+/-0.56 for anaplastic gliomas and 1.75'+/-1.51 for low-grade gliomas, and were thus sig-nificantly different; p < .05 between glioblastomas and anaplastic gliomas, p <.05 between anaplastic gliomas and low-grade gliomas, p < .01 between glioblas-tomas and low-grade gliomas. The rCBV ratio cutoff value which permitted dis-crimination between high-grade (glioblastomas and anaplastic gliomas) and low-grade gliomas was 2.60, and the sensitivity and specificity of this value were 100% and 75%, respectively. CONCLUSION: Perfusion MR imaging is a useful and reliable technique for esti-mating the histologic grade of gliomas.
Keyword
MeSH Terms
Figure
-
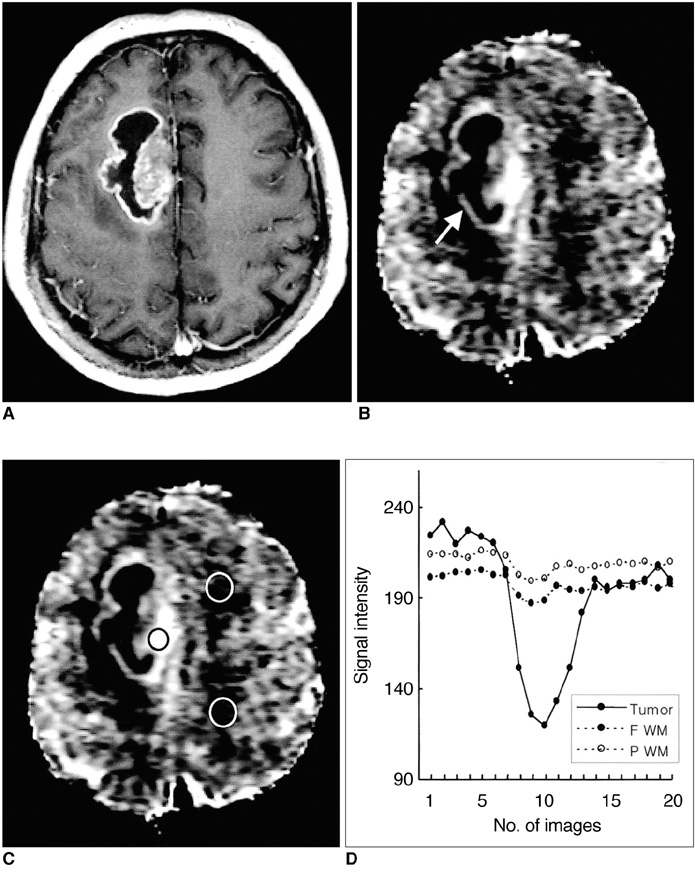
Fig. 1 Case 7: Glioblastoma in a 47-year-old man. A. Postcontrast T1-weighted image shows a ring-enhancing necrotic tumor in the right frontal lobe. B. Relative cerebral blood volume (rCBV) map shows high rCBV in the solid portion of the tumor (arrow). The higher signal on the rCBV map represents a higher rCBV. C. rCBV map shows the placement of ROIs for measurement of rCBV in the tumor (black circle) and in contralateral frontal and parietal white matter (white circles). D. Signal intensity-time curves measured at ROIs in C show different patterns of signal reduction between tumor and normal white matter during the transit of contrast material. Remarkable reduction of signal intensity is noted in the tumor compared to normal white matter, suggesting tumor hypervascularity.
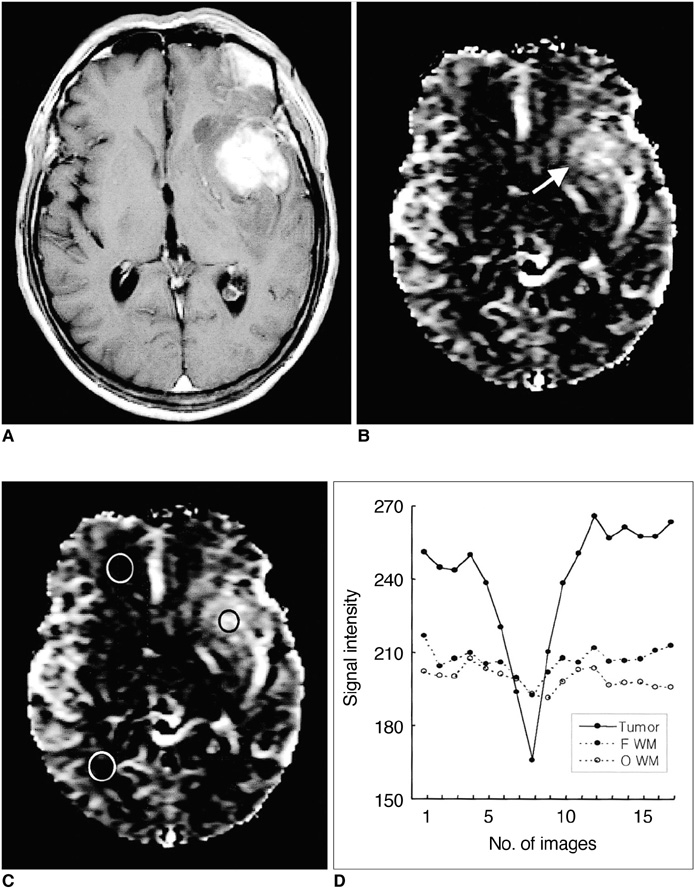
Fig. 2 Case 15: Anaplastic oligodendroglioma in a 56-year-old man. A. Postcontrast T1-weighted image shows a strongly enhancing solid tumor in the left basal ganglia. B. Relative cerebral blood volume (rCBV) map shows heterogeneously increased rCBV in the tumor (arrow). C. rCBV map shows the placement of ROIs for measurement of rCBV in the tumor (black circle) and in contralateral frontal and occipital white matter (white circles). D. Signal intensity-time curves measured at ROIs in C show different patterns of signal reduction between tumor and normal white matter, suggesting tumor hypervascularity.
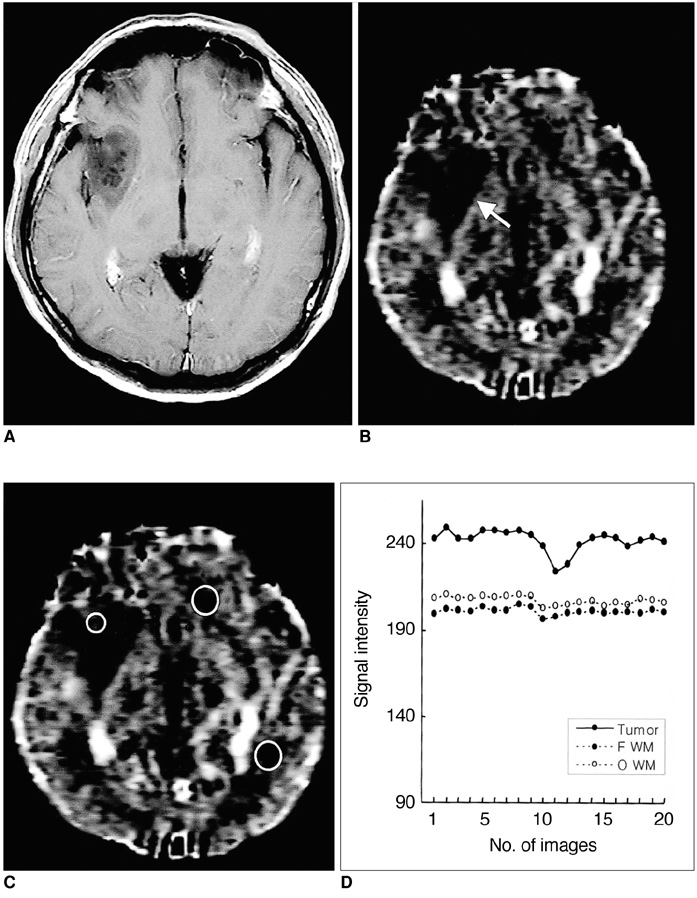
Fig. 3 Case 19: Low-grade astrocytoma in a 41-year-old man. A. Postcontrast T1-weighted image shows a non-enhancing low signal intensity tumor in the right basal ganglia. B. Relative cerebral blood volume (rCBV) map shows low rCBV in the tumor (arrow). C. rCBV map shows the placement of ROIs for measurement of rCBV in the tumor (small circle) and in contralateral frontal and occipital white matter (large circles). D. Signal intensity-time curves measured at ROIs in C show less signal reduction in this tumor than in the high-grade gliomas seen in Figs. 1 and 2, suggesting that the vascularity of an astrocytoma is lower.
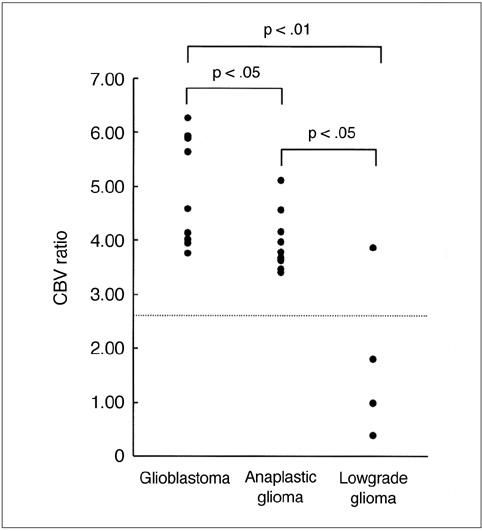
Fig. 4 Plot of relative cerebral blood volume (rCBV) ratios in glioblastomas, anaplastic gliomas and low-grade gliomas. The rCBV ratio is highest in glioblastomas and lowest in low-grade gliomas. A comparison of mean rCBV ratios in each tumor group shows statistically significant differences between them. The dotted horizontal line represents the rCBV ratio cutoff value (2.60) which permitted discrimination between high-grade (glioblastomas and anaplastic gliomas) and low-grade gliomas.
Cited by 1 articles
-
Magnetic Resonance Imaging: Historical Overview, Technical Developments, and Clinical Applications
Geon-Ho Jahng, Soonchan Park, Chang-Woo Ryu, Zang-Hee Cho
Prog Med Phys. 2020;31(3):35-53. doi: 10.14316/pmp.2020.31.3.35.
Reference
-
1. Russell D, Rubinstein L. Rubinstein LJ, editor. Tumours of central neuroepithelial origin. Pathology of tumours of the central nervous system. 1989. Baltimore, Md.: Williams & Wilkins;83–350.2. Van Kirk OC, Cornell SH, Jacoby CG. Posterior fossa intraaxial tumors: a comparision of computed tomography with other imaging methods. J Comput Assist Tomogr. 1979. 3:31–39.3. Joyce P, Bentson J, Takahashi M, Winter J, Wilson G, Byrd S. The accuracy of predicting histologic grades of supratentorial astrocytomas on the basis of computerized tomography and cerebral angiography. Neuroradiology. 1978. 16:346–348.4. Seeger JF, Burke DP, Knake JE, Gabrielsen TO. Computed tomographic and angiographic evaluation of hemangioblastoma. Radiology. 1981. 138:65–73.5. Aronen HJ, Gazit IE, Louis DN, et al. Cerebral blood volume maps of gliomas: comparision with tumor grade and histologic findings. Radiology. 1994. 191:41–51.6. Edelman RR, Mattle HP, Atkinson DJ, et al. Cerebral blood flow: assessment with dynamic contrast-enhanced T2*-weighted MR imaging at 1.5T. Radiology. 1990. 176:211–220.7. Rosen BR, Belliveau JW, Aronen HJ, et al. Susceptibility contrast imaging of cerebral blood volume: human experience. Magn Reson Med. 1991. 22:293–299.8. Aronen HJ, Cohen MS, Belliveau JW, Fordham JA, Rosen BR. Ultrafast imaging of brain tumors. Top Magn Reson Imaging. 1993. 5:14–24.9. Le Bihan D, Douek P, Argyropoulou M, Turner R, Patronas N, Fulham M. Diffusion and perfusion magnetic resonance imaging in brain tumors. Top Magn Reson Imaging. 1993. 5:25–31.10. Maeda M, Itoh S, Kimura H, et al. Tumor vascularity in the brain: evaluation with dynamic susceptibility-contrast MR imaging. Radiology. 1993. 189:233–238.11. Maeda M, Itoh S, Kimura H, et al. Vascularity of meningioma and neuroma: assessment with dynamic susceptibility-contrast MR imaging. AJR. 1994. 163:181–186.12. Kim JS, Lee GK, Kim JH, et al. Blood volume of intraaxial brain tumor: evaluation with dynamic contrast-enhanced T2*-weighted MR imaging. J Korean Radiol Soc. 1997. 37:783–788.13. Kim HD, Chang KH, Song IC, et al. Perfusion MR imaging of the brain tumor: preliminary report. J Korean Soc Magn Reson Med. 1997. 1:119–124.14. Choi JY, Sun JS, Kim SY, et al. Effect of steroid on brain tumors and surround edemas: observation with regional cerebral blood volume (rCBV) maps of perfusion MRI. J Korean Radiol Soc. 2000. 42:15–21.15. Sugahara T, Korogi Y, Kochi M, et al. Correlation of MR imaging-determined cerebral blood volume maps with histologic and angiographic determination of vascularity of gliomas. AJR. 1998. 171:1479–1486.16. Knopp EA, Cha S, Johnson G, et al. Glial neoplasms: dynamic contrast-enhanced T2*-weighted MR imaging. Radiology. 1999. 211:791–798.17. Kleihues P, Burger PC, Scheithauer BW. Histologic typing of tumours of the central nervous system. 1993. 2nd ed. Berlin, Germany: Springer-Verlag;11–30.18. Thompson HK, Starmer CF, Whalen RE, McIntosh HD. Indicator transit time considered as a gamma variate. Circ Res. 1964. 14:502–515.19. Benner T, Heiland S, Erb G, Forsting M, Sartor K. Accuracy of gamma-variate fits to concentration-time curves from dynamic susceptibility-contrast MRI: influence of time resolution, maximal signal drop and signal-to-noise. Magn Reson Imaging. 1997. 15:307–317.20. Rosen BR, Belliveau JW, Vevea JM, et al. Perfusion MR imaging with NMR contrast agents. Magn Reson Med. 1990. 14:249–265.21. Brem S, Cotran R, Folkman J. Tumor angiogenesis: a quantitative method for histologic grading. J Natl Cancer Inst. 1972. 48:347–356.22. Edelman RR, Siewert B, Darby DG, et al. Quantitative mapping of cerebral blood flow and functional localization with echo-planar MR imaging and signal targeting with alternating radiofrequency. Radiology. 1994. 192:513–520.23. Belliveau JW, Rosen BR, Kantor HL, et al. Functional cerebral imaging by susceptibility contrast NMR. Magn Reson Med. 1990. 14:538–546.24. Gückel F, Brix G, Rempp K, Deimling M, Rother J, Georgi M. Assessment of cerebral blood volume with dynamic susceptibility contrast enhanced gradient echo imaging. J Comput Assist Tomogr. 1994. 18:344–351.25. Wenz F, Rempp K, Hess T, et al. Effect of radiation on blood volume in low-grade astrocytomas and normal brain tissue: quantification with dynamic susceptibility contrast MR imaging. AJR. 1996. 166:187–193.26. Cha S, Knopp EA, Johnson G, et al. Dynamic contrast-enhanced T2*-weighted MR imaging of recurrent malignant gliomas treated with thalidomide and carboplatin. AJNR. 2000. 21:881–890.27. Sugahara T, Korogi Y, Tomiguchi S, et al. Posttherapeutic intraaxial brain tumor: the value of perfusion-sensitive contrast-enhanced MR imaging for differentiating tumor recurrence from nonneoplastic contrast-enhancing tissue. AJNR. 2000. 21:901–909.
- Full Text Links
-
- Actions
-
Cited
- CITED
-
- Close
- Share
-
- Similar articles
-
- Perfusion MR Imaging of Cerebral Gliomas: Comparison with Histologic Tumor Grade
- Perfusion MR Imaging: Clinical Utility for the Differential Diagnosis of Various Brain Tumors
- A Study of Vascularity in Brain Tumors using Perfusion MR Imaging
- The Usefulness of Diffusion-tensor MR Imaging (DTI) in the Grading of Gliomas
- The Usefulness of Perfusion MR Imaging in Patients with Brain Tumors
