Drawing Guideline for JKMS Manuscripts (03): Pyramid Charts
- Affiliations
-
- 1Department of Orthopedic Surgery, Seoul Sacred Heart General Hospital, Seoul, Korea
- KMID: 2530109
- DOI: http://doi.org/10.3346/jkms.2022.37.e166
Abstract
- The appropriate plot effectively conveys the author’s conclusions to the readers. Journal of Korean Medical Science (JKMS) will provide a series of special articles to show you how to make consistent and excellent plots more easily. In this article, we will cover pyramid charts. A pyramid chart is a simple yet popular tool for looking at the structure of a population by age and gender. Other variables can also be applied. This article helps researchers use these charts more easily by introducing effective tools and explaining how to use them.
Keyword
Figure
-
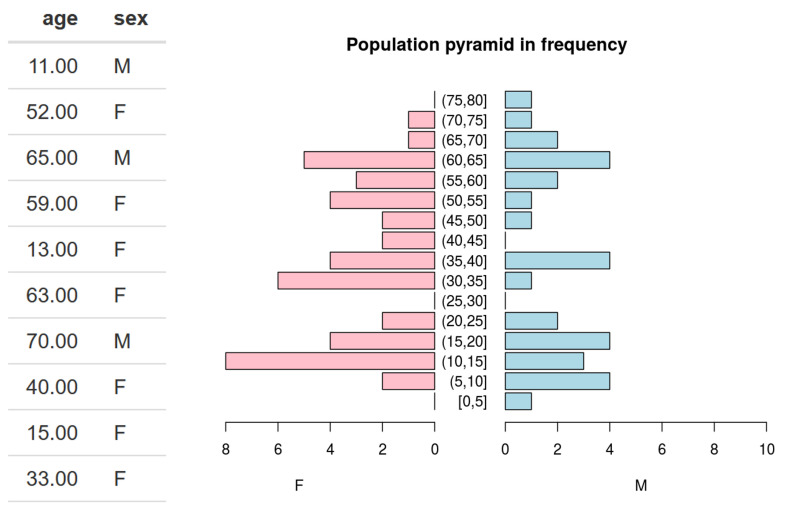
Fig. 1 Basic example of a pyramid chart.
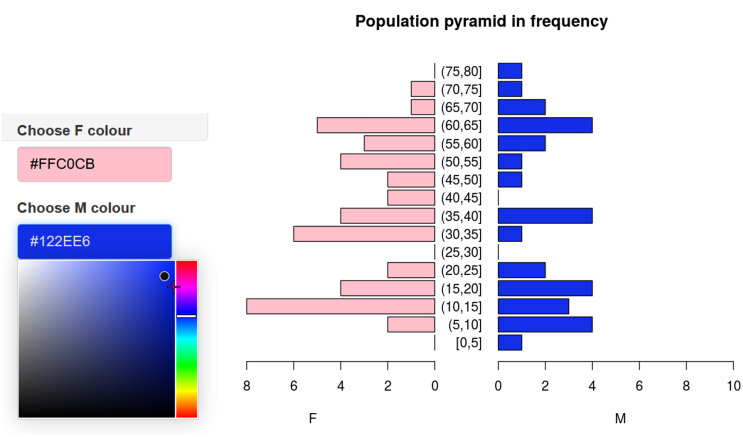
Fig. 2 Colors can be adjusted by author’s preference.
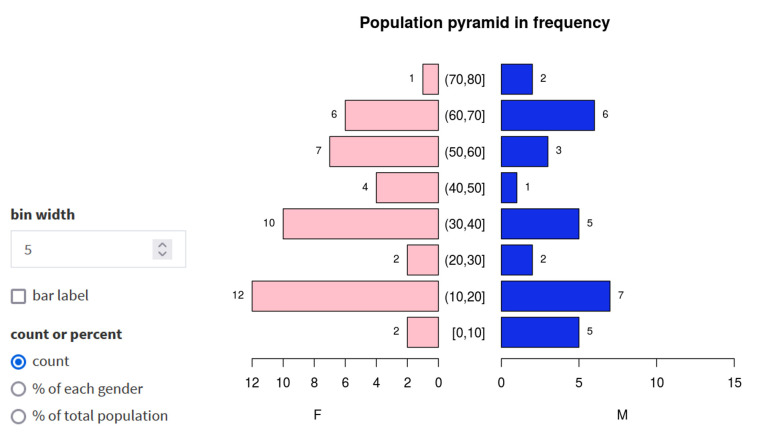
Fig. 3 Age intervals can be adjusted using ‘bin width.’ Bar labels can also be specified.
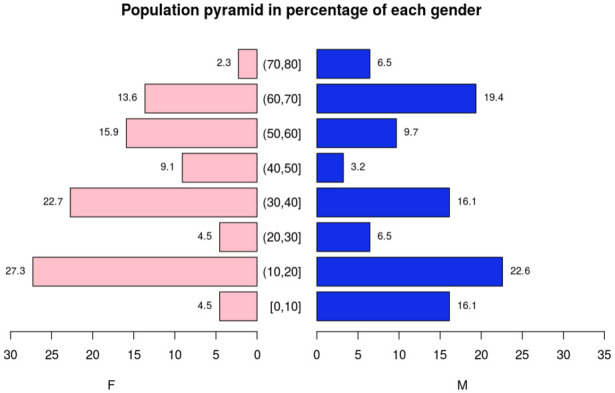
Fig. 4 Percentage of each subgroup can be also specified as needed.
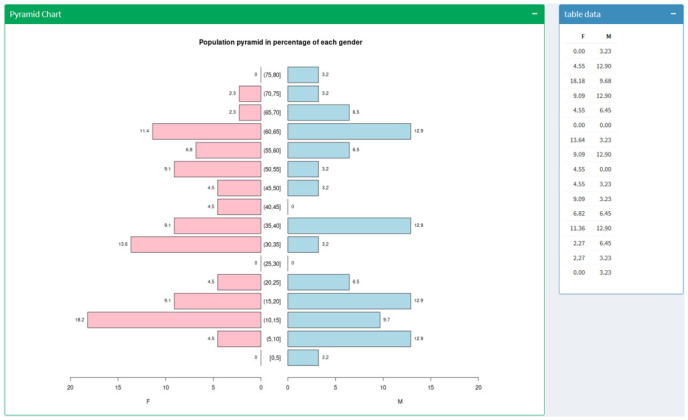
Fig. 5 Bar labels are displayed as a table on the right for further uses.
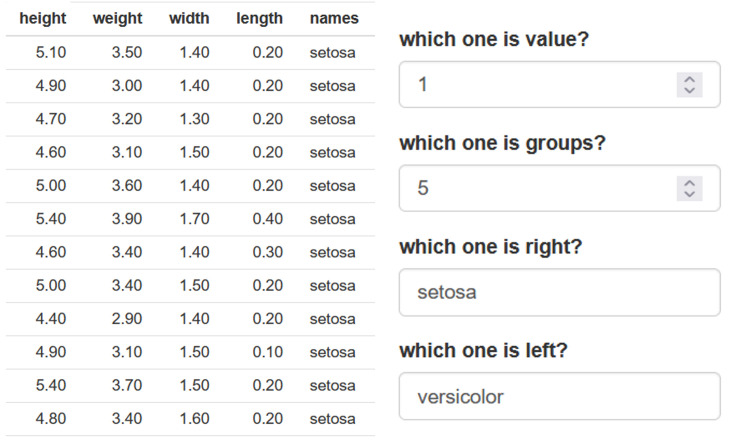
Fig. 6 The 2nd tool is for considering additional variables.
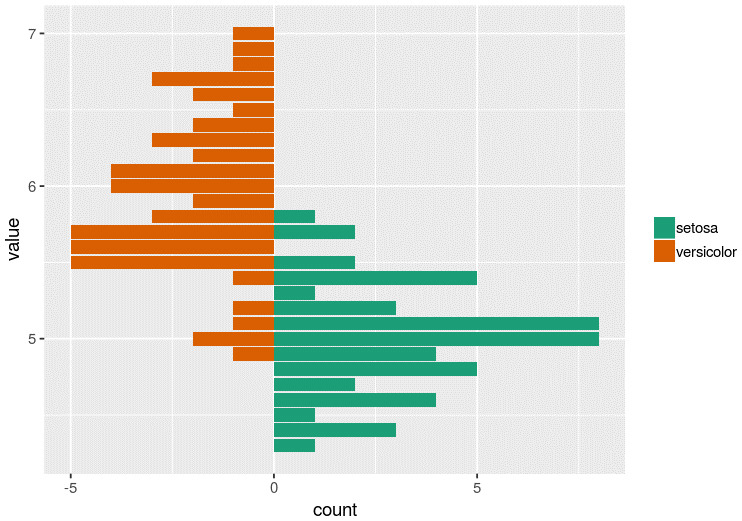
Fig. 7 Pyramid chart in the form of a histogram.
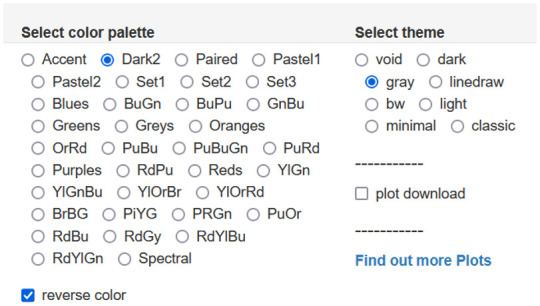
Fig. 8 Colors can be adjusted as needed.
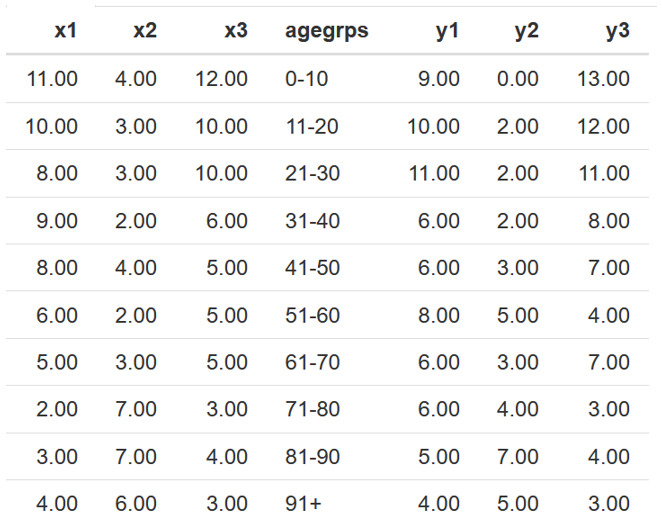
Fig. 9 The purpose of the 3rd tool is to specify additional data of each age subgroup.
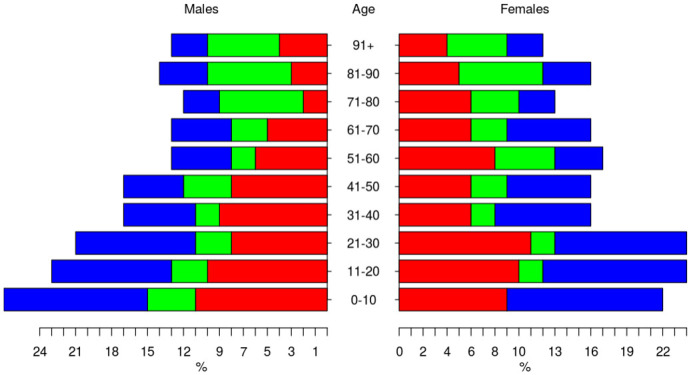
Fig. 10 Additional distributional data of each age subgroup specified.
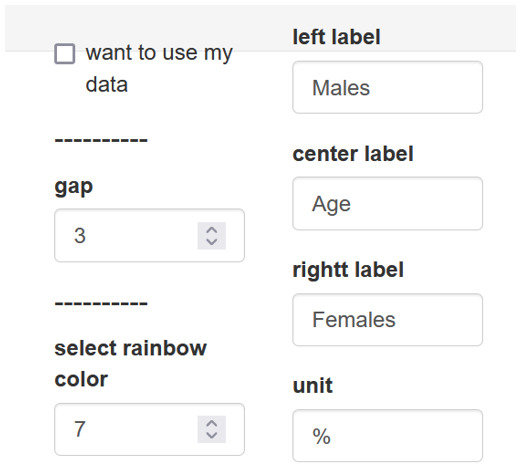
Fig. 11 Labels can be replaced as needed.
Fig. 12 Example data for the 3rd tool.
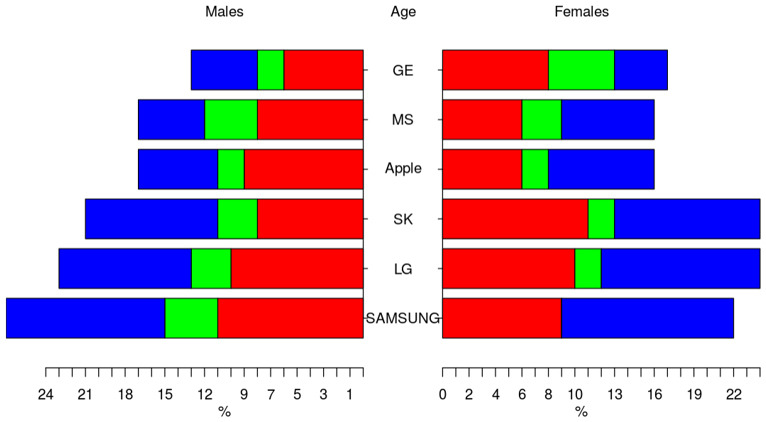
Fig. 13 Final chart shows variables within various age groups.

Fig. 14 Example of color palette on selecting rainbow color as 7.
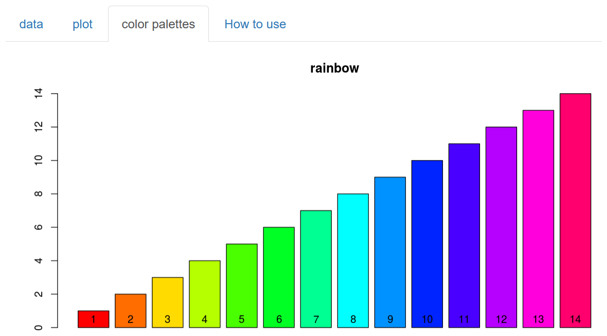
Fig. 15 Example of color palette on selecting rainbow color as 14.
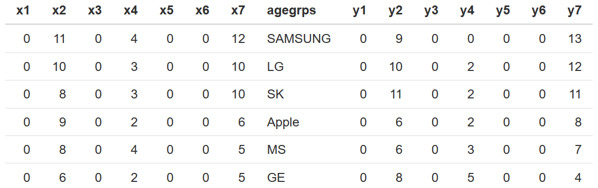
Fig. 16 Enter data as 0 where bar is not required.
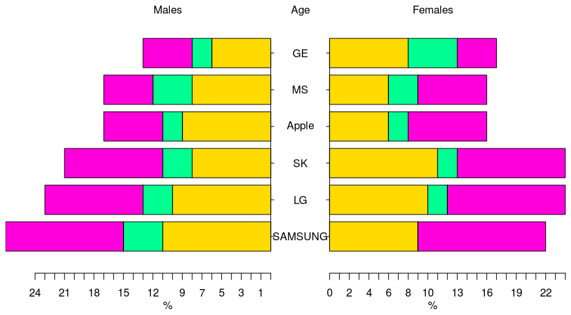
Fig. 17 Final chart with previously chosen colors.
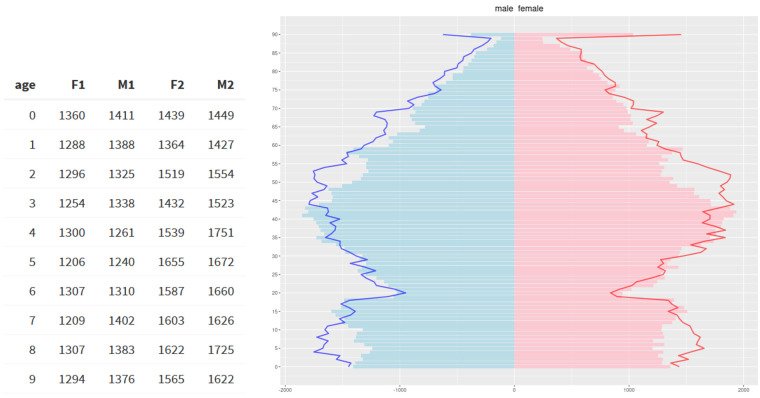
Fig. 18 The 4th tool is for comparing 2 demographic data as bar and line charts.
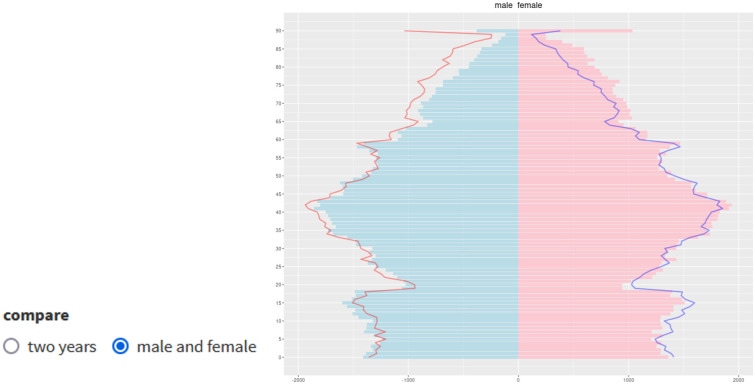
Fig. 19 Comparison between gender can be also shown as needed.
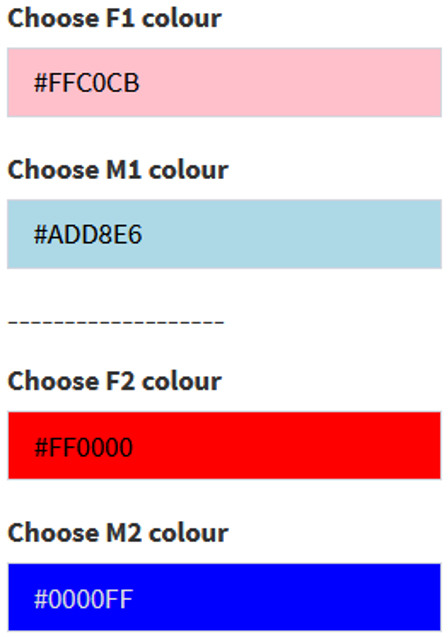
Fig. 20 Adjust color as needed.

Fig. 21 Plots can be downloaded as author’s needs.
Cited by 1 articles
-
Drawing Guideline for
JKMS Manuscripts (05): Plots for Numeric Data
Jeehyoung Kim, Jung Soo Lee, Won Jun Choi
J Korean Med Sci. 2023;38(22):e190. doi: 10.3346/jkms.2023.38.e190.
- Full Text Links
-
- Actions
-
Cited
- CITED
-
- Close
- Share
-
- Similar articles
-
- Drawing Guideline for JKMS Manuscripts (03): Plots for Categorical Data
- Drawing Guideline for JKMS Manuscripts (06): Scatter Plot
- Drawing Guideline for JKMS Manuscripts (05): Plots for Numeric Data
- Drawing Guideline for JKMS Manuscript (01) Kaplan-Meier Curve and Survival Analysis
- Plagiarism Continues to Affect Scholarly Journals
