Applying the OMOP Common Data Model to Facilitate Benefit-Risk Assessments of Medicinal Products Using Real-World Data from Singapore and South Korea
- Affiliations
-
- 1Vigilance & Compliance Branch, Health Products Regulation Group, Health Sciences Authority, Singapore
- 2Department of Biomedical Informatics, Ajou University School of Medicine, Suwon, Korea
- 3Department of Biomedical Sciences, Graduate School of Medicine, Ajou University, Suwon, Korea
- 4Health Services and Systems Research, Duke-NUS Medical School, Singapore
- 5Department of Pharmacy, Khoo Teck Puat Hospital, Singapore
- KMID: 2529793
- DOI: http://doi.org/10.4258/hir.2022.28.2.112
Abstract
Objectives
The aim of this study was to characterize the benefits of converting Electronic Medical Records (EMRs) to a common data model (CDM) and to assess the potential of CDM-converted data to rapidly generate insights for benefit-risk assessments in post-market regulatory evaluation and decisions.
Methods
EMRs from January 2013 to December 2016 were mapped onto the Observational Medical Outcomes Partnership-CDM (OMOP-CDM) schema. Vocabulary mappings were applied to convert source data values into OMOP-CDM-endorsed terminologies. Existing analytic codes used in a prior OMOP-CDM drug utilization study were modified to conduct an illustrative analysis of oral anticoagulants used for atrial fibrillation in Singapore and South Korea, resembling a typical benefit-risk assessment. A novel visualization is proposed to represent the comparative effectiveness, safety and utilization of the drugs.
Results
Over 90% of records were mapped onto the OMOP-CDM. The CDM data structures and analytic code templates simplified the querying of data for the analysis. In total, 2,419 patients from Singapore and South Korea fulfilled the study criteria, the majority of whom were warfarin users. After 3 months of follow-up, differences in cumulative incidence of bleeding and thromboembolic events were observable via the proposed visualization, surfacing insights as to the agent of preference in a given clinical setting, which may meaningfully inform regulatory decision-making.
Conclusions
While the structure of the OMOP-CDM and its accessory tools facilitate real-world data analysis, extending them to fulfil regulatory analytic purposes in the post-market setting, such as benefit-risk assessments, may require layering on additional analytic tools and visualization techniques.
Figure
-
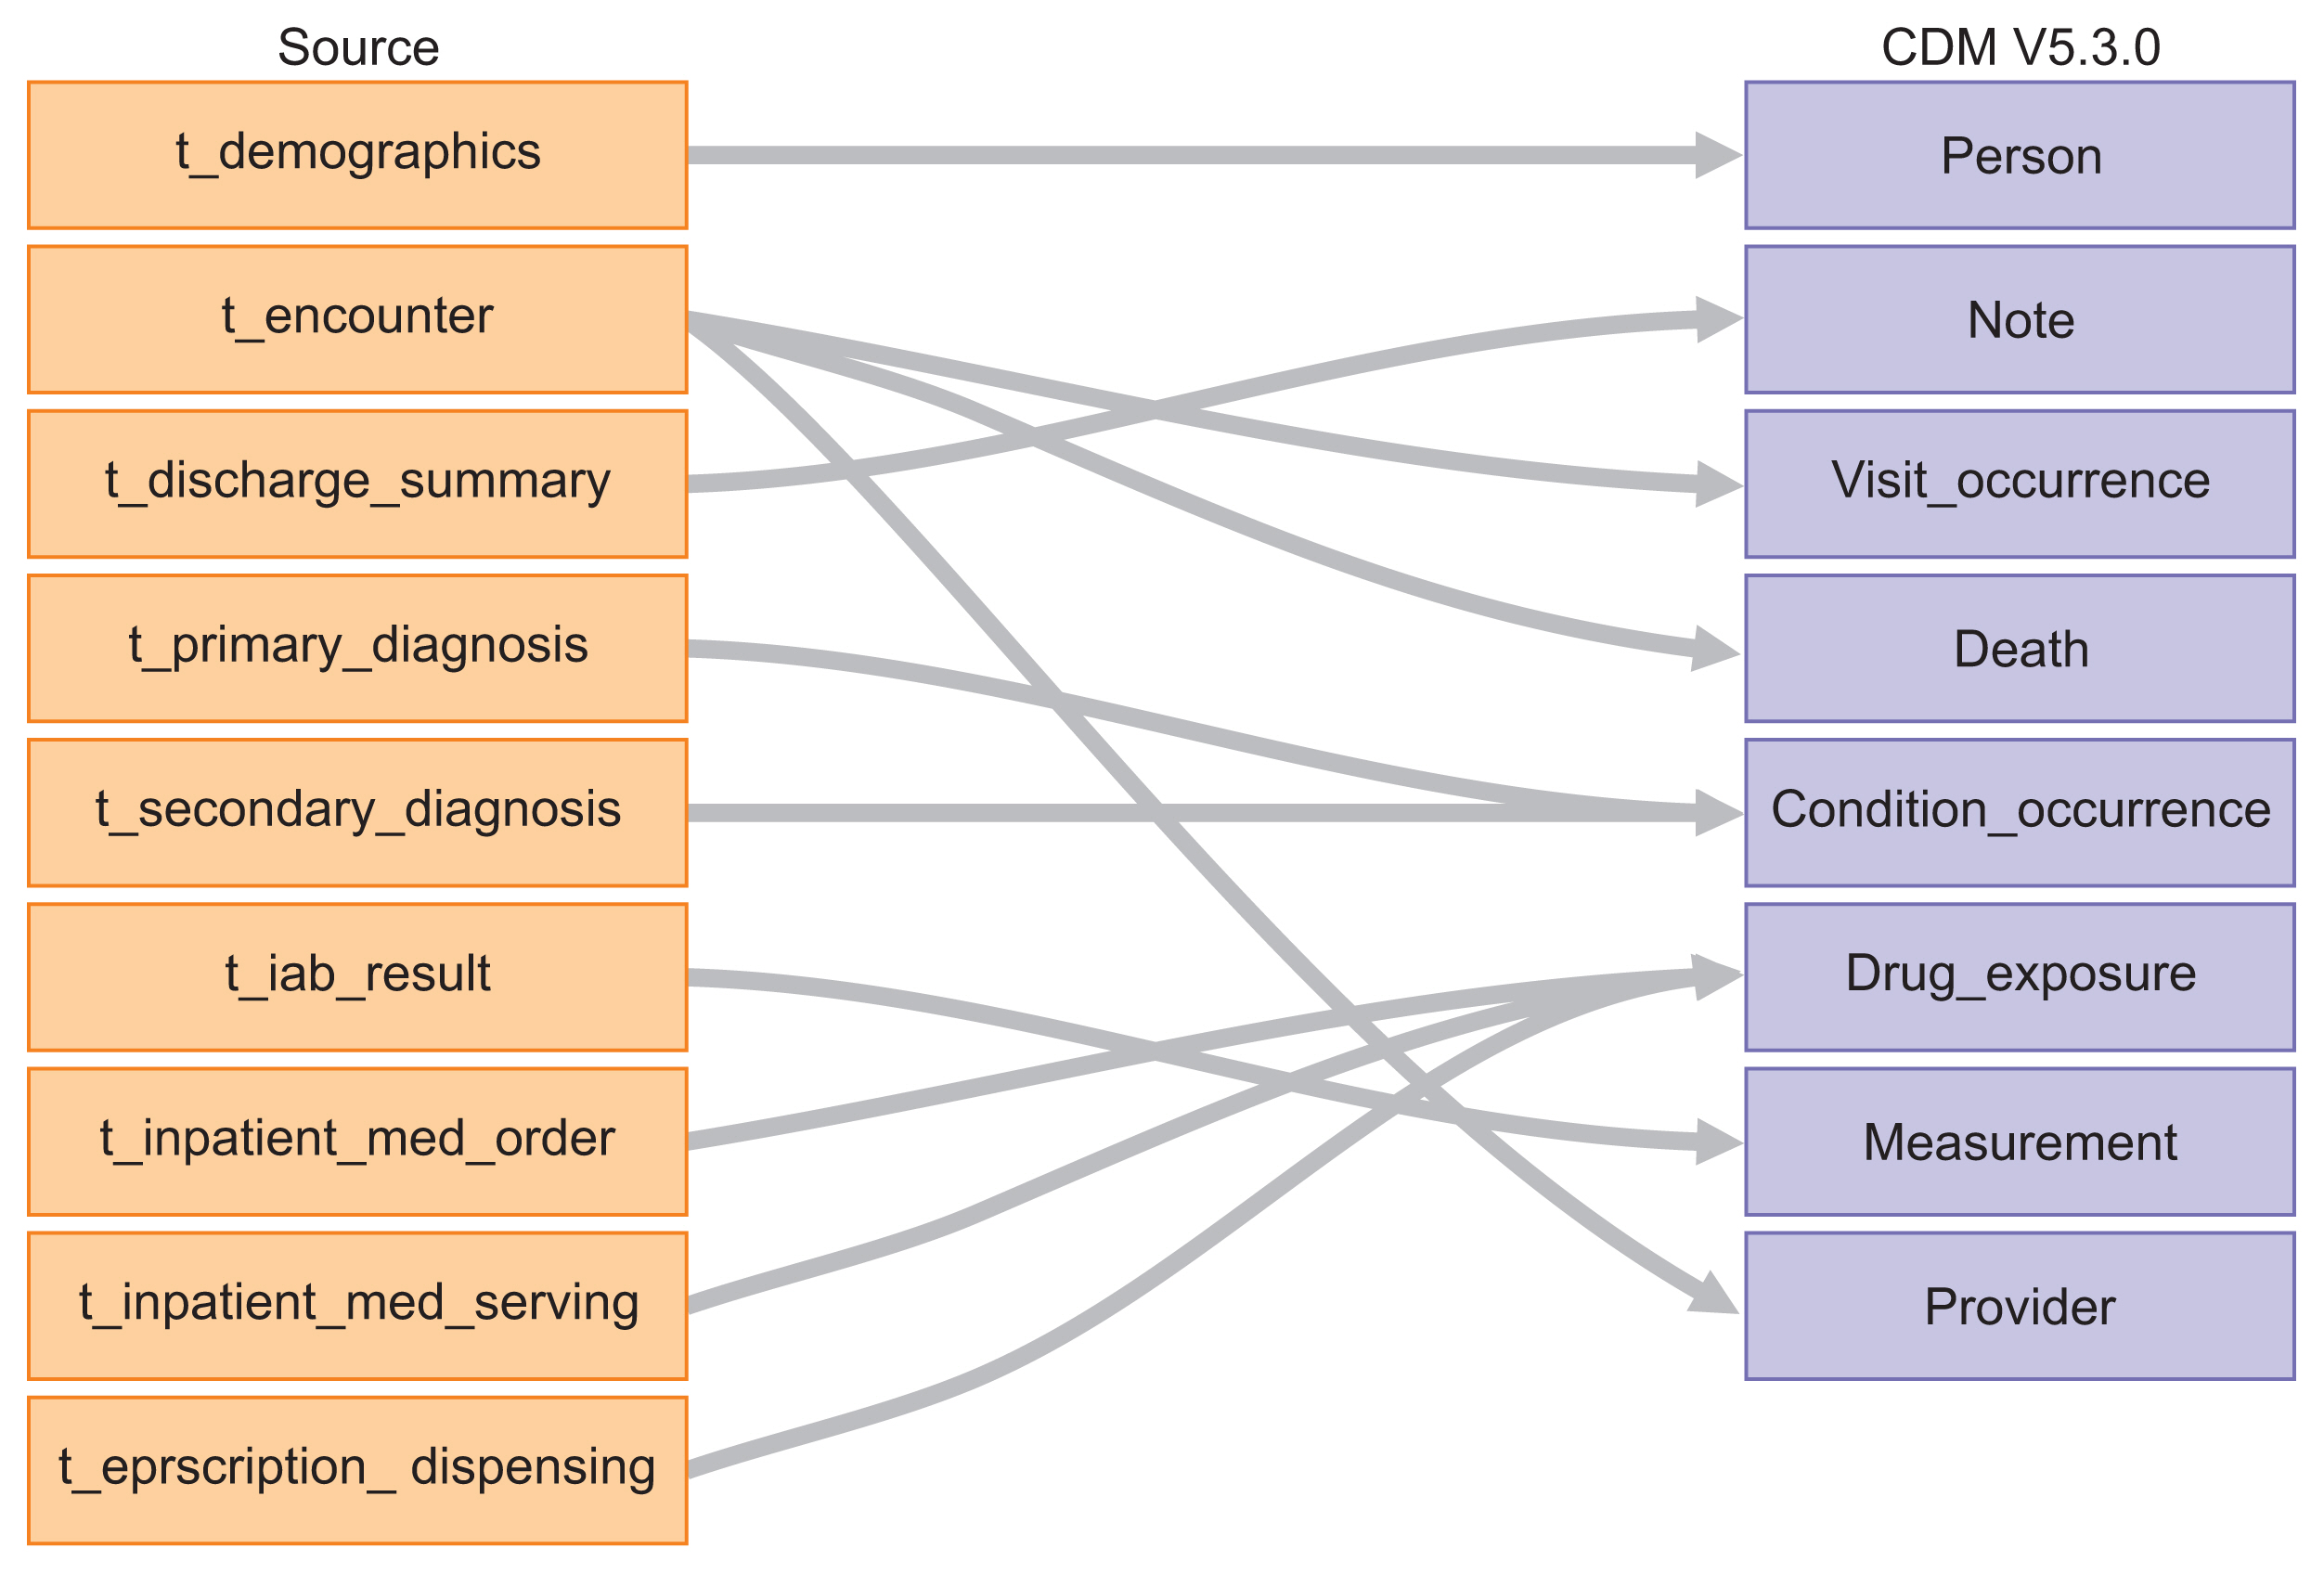
Figure 1 Mapping from source database to target database generated by the Observational Health Data Sciences Initiative (OHDSI) Rabbit-In-a-Hat tool. CDM: common data model.

Figure 2 Example of mapping from local concepts to concepts in the Observational Medical Outcomes Partnership (OMOP) vocabulary. ICD-10: International Classification of Diseases 10th edition, SNOMED-CT: Systematic Nomenclature of Medicine Clinical Terms.
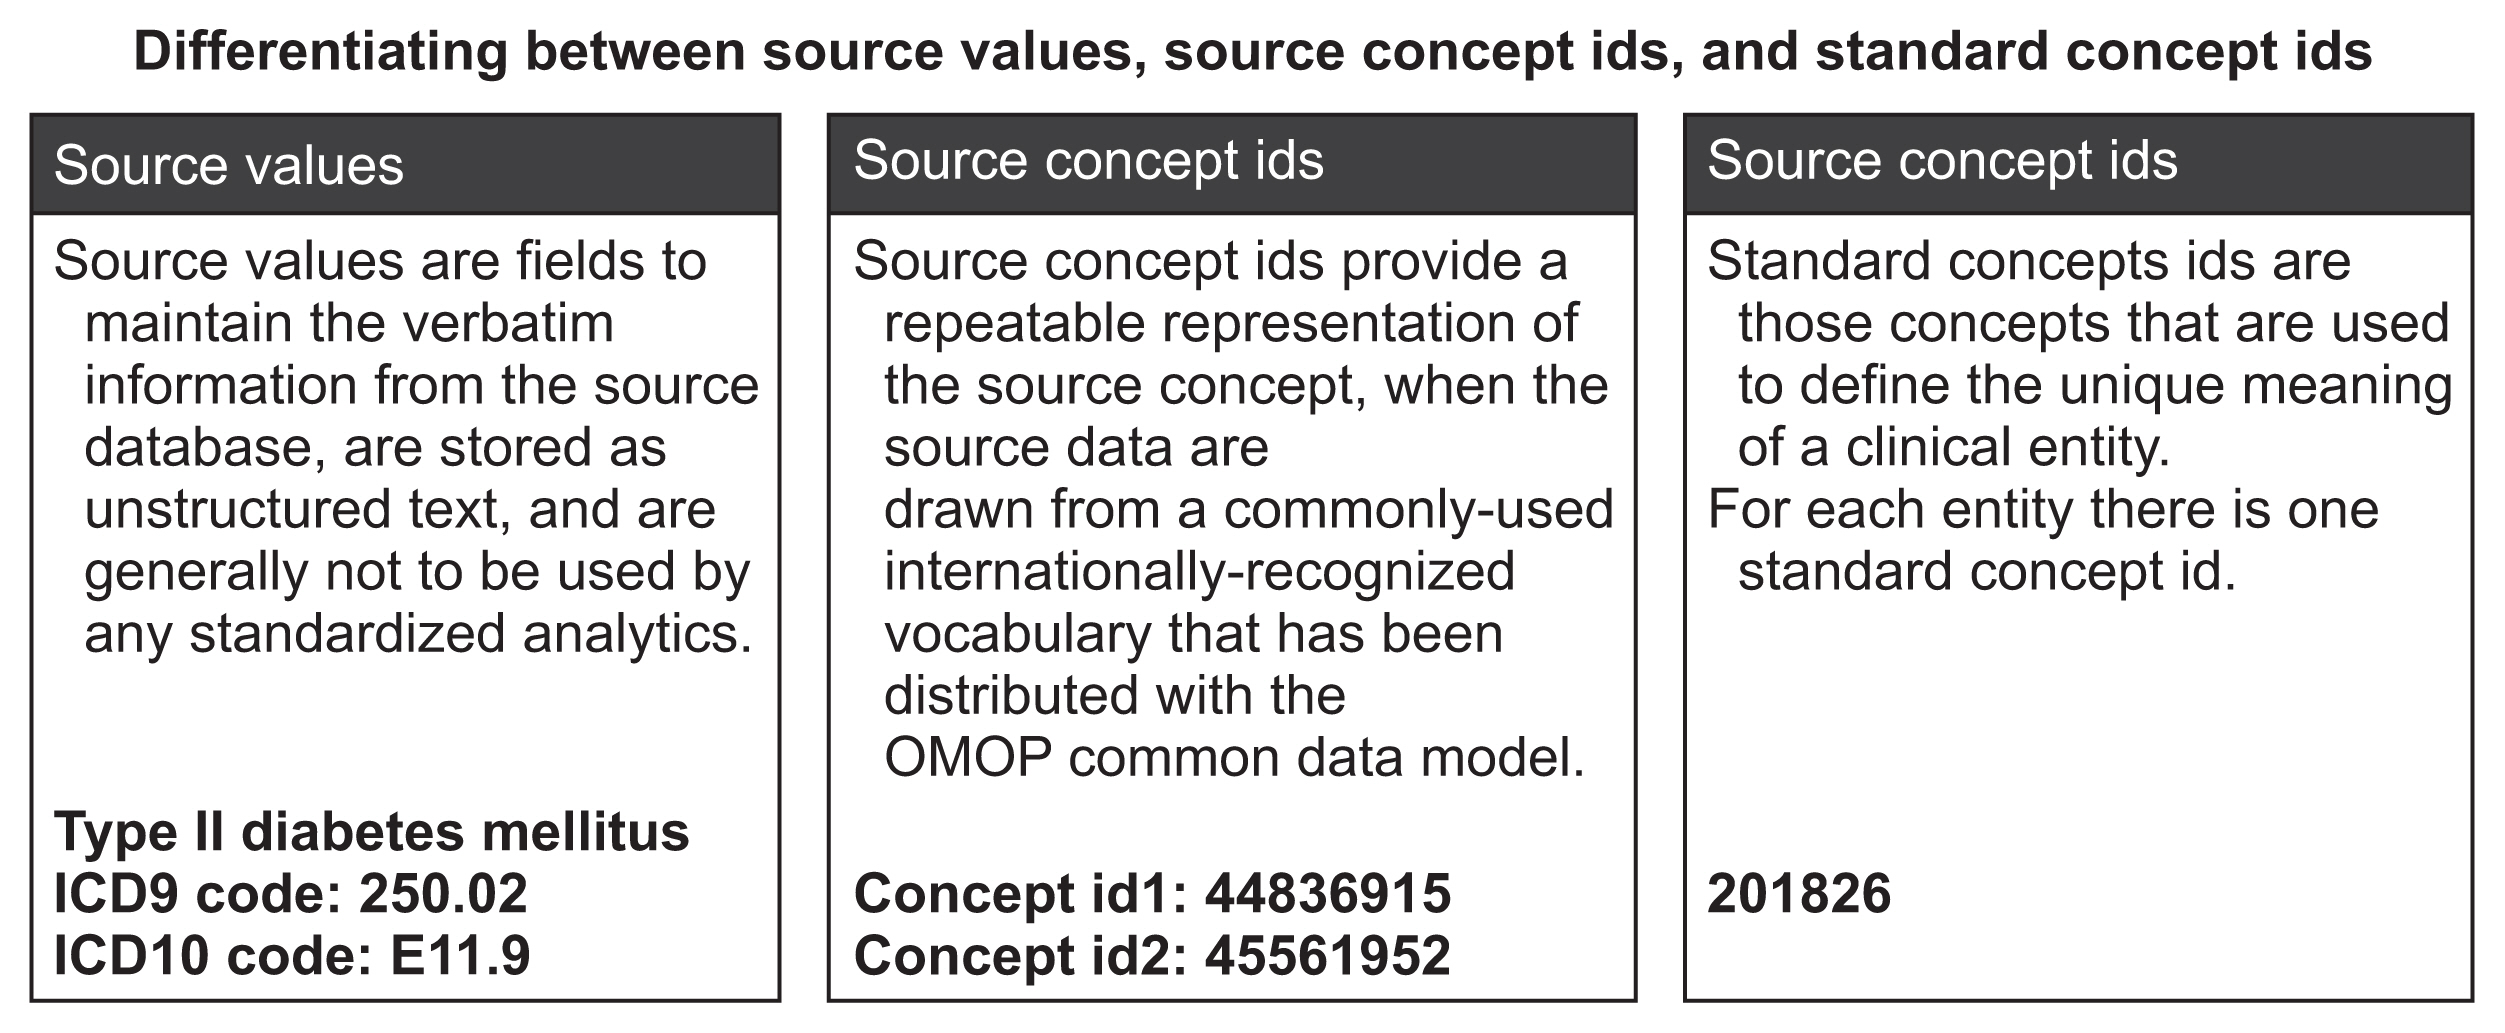
Figure 3 Differentiating between source values, source Concept IDs, and standard Concept IDs. OMOP: Observational Medical Outcomes Partnership, ICD-9: International Classification of Diseases 9th edition, ICD-10: International Classification of Diseases 10th edition.

Figure 4 Study overview detailing criteria for inclusion and exclusion, exposure, and outcomes.
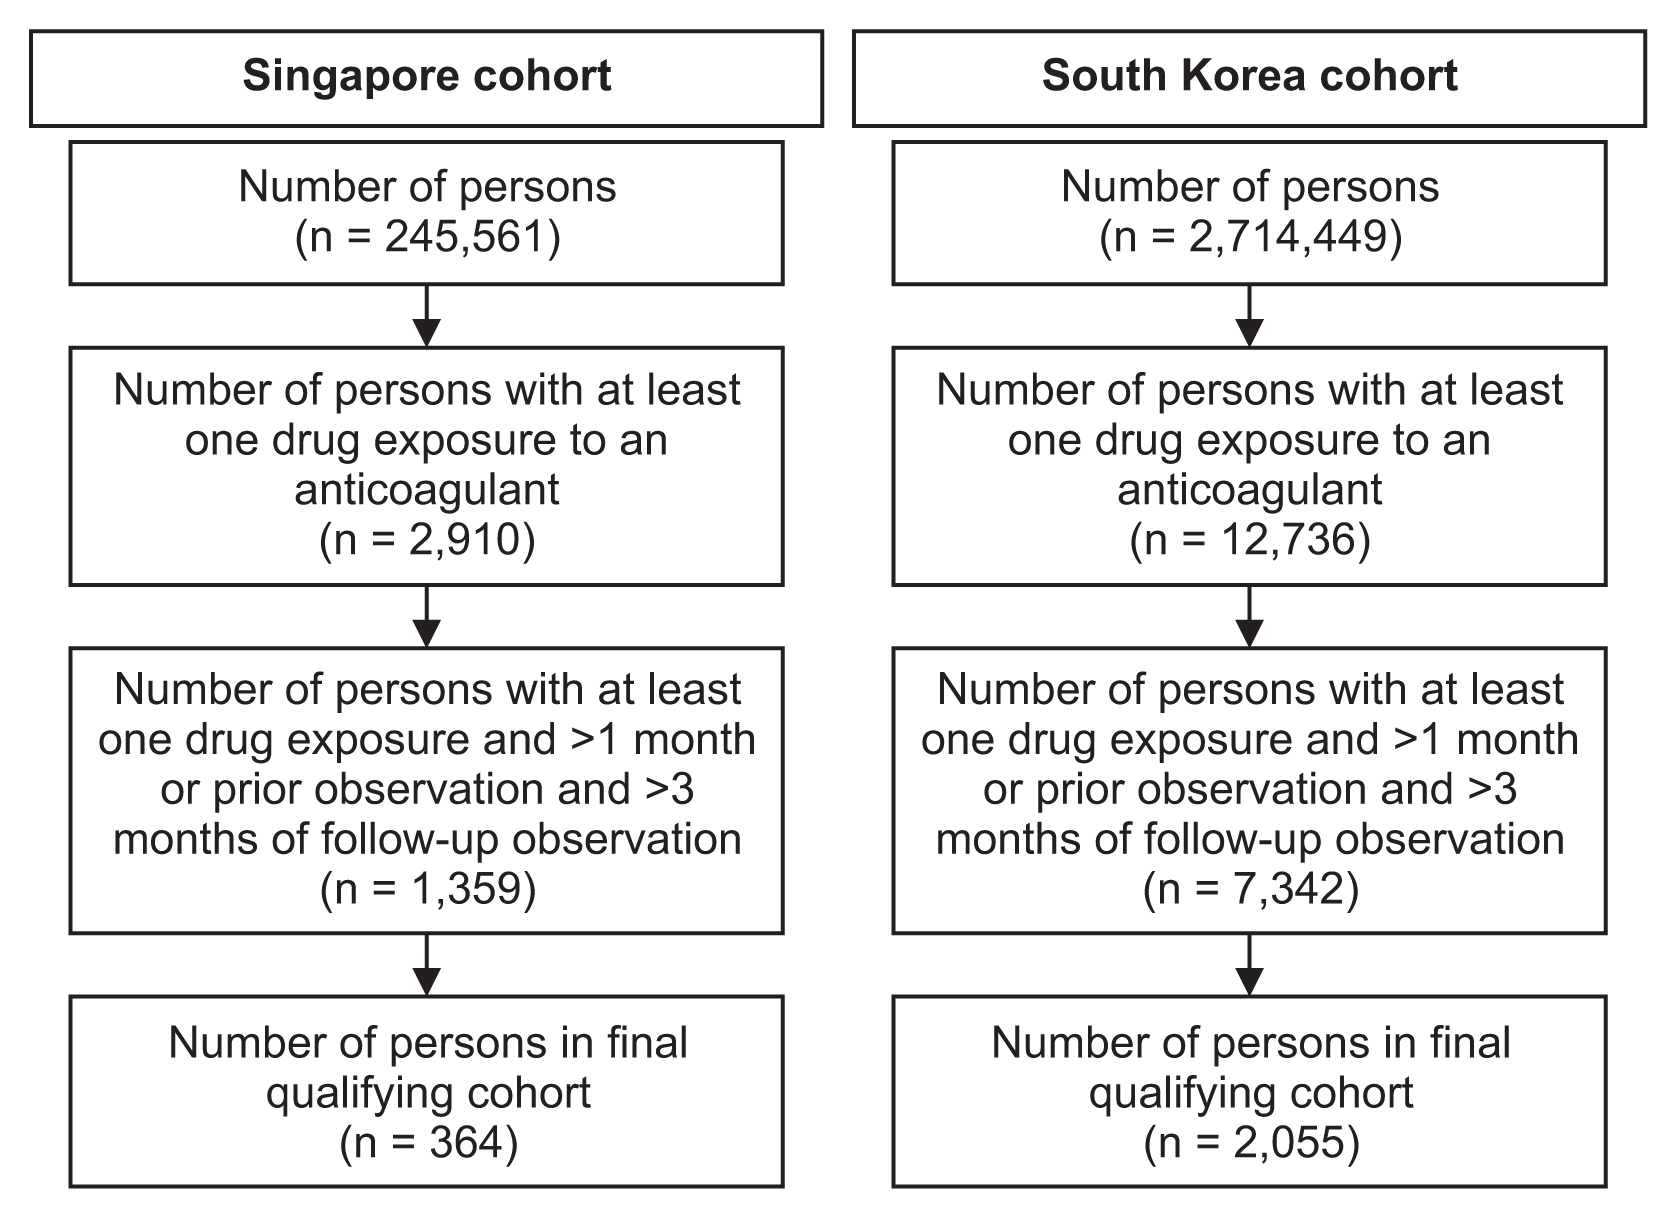
Figure 5 Flow diagram showing the number of persons in the final qualifying cohorts from Singapore and South Korea.

Figure 6 Total cohort follow-up analysis: (A) and (B) are 100%, horizontally-stacked, utilization-adjusted bar charts of effectiveness and safety. The vertical height of each bar is proportional to the number of patients in the Singaporean and South Korean cohorts for 4 years of follow-up. Landmark analysis at 3 months: (C) and (D) are 100%, horizontally-stacked, utilization-adjusted bar charts of effectiveness and safety limited to a follow-up period of three months. The vertical height of each bar is proportional to the number of patients in the Singaporean and South Korean cohorts for 3 months of follow-up. The number of patients experiencing the events of interest are represented as proportions within each bar. Event proportions are unadjusted for confounding factors. Drug A: rivaroxaban, Drug B: warfarin.
Reference
-
References
1. Franklin JM, Glynn RJ, Martin D, Schneeweiss S. Evaluating the use of nonrandomized real-world data analyses for regulatory decision making. Clin Pharmacol Ther. 2019; 105(4):867–77.
Article2. Reisinger SJ, Ryan PB, O’Hara DJ, Powell GE, Painter JL, Pattishall EN, et al. Development and evaluation of a common data model enabling active drug safety surveillance using disparate healthcare databases. J Am Med Inform Assoc. 2010; 17(6):652–62.
Article3. Schneeweiss S, Glynn RJ. Real-world data analytics fit for regulatory decision-making. Am J Law Med. 2018; 44(2–3):197–217.
Article4. Grimes DA, Schulz KF. Bias and causal associations in observational research. Lancet. 2002; 359(9302):248–52.
Article5. Weiskopf NG, Bakken S, Hripcsak G, Weng C. A data quality assessment guideline for electronic health record data reuse. EGEMS (Wash DC). 2017; 5(1):14.
Article6. Observational Health Data Sciences and Informatics. The book of OHDSI [Internet]. [place unknown]. Observational Health Data Sciences and Informatics;2021. [cited at 2022 Apr 15]. Available from: https://ohdsi.github.io/TheBookOfOhdsi/ .7. Maier C, Lang L, Storf H, Vormstein P, Bieber R, Bernarding J, et al. Towards implementation of OMOP in a German university hospital consortium. Appl Clin Inform. 2018; 9(1):54–61.
Article8. Suchard MA, Schuemie MJ, Krumholz HM, You SC, Chen R, Pratt N, et al. Comprehensive comparative effectiveness and safety of first-line antihypertensive drug classes: a systematic, multinational, large-scale analysis. Lancet. 2019; 394(10211):1816–26.
Article9. You SC, Rho Y, Bikdeli B, Kim J, Siapos A, Weaver J, et al. Association of ticagrelor vs clopidogrel with net adverse clinical events in patients with acute coronary syndrome undergoing percutaneous coronary intervention. JAMA. 2020; 324(16):1640–50.
Article10. Lu Y, Van Zandt M, Liu Y, Li J, Wang X, Chen Y, et al. Analysis of dual combination therapies used in treatment of hypertension in a multinational cohort. JAMA Netw Open. 2022; 5(3):e223877.
Article11. Sathappan S, Jeon YS, Dang TK, Lim SC, Shao YM, Tai ES, et al. Transformation of electronic health records and questionnaire data to OMOP CDM: a feasibility study using SG_T2DM Dataset. Appl Clin Inform. 2021; 12(4):757–67.
Article12. Observational Health Data Sciences and Informatics. OMOP common data model [Internet]. [place unknown]. Observational Health Data Sciences and Informatics;c2022. [cited at 2022 Apr 15]. Available from: https://www.ohdsi.org/data-standardization/the-common-data-model/ .13. Observational Health Data Sciences and Informatics. Rabbit-in-a-Hat [Internet]. [place unknown]. Observational Health Data Sciences and Informatics;c2022. [cited at 2022 Apr 15]. Available from: http://ohdsi.github.io/WhiteRabbit/RabbitInAHat.html .14. Hripcsak G, Ryan PB, Duke JD, Shah NH, Park RW, Huser V, et al. Characterizing treatment pathways at scale using the OHDSI network. Proc Natl Acad Sci U S A. 2016; 113(27):7329–36.
Article15. Yoon D, Ahn EK, Park MY, Cho SY, Ryan P, Schuemie MJ, et al. Conversion and data quality assessment of electronic health record data at a Korean tertiary teaching hospital to a common data model for distributed network research. Healthc Inform Res. 2016; 22(1):54–8.
Article16. Park RW. Sharing clinical big data while protecting confidentiality and security: Observational Health Data Sciences and Informatics. Healthc Inform Res. 2017; 23(1):1–3.
Article17. Hripcsak G, Duke JD, Shah NH, Reich CG, Huser V, Schuemie MJ, et al. Observational Health Data Sciences and Informatics (OHDSI): opportunities for observational researchers. Stud Health Technol Inform. 2015; 216:574–8.18. Sentinel Initiative Level 1 analyses [Internet]. Silver Spring (MD): US Food and Drug Administration;c2022. [cited at 2022 Apr 15]. Available from: https://www.sentinelinitiative.org/methods-data-tools/routine-querying-tools/level-1-analyses .19. Sentinel Initiative Level 2 analyses [Internet]. Silver Spring (MD): US Food and Drug Administration;c2022. [cited at 2022 Apr 15]. Available from: https://www.sentinelinitiative.org/methods-data-tools/routine-querying-tools/level-2-analyses .20. Hernan MA, Sauer BC, Hernandez-Diaz S, Platt R, Shrier I. Specifying a target trial prevents immortal time bias and other self-inflicted injuries in observational analyses. J Clin Epidemiol. 2016; 79:70–5.
Article21. Peng RD, Dominici F, Zeger SL. Reproducible epidemiologic research. Am J Epidemiol. 2006; 163(9):783–9.
Article
- Full Text Links
-
- Actions
-
Cited
- CITED
-
- Close
- Share
-
- Similar articles
-
- Establishment of an International Evidence Sharing Network Through Common Data Model for Cardiovascular Research
- Real-world incidence of endopthalmitis after intravitreal anti-VEGF injections in Korea: findings from the Common Data Model in ophthalmology
- Comparison of Recent Trends in Study Design and Data Analysis Guidelines Using Real-World Data/Real-World Evidence in the United States, Europe, and South Korea and Implication of Development Direction in Future
- Recent Trends in Real-World Data Access, Linkage and Validation of the United States, Europe, and South Korea and Further Recommendations for South Korea
- Toward High-Quality Real-World Laboratory Data in the Era of Healthcare Big Data
