Nutr Res Pract.
2020 Dec;14(6):679-690. 10.4162/nrp.2020.14.6.679.
Regional disparities in healthy eating and nutritional status in South Korea: Korea National Health and Nutrition Examination Survey 2017
- Affiliations
-
- 1Department of Food and Nutrition, Kunsan National University, Gunsan 54150, Korea
- 2College of Education and Health Sciences, Touro University, Vallejo, CA 94592, USA
- KMID: 2508799
- DOI: http://doi.org/10.4162/nrp.2020.14.6.679
Abstract
- BACKGROUND/OBJECTIVES
Concerns about regional disparities in heathy eating and nutritional status among South Korean adults are increasing. This study aims to identify the magnitude of regional disparities in diet and nutritional status among Korean adults who completed the 2017 Korea National Health and Nutrition Examination Survey (KNHANES).
SUBJECTS/METHODS
The participants were a nationally representative sample of Korean adults aged 19 years and older from the 2017 KNHANES (n = 6,126). We employed the svy commands in STATA to accommodate the complex survey design. The relative concentration index (RCI), absolute concentration index (ACI) and index of disparity were used to measure regional nutritional inequalities.
RESULTS
Overweight and obese adults were more prevalent among the poor than among the rich in urban areas (RCI = −0.041; P < 0.05), while overweight and obese adults were more prevalent among the rich than among the poor in rural areas of South Korea (RCI = 0.084; P < 0.05). Economic inequality in fruit and vegetable intake ≥ 500 g per day was greater in rural areas than in urban areas in both relative size (RCI = 0.228 vs. 0.091, difference in equality = 0.137; P < 0.05) and absolute size (ACI = 0.055 vs. 0.023, difference in equality = 0.032; P < 0.05).
CONCLUSIONS
This study provides useful information identifying opposite directions in the relative concentration curves between urban and rural areas. Adult overweight/obesity was more prevalent among the poor in urban areas, while adult overweight/obesity was more prevalent among the rich in rural areas. Public health nutrition systems should be implemented to identify nutritional inequalities that should be targeted across regions in South Korea.
Keyword
Figure
-
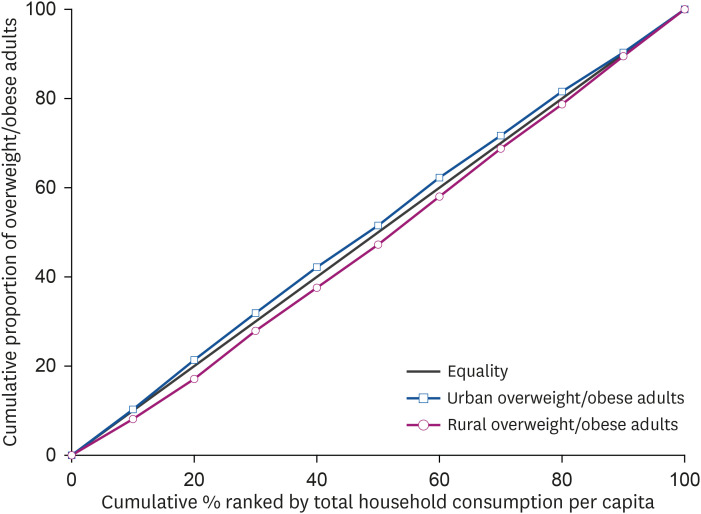
Fig. 1 Relative concentration curves of overweight/obese adults.
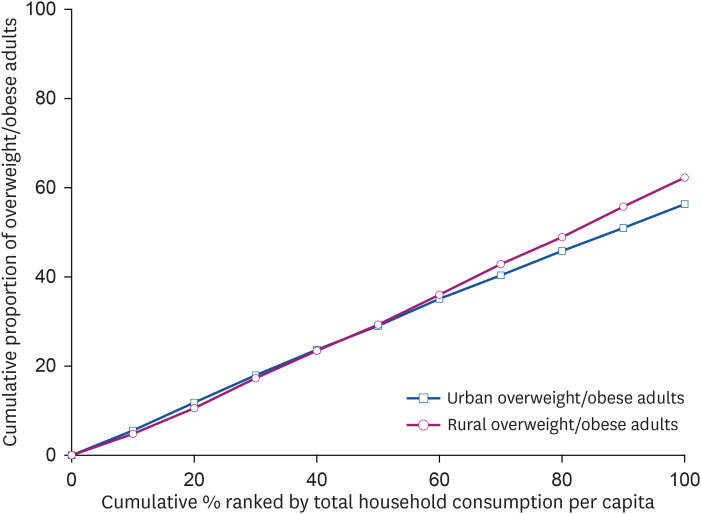
Fig. 2 Absolute concentration curves of overweight/obese adults.
Cited by 2 articles
-
Regional disparities related to cardiovascular diseases and diet quality in Korean adults: based on the 2013–2016 Korea National Health and Nutrition Examination Survey Data
Bo Young Seo, Eun Sil Her
Nutr Res Pract. 2022;16(6):755-764. doi: 10.4162/nrp.2022.16.6.755.Descriptive Analysis of Gastric Cancer Mortality in Korea, 2000–2020
Tung Hoang, Hyeongtaek Woo, Sooyoung Cho, Jeeyoo Lee, Sayada Zartasha Kazmi, Aesun Shin
Cancer Res Treat. 2023;55(2):603-617. doi: 10.4143/crt.2022.307.
Reference
-
1. Arcaya MC, Arcaya AL, Subramanian SV. Inequalities in health: definitions, concepts, and theories. Glob Health Action. 2015; 8:27106. PMID: 26112142.
Article2. Murray CJ, Gakidou EE, Frenk J. Health inequalities and social group differences: what should we measure? Bull World Health Organ. 1999; 77:537–543. PMID: 10444876.3. Braveman P, Tarimo E. Social inequalities in health within countries: not only an issue for affluent nations. Soc Sci Med. 2002; 54:1621–1635. PMID: 12113445.
Article5. Kim S, Song JH, Oh YM, Park SM. Disparities in the utilisation of preventive health services by the employment status: an analysis of 2007-2012 South Korean national survey. PLoS One. 2018; 13:e0207737. PMID: 30586360.
Article6. Kim KR, Kim MK, Shin YJ. Household food security status and its characteristics in Korea. Health Soc Welf Rev. 2009; 29:268–292.7. Lee SH, Joh HK, Kim S, Oh SW, Lee CM, Kwon H. Income disparities in the use of health screening services among university students in Korea: a cross-sectional study of 2479 participants in a university. Medicine (Baltimore). 2016; 95:e3681. PMID: 27196475.8. Lee H, Kim BH. Physical activity disparities by socioeconomic status among metabolic syndrome patients: The Fifth Korea National Health and Nutrition Examination Survey. J Exerc Rehabil. 2016; 12:10–14. PMID: 26933654.
Article9. Zhang Q, Wang Y. Using concentration index to study changes in socio-economic inequality of overweight among US adolescents between 1971 and 2002. Int J Epidemiol. 2007; 36:916–925. PMID: 17470489.
Article10. Kim S, Hwang J. Assessment of trends in socioeconomic inequalities in cancer screening services in Korea, 1998-2012. Int J Equity Health. 2016; 15:30. PMID: 26912345.
Article11. Hwang J, Lee EY, Lee CG. Measuring socioeconomic inequalities in obesity among Korean adults, 1998-2015. Int J Environ Res Public Health. 2019; 16:1617.
Article12. Korea Health Promotion Institute [Internet]. Seoul: Korea Health Promotion Institute;c2020. cited 2020 August 2. Available from: https://khealth.or.kr/kps.13. Korea Health Promotion Institute. Health Plan [Internet]. Seoul: Korea Health Promotion Institute;2020. cited 2020 August 02. Available from: https://www.khealth.or.kr/healthplan.14. Choi EJ. Developing Strategies for the National Health Plan 2020. Sejong: Korea Institute for Health and Social Affairs;2016.15. Kweon S, Kim Y, Jang MJ, Kim Y, Kim K, Choi S, Chun C, Khang YH, Oh K. Data resource profile: the Korea National Health and Nutrition Examination Survey (KNHANES). Int J Epidemiol. 2014; 43:69–77. PMID: 24585853.
Article16. Korea Centers for Disease Control and Prevention. Korea National Health and Nutrition Examination Survey Selection of Target People [Internet]. Cheongju: Korea Centers for Disease Control and Prevention;2020. cited 2020 August 10. Available from: https://knhanes.cdc.go.kr/knhanes/sub02/sub02_01.do.17. World Health Organization. Definition of terms. In: Western Pacific Country Health Information Profiles: 2011 Revision. Manila: World Health Organization Western Pacific Region;2011.18. Rural Development Administration (KR). Food Composition Table. 5th rev. ed. Suwon: Rural Development Administration;1996.19. Rural Development Administration (KR). Food Composition Table. 6th rev. ed. Suwon: Rural Development Administration;2001.20. Rural Development Administration (KR). Food Composition Table. 7th rev. ed. Suwon: Rural Development Administration;2006.21. Rural Development Administration (KR). Standard Food Composition Table. 8th rev. ed. Suwon: Rural development Administration;2012.22. Ministry of Health and Welfare (KR). The Korean Nutrition Society. Dietary Reference Intakes for Koreans 2015. Seoul: The Korean Nutrition Society;2015.23. Pearcy JN, Keppel KG. A summary measure of health disparity. Public Health Rep. 2002; 117:273–280. PMID: 12432138.
Article24. O'Donnell O, Van Doorslaer E, Wagstaff A, Lindelow M. Analyzing Health Equity Using Household Survey Data: a Guide to Techniques and Their Implementation. Washington, D.C.: The World Bank;2007.25. Clarke PM, Gerdtham UG, Johannesson M, Bingefors K, Smith L. On the measurement of relative and absolute income-related health inequality. Soc Sci Med. 2002; 55:1923–1928. PMID: 12406461.
Article26. O'Donnell O, O'Neill S, Van Ourti T, Walsh B. conindex: Estimation of concentration indices. Stata J. 2016; 16:112–138. PMID: 27053927.27. Kim MY, Oh KK, Lim MK, Yun EH, Kang YH. The association of socioeconomic and psychosocial factors with obesity in a rural community. Korean J Obes. 2012; 21:18–28.
Article28. Korea Centers for Disease Control and Prevention. Korea Health Statistics 2018: Korea National Health and Nutrition Examination Survey (KNHANES VII-3). . Cheongju: Korea Centers for Disease Control and Prevention;2019.29. Lee WJ, Kim HC, Oh SM, Choi DP, Cho J, Suh I. Factors associated with a low-sodium diet: the Fourth Korean National Health and Nutrition Examination Survey. Epidemiol Health. 2013; 35:e2013005. PMID: 23807908.
Article30. Lee KW, Song WO, Cho MS. Dietary quality differs by consumption of meals prepared at home vs. outside in Korean adults. Nutr Res Pract. 2016; 10:294–304. PMID: 27247726.
Article31. Wagstaff A. The bounds of the concentration index when the variable of interest is binary, with an application to immunization inequality. Health Econ. 2005; 14:429–432. PMID: 15495147.
Article32. Xu Y, Zhu S, Zhang T, Wang D, Hu J, Gao J, Zhou Z. Explaining income-related inequalities in dietary knowledge: evidence from the China Health and Nutrition Survey. Int J Environ Res Public Health. 2020; 17:532.
Article33. Yazdi-Feyzabadi V, Rashidian A, Amini Rarani M. Socio-economic inequality in unhealthy snacks consumption among adolescent students in Iran: a concentration index decomposition analysis. Public Health Nutr. 2019; 22:2179–2188. PMID: 31199208.
Article34. Mostafavi F, Moradi G, Azadi N, Esmaeilnasab N, Chamary M. The association of unhealthy diet with socioeconomic inequality in children: a study in Kurdistan. West of Iran. Health Scope. 2019; 8:e58336.
Article
- Full Text Links
-
- Actions
-
Cited
- CITED
-
- Close
- Share
-
- Similar articles
-
- Comparison of Nutrient Intake and the Prevalence of Metabolic Syndrome According to the Frequency of Eating with Others in the Elderly: Based on the 2013-2017 Korean National Health and Nutrition Examination Survey
- Regional disparities related to cardiovascular diseases and diet quality in Korean adults: based on the 2013–2016 Korea National Health and Nutrition Examination Survey Data
- The Current Status and the Perspectives of Nutrition Survey
- Comparison of the nutritional status of infants and young children in South Korea and North Korea
- Status of Korean Healthy Eating Index and Associated Factors in Elderly with a Focus on Health Habits, Mental Health, and Nutritional Status: Data from the 2016∼2018 Korea National Health and Nutrition Examination Survey
