Dosing study of esmolol for reducing hemodynamic changes during lightwand intubation
- Affiliations
-
- 1Department of Anesthesiology and Pain Medicine, Soonchunhyang University Cheonan Hospital, Soonchunhyang University College of Medicine, Cheonan, Korea
- KMID: 2508403
- DOI: http://doi.org/10.17085/apm.19067
Abstract
- Background
Lightwand is a convenient tool that can be used instead of a laryngoscope for intubation. Tracheal intubation causes direct stimulation of the larynx, drastically increasing hemodynamic values including blood pressure and heart rate. This study aims to identify the effect of different doses of esmolol on hemodynamic changes during lightwand intubation.
Methods
The study subjects included 140 patients who underwent general anesthesia for elective surgery. The patients were randomly divided into four groups (35 patients in each group). The ‘C’ group only received 20 ml of normal saline, while the ‘E0.5’, ‘E1’, and ‘E2’ groups received 20 ml of normal saline containing esmolol—0.5 mg/kg, 1 mg/kg, and 2 mg/kg, respectively, injected 2 min prior to intubation. The patients’ blood pressure, heart rate, and rate-pressure product were measured six times, before and after the intubation.
Results
The degree of heart rate elevation was suppressed in the E1 and E2 groups compared to the C group, and RPP after intubation significantly decreased in the E2 group compared to the C group.
Conclusions
1–2 mg/kg of a single esmolol injection prior to lightwand intubation effectively blunts heart rate elevation, and 2 mg/kg of esmolol injection blunts rate-pressure product elevation.
Keyword
Figure
-

Fig. 1. Flowchart illustrating the selection of patients. C: control, E0.5: esmolol 0.5 mg/kg, E1: esmolol 1.0 mg/kg, E2: esmolol 2.0 mg/kg.
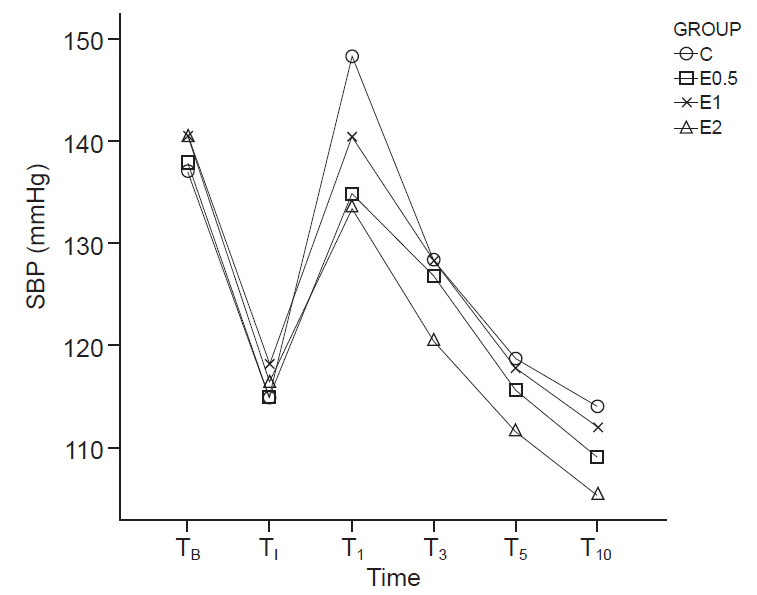
Fig. 2. SBP changes with lightwand intubation in the four patient groups. All values are expressed as mean values. C: control, E0.5: esmolol 0.5 mg/kg, E1: esmolol 1.0 mg/kg, E2: esmolol 2.0 mg/kg, SBP: systolic blood pressure, TB: before induction (baseline), TI: 2 min before intubation (induction), T1: 1 min after intubation, T3: 3 min after intubation, T5: 5 min after intubation, T10: 10 min after intubation.

Fig. 3. DBP changes with lightwand intubation in the four patient groups. All values are expressed as mean values. C: control, E0.5: esmolol 0.5 mg/kg, E1: esmolol 1.0 mg/kg, E2: esmolol 2.0 mg/kg, DBP: diastolic blood pressure, TB: before induction (baseline), TI: 2 min before intubation (induction), T1: 1 min after intubation, T3: 3 min after intubation, T5: 5 min after intubation, T10: 10 min after intubation.

Fig. 4. MBP changes with lightwand intubation in the four patient groups. All values are expressed as mean values. C: control, E0.5: esmolol 0.5 mg/kg, E1: esmolol 1.0 mg/kg, E2: esmolol 2.0 mg/kg, MBP: mean blood pressure, TB: before induction (baseline), TI: 2 min before intubation (induction), T1: 1 min after intubation, T3: 3 min after intubation, T5: 5 min after intubation, T10: 10 min after intubation.

Fig. 5. HR changes with lightwand intubation in the four patient groups. Comparison of measurements in C group and E1 group showed significant differences in HR at 1 min after intubation (T1) (100.11 vs. 85.34, P ≤ 0.001), as well as at 3 min after intubation (T3) (93.94 vs. 83.63, P = 0.02). Similarly, comparison of measurements in C group and E2 group demonstrated significant differences in HR at 1 min after intubation (T1) (100.11 vs. 87.09, P ≤ 0.001), as well as at 3 min after intubation (T3) (93.94 vs. 81.97, P ≤ 0.001). All values are expressed as mean values. C: control, E0.5: esmolol 0.5 mg/kg, E1: esmolol 1.0 mg/kg, E2: esmolol 2.0 mg/kg, HR: heart rate, TB: before induction (baseline), TI: 2 min before intubation (induction), T1: 1 min after intubation, T3: 3 min after intubation, T5: 5 min after intubation, T10: 10 min after intubation. *P < 0.05 compared with C group.
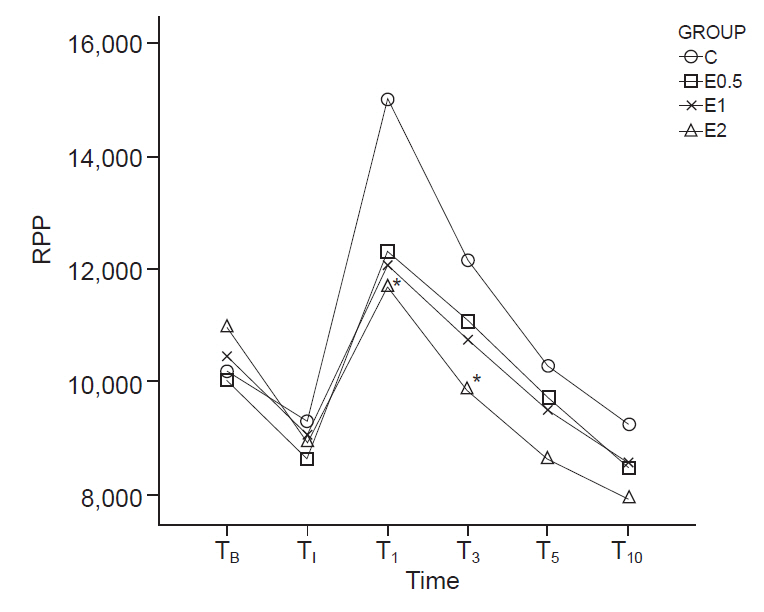
Fig. 6. RPP changes with lightwand intubation in the four patient groups. Comparison of RPP measurements in C group and E2 group showed significant differences at 1 min after intubation (T1) (15,003.43 vs. 11,665.40, P = 0.001) and 3 min after intubation (T3) (12,162.37 vs. 9,861.89, P = 0.002). All values are expressed as mean values. C: control, E0.5: esmolol 0.5 mg/kg, E1: esmolol 1.0 mg/kg, E2: esmolol 2.0 mg/kg, RPP: rate-pressure product, TB: before induction (baseline), TI: 2 min before intubation (induction), T1: 1 min after intubation, T3: 3 min after intubation, T5: 5 min after intubation, T10: 10 min after intubation. *P < 0.05 compared with C group.
Reference
-
1. Prys-Roberts C, Greene LT, Meloche R, Foëx P. Studies of anaesthesia in relation to hypertension. II. Haemodynamic consequences of induction and endotracheal intubation. Br J Anaesth. 1971; 43:531–47.2. Kanaide M, Fukusaki M, Tamura S, Takada M, Miyako M, Sumikawa K. Hemodynamic and catecholamine responses during tracheal intubation using a lightwand device (Trachlight) in elderly patients with hypertension. J Anesth. 2003; 17:161–5.3. Davis L, Cook-Sather SD, Schreiner MS. Lighted stylet tracheal intubation: a review. Anesth Analg. 2000; 90:745–56.4. Sintetos AL, Hulse J, Pritchett EL. Pharmacokinetics and pharmacodynamics of esmolol administered as an intravenous bolus. Clin Pharmacol Ther. 1987; 41:112–7.5. Wiest D. Esmolol. A review of its therapeutic efficacy and pharmacokinetic characteristics. Clin Pharmacokinet. 1995; 28:190–202.6. Sheppard S, Eagle CJ, Strunin L. A bolus dose of esmolol attenuates tachycardia and hypertension after tracheal intubation. Can J Anaesth. 1990; 37:202–5.7. Bensky KP, Donahue-Spencer L, Hertz GE, Anderson MT, James R. The dose-related effects of bolus esmolol on heart rate and blood pressure following laryngoscopy and intubation. AANA J. 2000; 68:437–42.8. Feringa HH, Bax JJ, Boersma E, Kertai MD, Meij SH, Galal W, et al. High-dose beta-blockers and tight heart rate control reduce myocardial ischemia and troponin T release in vascular surgery patients. Circulation. 2006; 114(1 Suppl):I344–9.9. Ansari M, Javadi H, Pourbehi M, Mogharrabi M, Rayzan M, Semnani S, et al. The association of rate pressure product (RPP) and myocardial perfusion imaging (MPI) findings: a preliminary study. Perfusion. 2012; 27:207–13.10. May GA, Nagle FJ. Changes in rate-pressure product with physical training of individuals with coronary artery disease. Phys Ther. 1984; 64:1361–6.11. Nishikawa K, Omote K, Kawana S, Namiki A. A comparison of hemodynamic changes after endotracheal intubation by using the lightwand device and the laryngoscope in normotensive and hypertensive patients. Anesth Analg. 2000; 90:1203–7.12. Salvalaggio MF, Rehme R, Fernandez R, Vieira S, Nakashima P. A comparative study between the laryngoscope and lighted stylet in tracheal intubation. Rev Bras Anestesiol. 2010; 60:138–82.13. Friedman PG, Rosenberg MK, Lebenbom-Mansour M. A comparison of light wand and suspension laryngoscopic intubation techniques in outpatients. Anesth Analg. 1997; 85:578–82.14. Takahashi S, Mizutani T, Miyabe M, Toyooka H. Hemodynamic responses to tracheal intubation with laryngoscope versus lightwand intubating device (Trachlight) in adults with normal airway. Anesth Analg. 2002; 95:480–4.15. Yoon C, Park KS, Park SY, Chae YJ, Min SK, Lee SY, et al. Hemodynamic changes after endotracheal intubation in patients with cerebral aneurysm. Anesth Pain Med. 2008; 3:49–54.16. Montes FR, Giraldo JC, Betancur LA, Rincón JD, Rincón IE, Vanegas MV, et al. Endotracheal intubation with a lightwand or a laryngoscope results in similar hemodynamic variations in patients with coronary artery disease. Can J Anaesth. 2003; 50:824–8.17. Salgado Filho MF, Cordeiro VH, Mota S, Prota M, Lopez MN, de Lara RA. Comparison between the hemodynamic parameters of rigid laryngoscopy and lighted stylet in patients with coronariopathies. Rev Bras Anestesiol. 2011; 61:447–55.18. Kindler CH, Schumacher PG, Schneider MC, Urwyler A. Effects of intravenous lidocaine and/or esmolol on hemodynamic responses to laryngoscopy and intubation: a double-blind, controlled clinical trial. J Clin Anesth. 1996; 8:491–6.19. Miller DR, Martineau RJ, Wynands JE, Hill J. Bolus administration of esmolol for controlling the haemodynamic response to tracheal intubation: the Canadian multicentre trial. Can J Anaesth. 1991; 38:849–58.20. Rathore A, Gupta HK, Tanwar GL, Rehman H. Attenuation of the pressure response to laryngoscopy and endotracheal intubation with different doses of esmolol. Indian J Anaesth. 2002; 46:449–52.21. Cakırgöz MY, Taşdöğen A, Olguner C, Korkmaz H, Oğün E, Küçükebe B, et al. The effect of different doses of esmolol on hemodynamic, bispectral index and movement response during orotracheal intubation: prospective, randomized, double-blind study. Rev Bras Anestesiol. 2014; 64:425–32.22. Dominiak P, Grobecker H. Elevated plasma catecholamines in young hypertensive and hyperkinetic patients: effect of pindolol. Br J Clin Pharmacol. 1982; 13(Suppl 2):381S–90S.23. Roth GM. The role of the catecholamines in hypertension. A review. Am J Cardiol. 1962; 9:724–30.24. Yukioka H, Hayashi M, Terai T, Fujimori M. Intravenous lidocaine as a suppressant of coughing during tracheal intubation in elderly patients. Anesth Analg. 1993; 77:309–12.
- Full Text Links
-
- Actions
-
Cited
- CITED
-
- Close
- Share
-
- Similar articles
-
- The Comparison of Suceess Rates of Lightwand Facilitated Tracheal Intubation in Different Head Positions (Neutral Position versus Sniffing Position)
- The Correlation between Blood Pressure Elevation and Intubation Time during Tracheal Intubation using Lightwand or Direct Laryngoscope
- Comparison of the Success Rates of Lightwand Tracheal Intubation on the First Attempt When Using the Lightwand at Different Angles
- Comparison of Verapamil and Esmolol for Controlling the Blood Pressure and Heart Rate to Tracheal Intubation According to the Different Anesthetic Induction Agents
- Comparison between Glidescope and Lightwand for tracheal intubation in patients with a simulated difficult airway
