J Cerebrovasc Endovasc Neurosurg.
2020 Mar;22(1):8-14. 10.7461/jcen.2020.22.1.8.
Discrepancy in core infarct betweennon-contrast CT and CT perfusionwhen selecting for mechanicalthrombectomy
- Affiliations
-
- 1Department of Neurology, Neurological Institute, Cleveland Clinic Abu Dhabi, Abu Dhabi, UAE
- 2Department of Neurointerventional Surgery, Neurological Institute, Cleveland Clinic Abu Dhabi, Abu Dhabi, UAE
- 3Department of Neuroradiology, Imaging Institute, Cleveland Clinic Abu Dhabi, Abu Dhabi, UAE
- KMID: 2500068
- DOI: http://doi.org/10.7461/jcen.2020.22.1.8
Abstract
Objective
Mechanical thrombectomy (MT) is now an established treatment for acute ischemic stroke (AIS) with large vessel occlusion (LVO) within 6 hours. Since 2018, MT is also recommended from 6-24 hours after selecting with additional multimodal imaging including perfusion imaging. We sought to investigate patients with significant discrepancy in core infarct between computed tomography (CT) and CT perfusion (CTP).
Methods
In this retrospective study, patients with AIS who were evaluated for MT using the RAPID software (IschemaView, Redwood City, CA, USA) from February 2018 to March 2019 were included. Cases with discrepancy between infarct volume on non-contrast CT and core volume (cerebral blood flow <30%) as analyzed by RAPID on CTP were analyzed.
Results
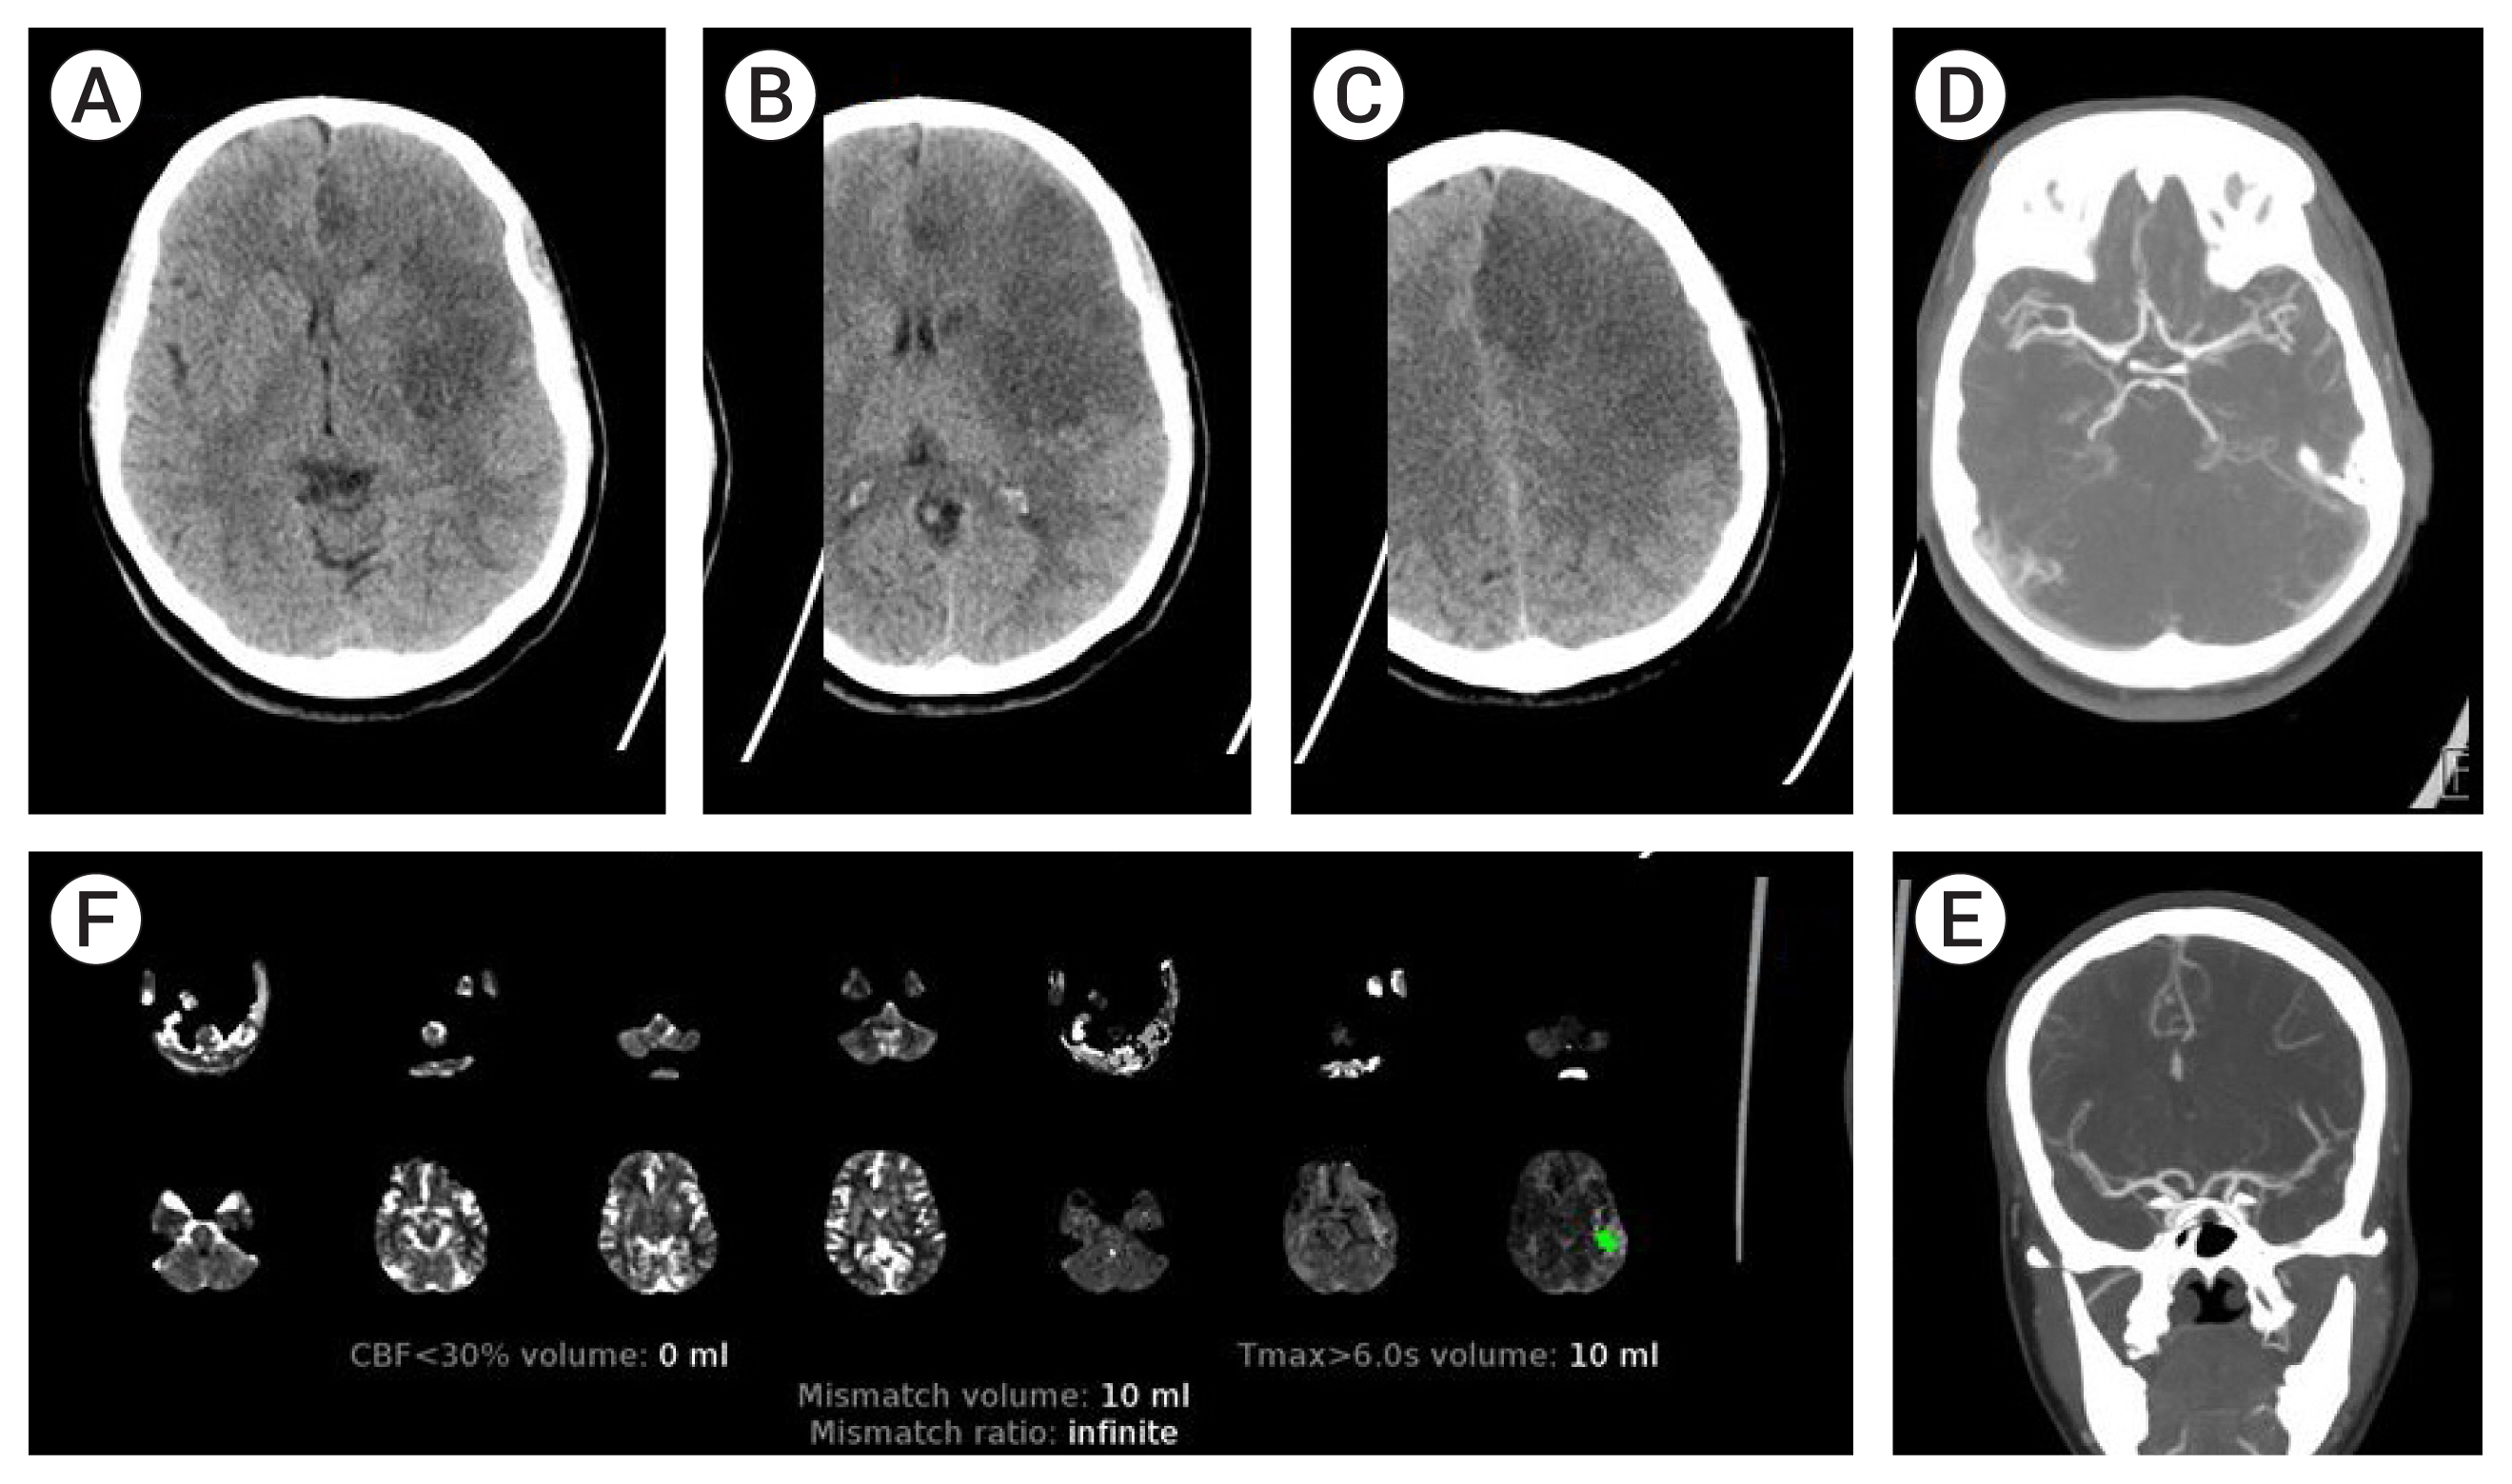
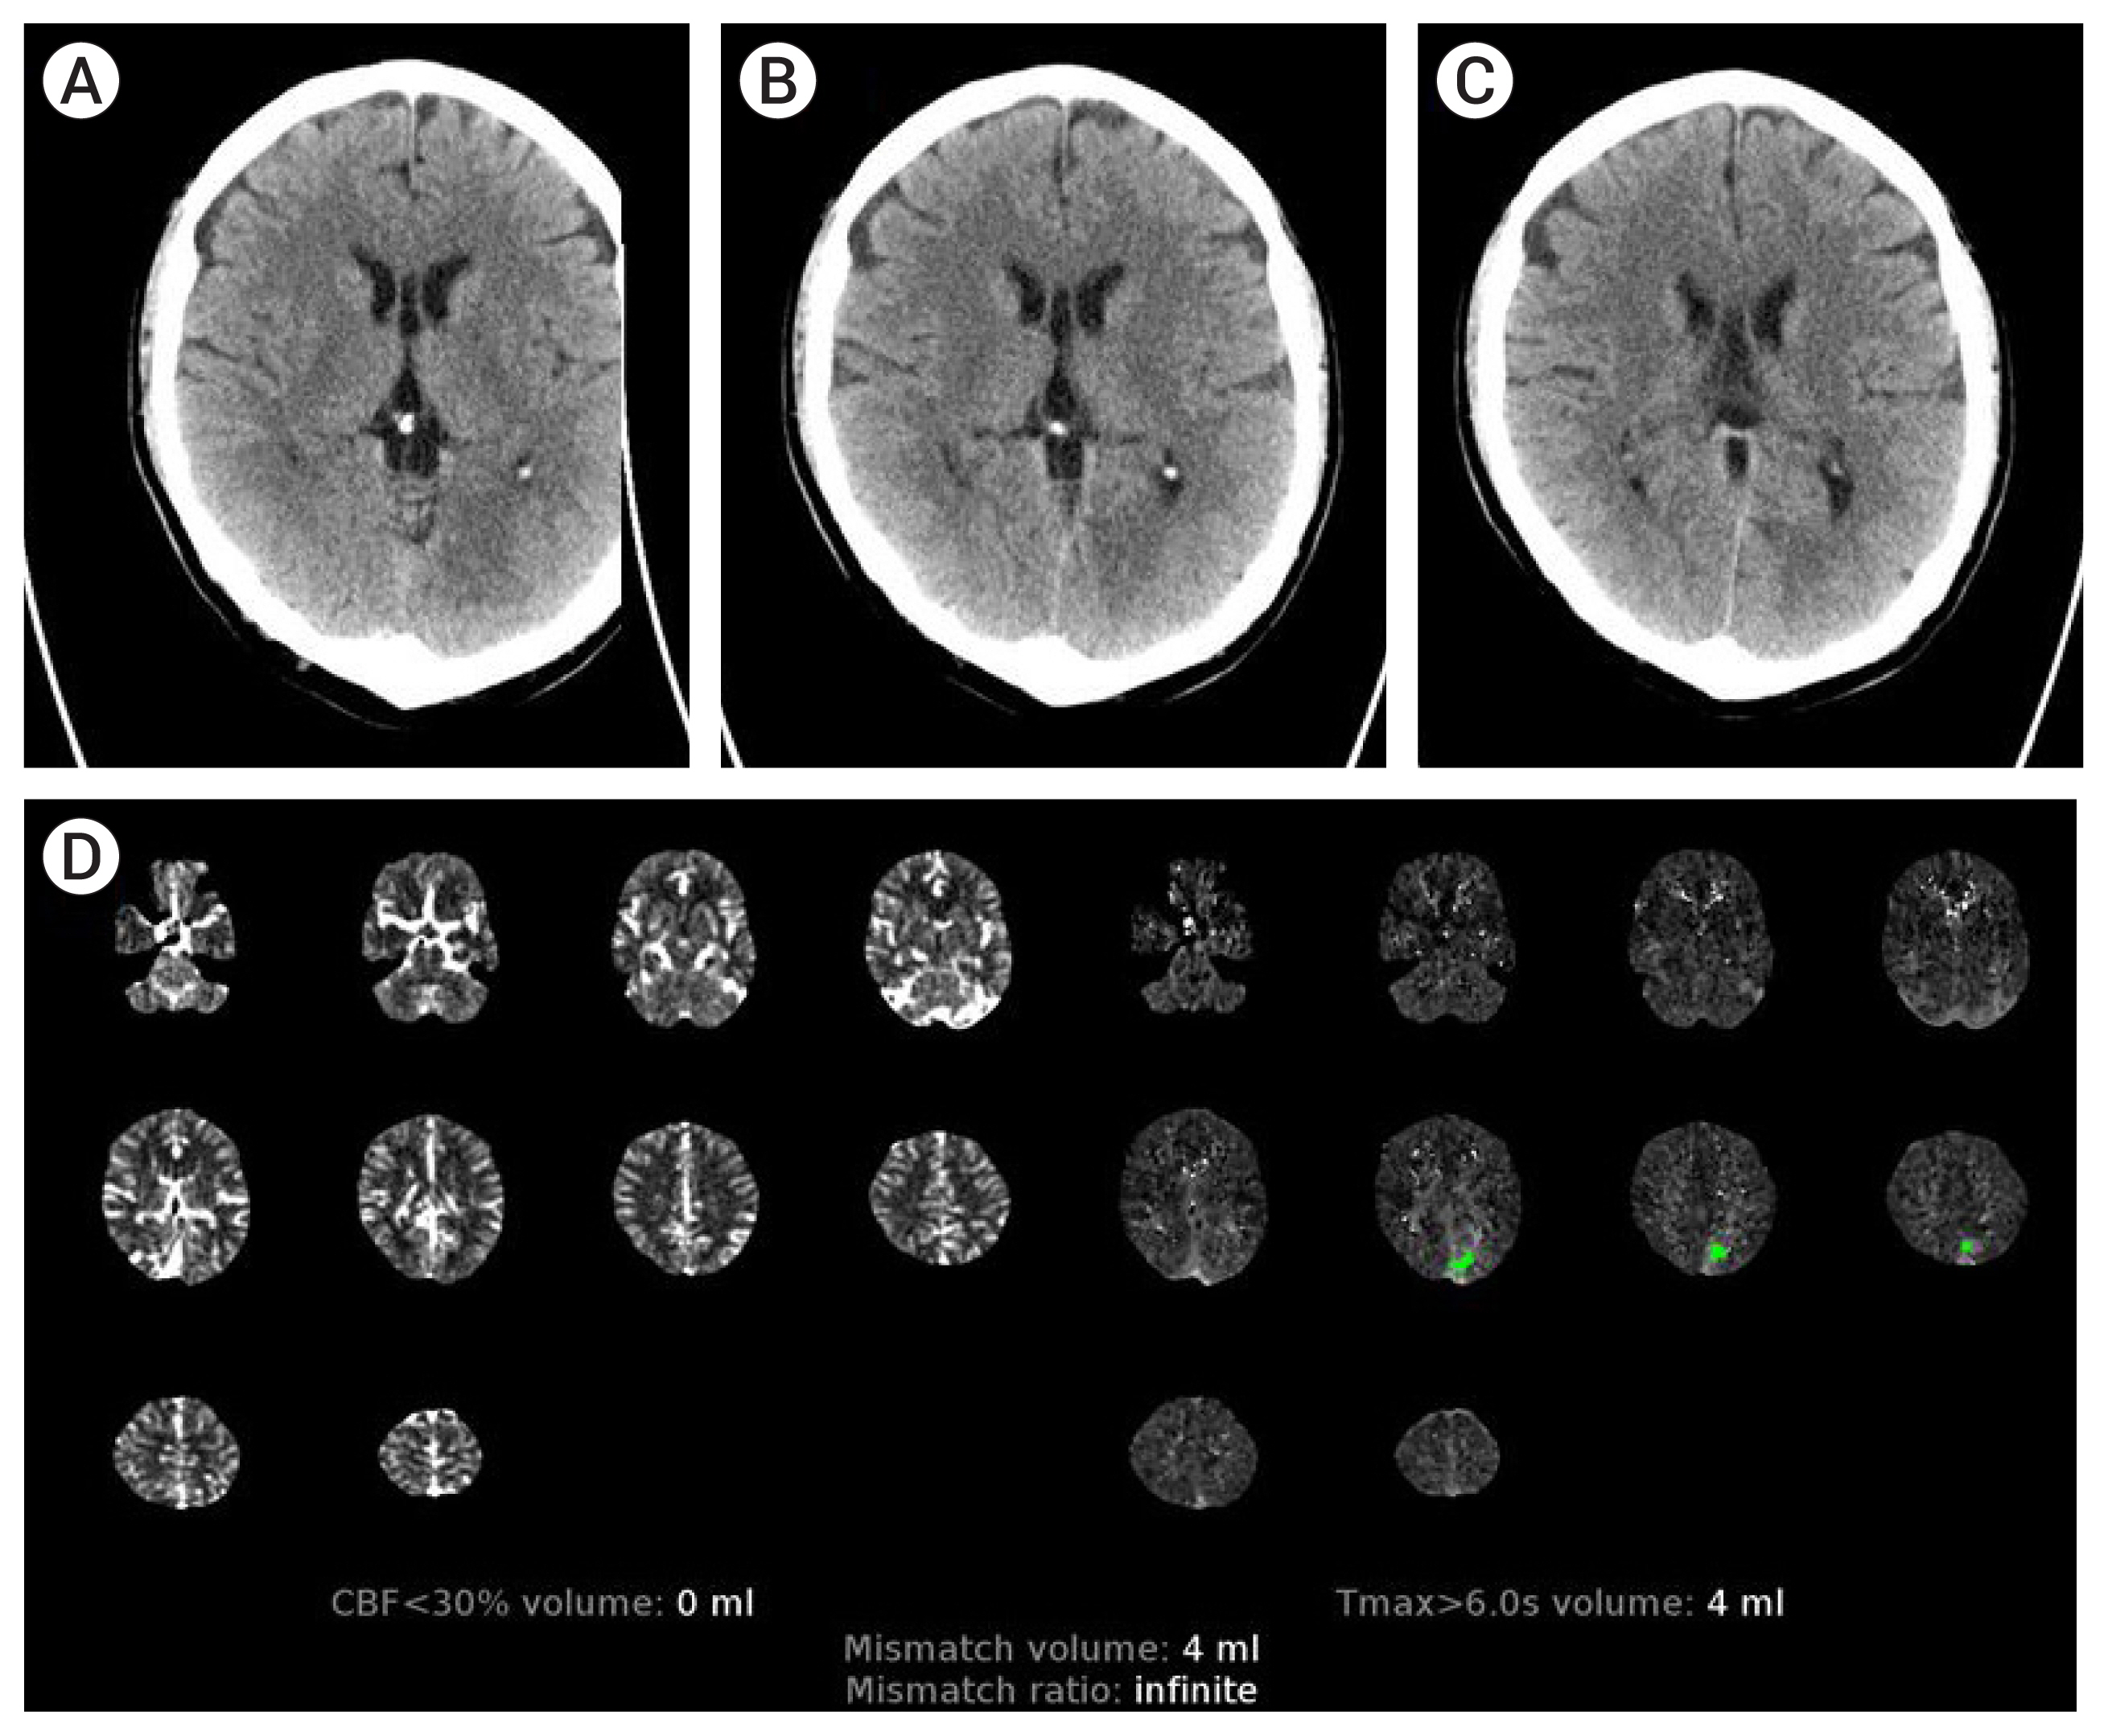
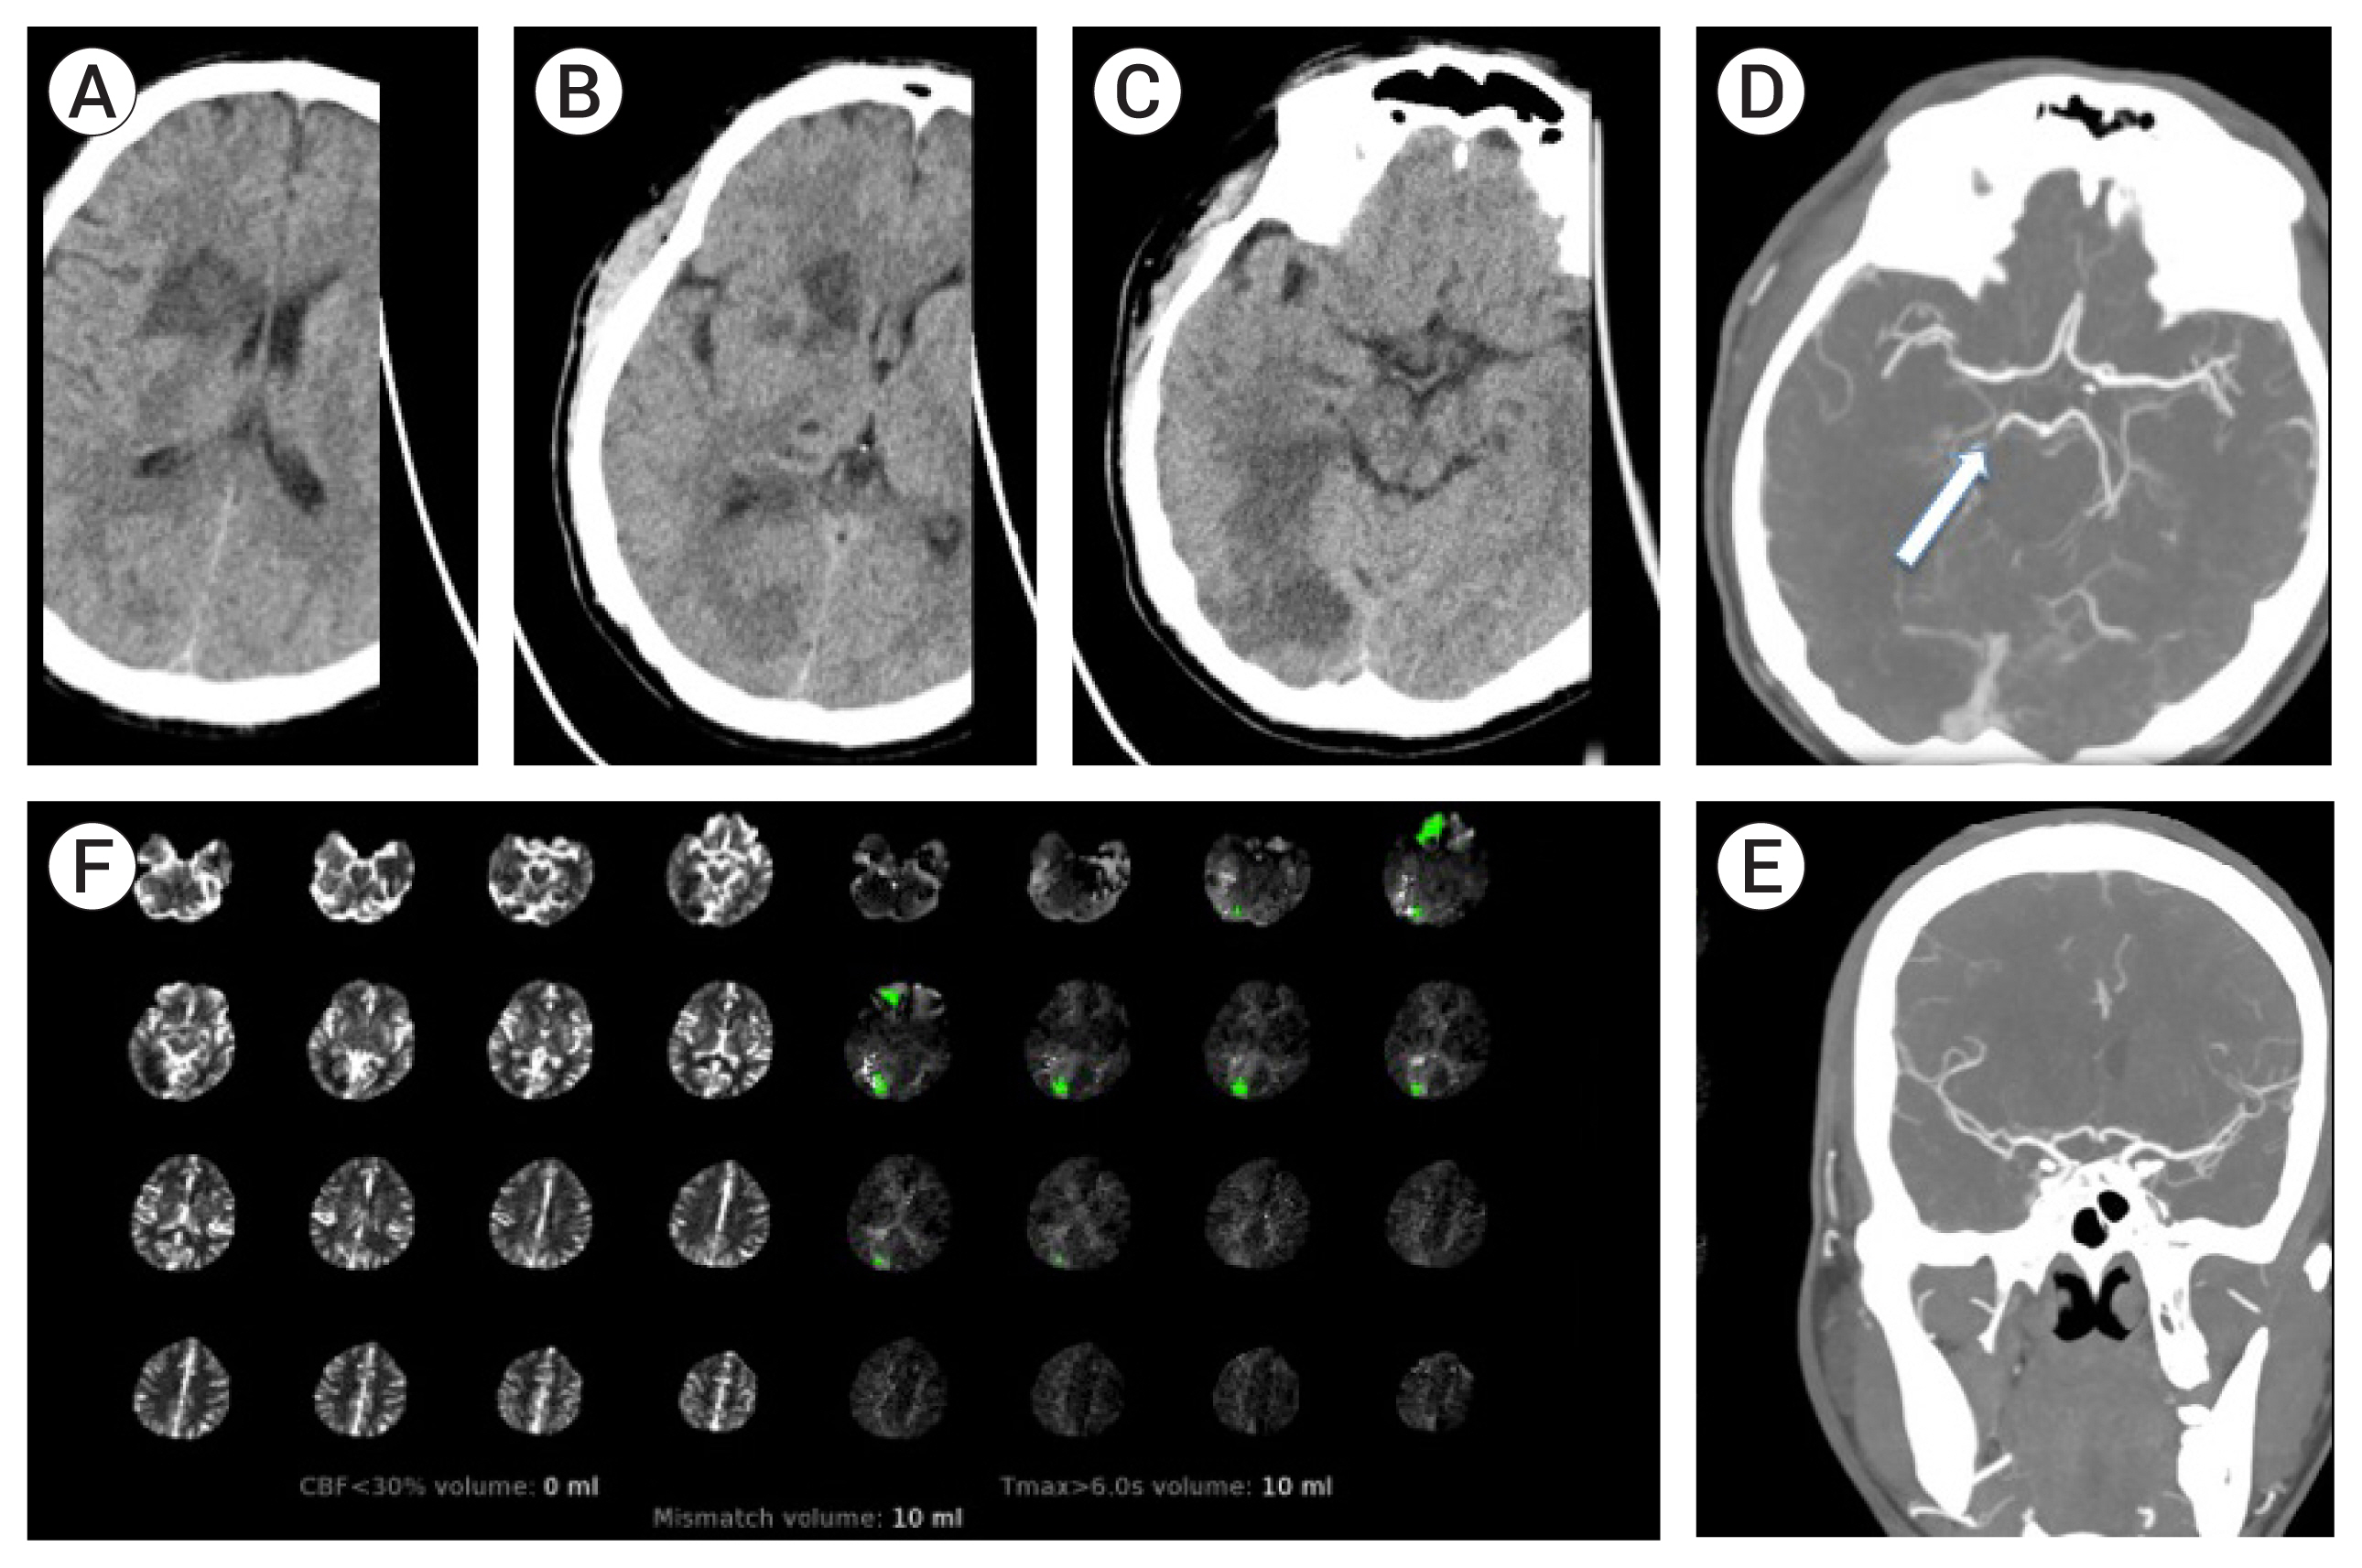
In the study period, 635 patients were evaluated for acute stroke symptoms. Non-contrast head CT was performed in 635 patients, and CTP with RAPID software post processing was performed in 134 patients. Among the 134 patients, 8 (5.9%) patients had gross discrepancy in core infarct between CT and CTP, with underestimation of infarct by CTP. Evaluation of these cases shows that the likely reason for this discrepancy is recanalization of a LVO, which then leads to erroneously normal or gross underestimate of the core infarct volume determined from CTP post processing analysis.
Conclusions
Recanalization of a LVO can lead to erroneously normal or gross underestimation of the core infarct as determined by post processing software analysis of CTP data. The whole composite of hyperacute CT imaging should be examined while making decisions. This caveat of perfusion imaging interpretation has not been reported previously.
Keyword
Figure
Reference
-
1. Albers GW, Marks MP, Kemp S, Christensen S, Tsai JP, Ortega-Gutierrez S, et al. Thrombectomy for stroke at 6 to 16 hours with selection by perfusion imaging. N Engl J Med. 2018; Feb. 378(8):708–18.
Article2. Campbell BC, Christensen S, Levi CR, Desmond PM, Donnan GA, Davis SM, et al. Cerebral blood flow is the optimal CT perfusion parameter for assessing infarct core. Stroke. 2011; Dec. 42(12):3435–40.
Article3. Christensen S, Campbell BCV, Perez de la Ossa N, Lansberg MG, Straka M, De Silva DA. Optimal perfusion thresholds for prediction of tissue destined for infarction in the combined EPITHET and DEFUSE dataset. Stroke. 2010; 41:e297.4. Ma H, Campbell BCV, Parsons MW, Churilov L, Levi CR, Hsu C, et al. Thrombolysis guided by perfusion imaging up to 9 hours after onset of stroke. N Engl J Med. 2019; May. 380(19):1795–803.
Article5. Nogueira RG, Jadhav AP, Haussen DC, Bonafe A, Budzik RF, Bhuva P, et al. Thrombectomy 6 to 24 hours after stroke with a mismatch between deficit and infarct. N Engl J Med. 2018; Jan. 378(1):11–21.6. Olivot JM, Mlynash M, Thijs VN, Kemp S, Lansberg MG, Wechsler L, et al. Optimal Tmax threshold for predicting penumbral tissue in acute stroke. Stroke. 2009; Feb. 40(2):469–75.
Article7. Powers WJ, Rabinstein AA, Ackerson T, Adeoye OM, Bambakidis NC, Becker K, et al. 2018 Guidelines for the early management of patients with acute ischemic stroke: a guideline for healthcare professionals from the American Heart Association/American Stroke Association. Stroke. 2018; Mar. 49(3):e46–110.
Article8. Zaro-Weber O, Moeller-Hartmann W, Heiss WD, Sobesky J. Maps of time to maximum and time to peak for mismatch definition in clinical stroke studies validated with positron emission tomography. Stroke. 2010; Dec. 41(12):2817–21.
Article
- Full Text Links
- Actions
-
Cited
- CITED
-
- Close
- Share
- Similar articles
-
- Infarct Core Expansion on Computed Tomography before and after Intravenous Thrombolysis
- Occlusive Myocardial Infarction: Cardiac CT Perfusion in a Rat Model
- Multiphasic Perfusion CT in Acute Middle Cerebral Artery Ischemic Stroke: Prediction of Final Infarct Volume and Correlation with Clinical Outcome
- Comparison of Diagnostic Usefulness of Multi-Channel CT Perfusion and Conventional Brain CT in the Acute Pontine Infarct
- Massive Intraventricular Air Embolism after Contrast-enhanced CT: Report of Two Cases


