A Novel Method for Hyperacuity Measurement
- Affiliations
-
- 1Department of Ophthalmology, Ewha Womans University College of Medicine, Seoul, Korea.
- 2Cheonan Kim's Eye Clinic, Cheonan, Korea. jjongofhim@hanmail.com
- KMID: 2470740
- DOI: http://doi.org/10.3341/jkos.2020.61.2.175
Abstract
- PURPOSE
We developed a novel method for measurement of hyperacuity and verified the utility thereof.
METHODS
We developed a three-dimensional (3D) hyperacuity test using a 3D liquid crystal flat screen, a left- and right-image polarized display, and liquid crystal shutter glasses. We tested the technique in three groups: normal (n = 48), with cataracts (n = 14), and with macular disease (n = 35). We used a chart consisting of five dots and a reference line. Of the five dots, one was variably shifted from the other dots. A chart was presented to one eye and the reference line or blank image to the other eye; a subject scored positive when the dot in the unusual position was recognized.
RESULTS
Hyperacuity was measured in terms of the reference line seen by the reference eye (RR), a blank image seen by the reference eye (RB), the reference line seen by the contralateral eye (CR), and a blank image seen by the contralateral eye (CB). All test scores were significantly lower when the reference line was seen than not (RR vs. RB and CR vs. CB; p < 0.01, respectively). For the RR and CR tests, no significant difference was apparent between the normal and cataracts group (p = 0.553, p = 0.494) but such differences were evident between the normal and macular disease groups (p = 0.028, p = 0.002). Also, visualization of the reference line by the reference and contralateral eyes did not differ (p > 0.05).
CONCLUSIONS
Measurement of hyperacuity using our new method was not affected by media opacity but was significantly affected by macular disease. Presentation of a reference line facilitated hyperacuity assessment.
Figure
-

Figure 1 Actual measurement of hyperacuity. For binocular vision separation, the target was projected onto a polarization monitor and the subject wore polarized glasses (3 dimensional glasses) orthogonal to both eyes.
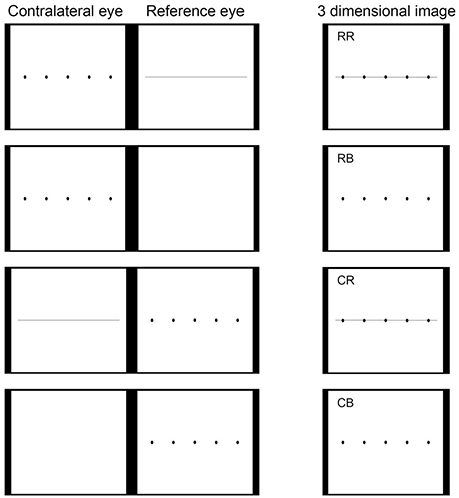
Figure 2 Chart developed for hyperacuity measurement. It consists of target images which consist of 5 dots with reference line and without reference line. When subject wears 3 dimensional (3D) glasses and looks at the target, it looks like a 3D image. RR = reference eye has a reference line and dots on the contralateral eye; RB = reference eye has a blank image and dots on the contralateral eye; CR = reference eye has dots and reference line on the contralateral eye; CB = reference eye has dots and blank image on the contralateral eye.
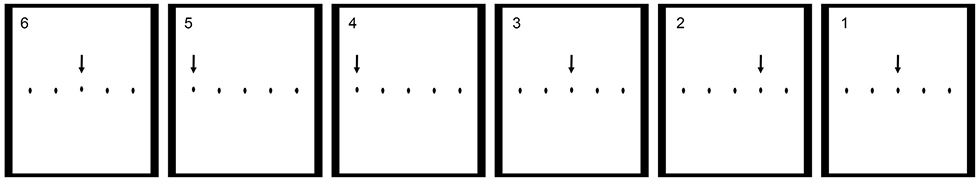
Figure 3 Chart developed for hyperacuity measurement. This image consists of five dots. Randomly one of five dots is out of baseline. Grades are from 6 to 1, and are indicated at the upper left of each chart. Each grade means that the deviation is from 6 pixel to 1 pixel from the baseline. In the figure above, grade 6 (the first chart on the left) is a dot 6 pixel away from the baseline, which corresponds to the third dot (The downwards arrow points to the dot that is out of the baseline, which does not appear in the actual chart).
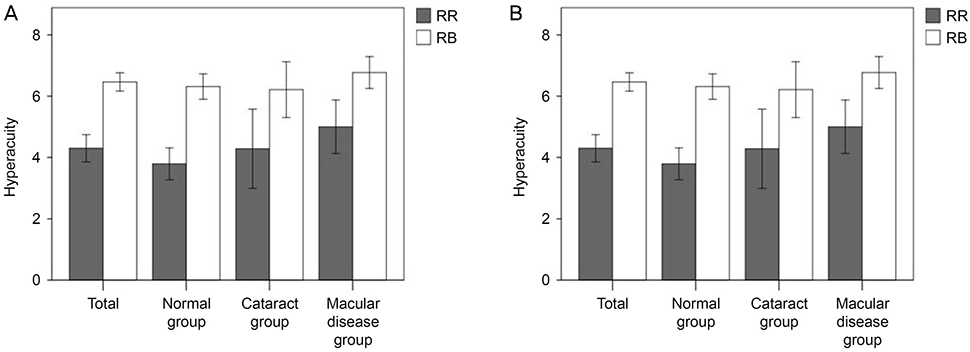
Figure 4 Difference in hyperacuity with or without reference line. The analysis was divided into two cases: Reference line on the reference eye (A) and the contralateral eye (B). All groups can detect more sensitively than when there is no reference line (all p < 0.05). p-value is obtained from Wilcoxon signed rank test. RR = reference eye has a reference line and dots on the contralateral eye; RB = reference eye has a blank image and dots on the contralateral eye; CR = reference eye has dots and reference line on the contralateral eye; CB = reference eye has dots and blank image on the contralateral eye.
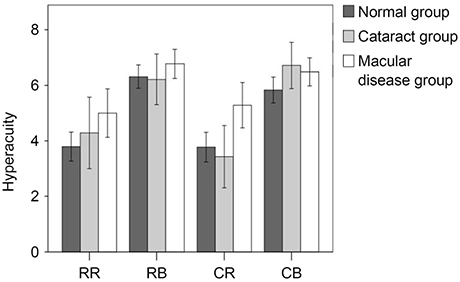
Figure 5 Difference in hyperacuity by group. Normal group and cataract group showed no difference in hyperacuity, but normal group and macular disease showed significant differences in RR (p = 0.028) and CR (p = 0.002). p-value is obtained from Mann-Whitney U test. RR = reference eye has a reference line and dots on the contralateral eye; RB = reference eye has a blank image and dots on the contralateral eye; CR = reference eye has dots and reference line on the contralateral eye; CB = reference eye has dots and blank image on the contralateral eye.
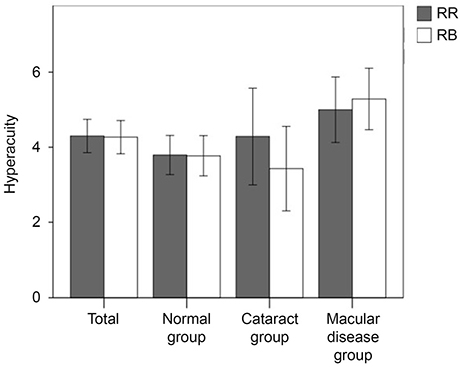
Figure 6 Difference in hyperacuity depending on site of reference line. There is no difference in the hyperacuity when the reference line is in the reference eye or contralateral eye. p-value is obtained from Wilcoxon signed rank test. RR = reference eye has a reference line and dots on the contralateral eye; CR = reference eye has dots and reference line on the contralateral eye.
Reference
-
1. Chaikitmongkol V, Bressler NM, Bressler SB. Early detection of choroidal neovascularization facilitated with a home monitoring program in age-related macular degeneration. Retin Cases Brief Rep. 2015; 9:33–37.
Article2. Lakshminarayanan V, Aziz S, Enoch J. Quantification of metamorphopsia using hyperacuity techniques. Optom Vis Sci. 1991; 68:942–945.
Article3. Westheimer G. The spatial sense of the eye. Proctor lecture. Invest Ophthalmol Vis Sci. 1979; 18:893–912.4. Essock EA, Williams RA, Enoch JM, Raphael S. The effects of image degradation by cataract on vernier acuity. Invest Ophthalmol Vis Sci. 1984; 25:1043–1050.5. Enoch J, Williams R, Essock E, Fendick M. Hyperacuity: a promising means of evaluating vision through cataract. Progress in Retinal Research. 1985; 4:67–88.6. Whitaker D, Buckingham T. Theory and evidence for a clinical hyperacuity test. Ophthalmic Physiol Opt. 1987; 7:431–435.
Article7. Enoch JM, Williams RA, Essock EA, Barricks M. Hyperacuity perimetry. Assessment of macular function through ocular opacities. Arch Ophthalmol. 1984; 102:1164–1168.8. Simunovic MP. Metamorphopsia and its quantification. Retina. 2015; 35:1285–1291.
Article9. Enoch JM, Knowles RA. University of California. Method for evaluating metamorphopsia. United States patent. US 4,798,456. 1987. 03. 23.10. Wylegala E, Pilat J, Teper S, et al. Monitoring of photodynamic therapy results in age-related macular degeneration by means of preferential hyperacuity perimeter. Eur J Ophthalmol. 2007; 17:768–775.
Article11. Loewenstein A, Malach R, Goldstein M, et al. Replacing the Amsler grid: a new method for monitoring patients with age-related macular degeneration. Ophthalmology. 2003; 110:966–970.12. Ku JY, Milling AF, Pitrelli Vazquez N, Knox PC. Performance, usability and comparison of two versions of a new macular vision test: the handheld Radial Shape Discrimination test. Peer J. 2016; 4:e2650.
Article13. Mohaghegh N, Zadeh EG, Magierowski S. Wearable diagnostic system for age-related macular degeneration. In : 38th Annual International Conference of the IEEE EBMC; 2016 Oct 18; Orlando, FL. Piscataway (NJ): Engineering in Medicine and Biology Society;c2016. p. 6006–6009.14. Kim M, Yu SY, Kwak HW. Association between hyperacuity defects and retinal microstructure in polypoidal choroidal vasculopathy. Indian J Ophthalmol. 2014; 62:702–706.
Article15. Casalino G, Del Turco C, Corvi F, et al. Short-term retinal sensitivity and metamorphopsia changes following half-fluence photodynamic therapy in central serous chorioretinopathy. Ophthalmic Res. 2016; 56:23–29.
Article16. Keane PA, de Salvo G, Sim DA, et al. Strategies for improving early detection and diagnosis of neovascular age-related macular degeneration. Clin Ophthalmol. 2015; 9:353–366.
- Full Text Links
-
- Actions
-
Cited
- CITED
-
- Close
- Share
-
- Similar articles
-
- Preferential Hyperacuity Perimeter in Exudative AMD With Pigment Epithelial Detachment
- Preferential Hyperacuity Perimeter (PHP) in Myopic CNV
- Correlation of OCT and Preferential Hyperacuity Perimeter in Exudative Age-related Macular Degeneration
- Analysis of Preferential Hyperacuity Perimeter Results in Maculopathy Caused by Various Retinal Diseases
- An Analysis of Metamorphopsia Using Preferential Hyperacuity Perimeter Following Macular-off RRD Surgical Repair
