Interobserver and Test-Retest Reproducibility of T1Ï and T2 Measurements of Lumbar Intervertebral Discs by 3T Magnetic Resonance Imaging
- Affiliations
-
- 1Department of Radiology, Gangnam Severance Hospital, Yonsei University College of Medicine, Seoul 06273, Korea. AGN70@yuhs.ac
- 2GE Health Care, Seoul 06060, Korea.
- 3Biostatistics Collaboration Lab, Yonsei University College of Medicine, Seoul 03722, Korea.
- 4GE Health Care, Milwaukee, WI 53209, USA.
- 5Department of Radiology, Severance Hospital, Yonsei University College of Medicine, Seoul 03722, Korea.
- KMID: 2466287
- DOI: http://doi.org/10.3348/kjr.2016.17.6.903
Abstract
OBJECTIVE
To investigate the interobserver and test-retest reproducibility of T1Ï and T2 measurements of lumbar intervertebral discs using 3T magnetic resonance imaging (MRI).
MATERIALS AND METHODS
This study included a total of 51 volunteers (female, 26; male, 25; mean age, 54 ± 16.3 years) who underwent lumbar spine MRI with a 3.0 T scanner. Amongst these subjects, 40 underwent repeat T1Ï and T2 measurement acquisitions with identical image protocol. Two observers independently performed the region of interest measurements in the nuclei pulposi of the discs from L1-2 through L5-S1 levels. Statistical analysis was performed using intraclass correlation coefficient (ICC) with a two-way random model of absolute agreement. Comparison of the ICC values was done after acquisition of ICC values using Z test. Statistical significance was defined as p value < 0.05.
RESULTS
The ICCs of interobserver reproducibility were 0.951 and 0.672 for T1Ï and T2 mapping, respectively. The ICCs of test-retest reproducibility (40 subjects) for T1Ï and T2 measurements were 0.922 and 0.617 for observer A and 0.914 and 0.628 for observer B, respectively. In the comparison of the aforementioned ICCs, ICCs of interobserver and test-retest reproducibility for T1Ï mapping were significantly higher than T2 mapping (p < 0.001).
CONCLUSION
The interobserver and test-retest reproducibility of T1Ï mapping were significantly higher than those of T2 mapping for the quantitative assessment of nuclei pulposi of lumbar intervertebral discs.
Keyword
MeSH Terms
-
Adult
Aged
Female
Humans
Intervertebral Disc/diagnostic imaging
Intervertebral Disc Degeneration/*diagnosis/diagnostic imaging/pathology
Lumbar Vertebrae/diagnostic imaging
*Magnetic Resonance Imaging
Male
Middle Aged
Nucleus Pulposus/diagnostic imaging
Prospective Studies
Reproducibility of Results
Severity of Illness Index
Figure
-
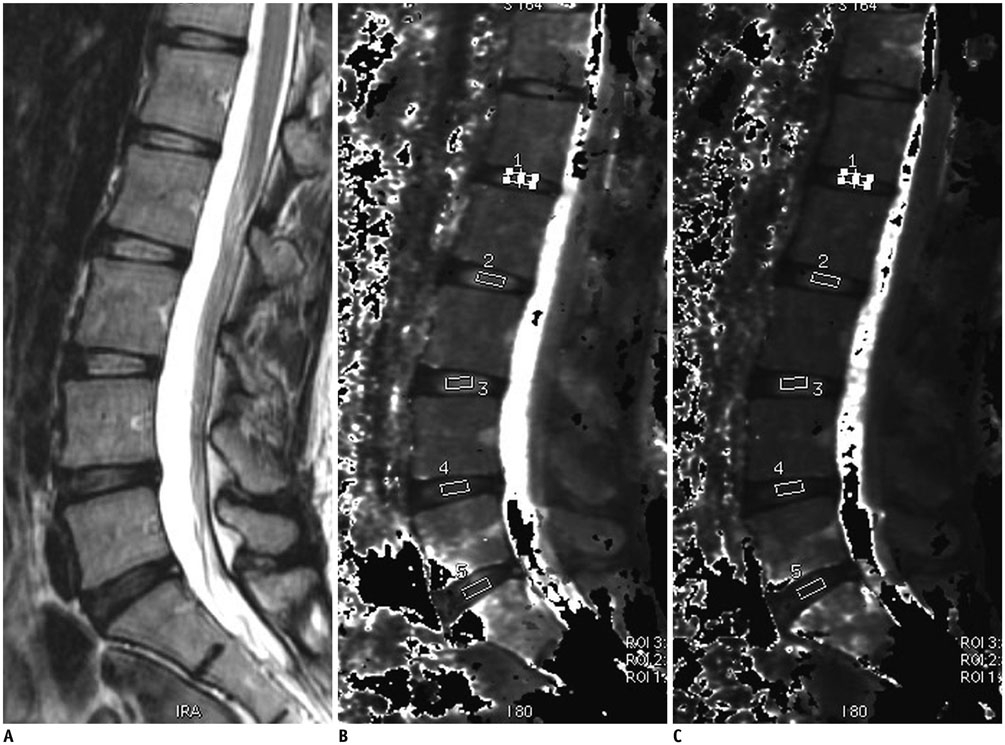
Fig. 1 Representative image of region of interest (ROI) placement in T1ρ and T2 maps. Eexample of region of placement (ROI) in T1ρ (B) and T2 (C) mapping images of 33-year-old female subject with low back pain. On basis of sagittal T2-weighted MR image (A), rectangular ROI was placed at nucleus pulposus of intervertebral disc in T1ρ mapping image (B). Once ROI placement in T1ρ mapping images was done for nucleus pulposus of intervertebral disc, simultaneous ROI placement at corresponding disc portion in T2 mapping images was automatically obtained. Area of ROI was 30 mm2. A. T2-weighted 2D-FSE (two-dimensional fast spin-echo) images acquired in sagittal plane. B. T1ρ mapping image acquired in sagittal plane (L1–2, L2–3, L3–4, L4–5, L5–S1). C. T2 mapping image acquired in sagittal plane (L1–2, L2–3, L3–4, L4–5, L5–S1).
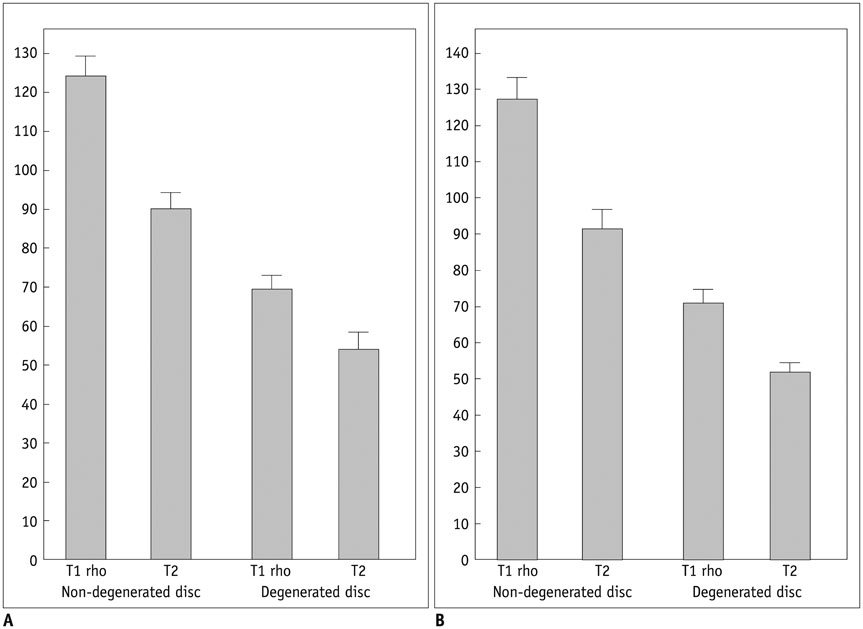
Fig. 2 Bar graphs of T1ρ and T2 measurements of each observer according to severity of intervertebral disc degeneration graded according to Pfirrmann grading system. Bar graphs of mean values of T1ρ and T2 measurements of nuclei pulposi graded according to Pfirmann grading system, measured by observers (A, B). Grade 5 (n = 84) discs were excluded. Mean measurements of two mapping sequence are depicted in different colors. Graphs indicate significantly lower T1ρ and T2 value in degenerative discs group as compared to those in non-degenerated disc group (p < 0.05).
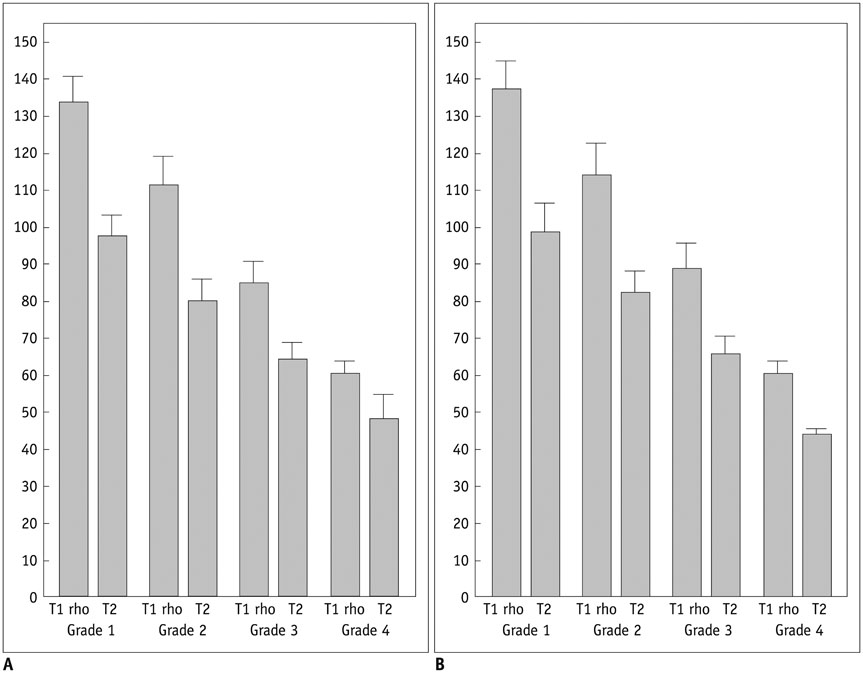
Fig. 3 Bar graphs of T1ρ and T2 measurements according to severity of intervertebral disc degeneration graded according to Pfirrmann grading system. There was inverse correlation between mean values of T1ρ and T2 measurements of discs graded according to Pfirrmann grading system, measured by observers (A, B).
Reference
-
1. Luoma K, Riihimäki H, Luukkonen R, Raininko R, Viikari-Juntura E, Lamminen A. Low back pain in relation to lumbar disc degeneration. Spine (Phila Pa 1976). 2000; 25:487–492.2. Hadjipavlou AG, Tzermiadianos MN, Bogduk N, Zindrick MR. The pathophysiology of disc degeneration: a critical review. J Bone Joint Surg Br. 2008; 90:1261–1270.3. Cassinelli EH, Hall RA, Kang JD. Biochemistry of intervertebral disc degeneration and the potential for gene therapy applications. Spine J. 2001; 1:205–214.4. Carl A, Ledet E, Yuan H, Sharan A. New developments in nucleus pulposus replacement technology. Spine J. 2004; 4:6 Suppl. 325S–329S.5. Urban JP, Roberts S. Degeneration of the intervertebral disc. Arthritis Res Ther. 2003; 5:120–130.6. Pfirrmann CW, Metzdorf A, Zanetti M, Hodler J, Boos N. Magnetic resonance classification of lumbar intervertebral disc degeneration. Spine (Phila Pa 1976). 2001; 26:1873–1878.7. Auerbach JD, Johannessen W, Borthakur A, Wheaton AJ, Dolinskas CA, Balderston RA, et al. In vivo quantification of human lumbar disc degeneration using T(1rho)-weighted magnetic resonance imaging. Eur Spine J. 2006; 15:Suppl 3. S338–S344.8. Wang L, Regatte RR. T1ρ MRI of human musculoskeletal system. J Magn Reson Imaging. 2015; 41:586–600.9. Liess C, Lüsse S, Karger N, Heller M, Glüer CC. Detection of changes in cartilage water content using MRI T2-mapping in vivo. Osteoarthritis Cartilage. 2002; 10:907–913.10. Surowiec RK, Lucas EP, Ho CP. Quantitative MRI in the evaluation of articular cartilage health: reproducibility and variability with a focus on T2 mapping. Knee Surg Sports Traumatol Arthrosc. 2014; 22:1385–1395.11. Zhu T, Ai T, Zhang W, Li T, Li X. Segmental quantitative MR imaging analysis of diurnal variation of water content in the lumbar intervertebral discs. Korean J Radiol. 2015; 16:139–145.12. Zobel BB, Vadalà G, Del Vescovo R, Battisti S, Martina FM, Stellato L, et al. T1ρ magnetic resonance imaging quantification of early lumbar intervertebral disc degeneration in healthy young adults. Spine (Phila Pa 1976). 2012; 37:1224–1230.13. Yi JS, Cha JG, Han JK, Kim HJ. Imaging of herniated discs of the cervical spine: inter-modality differences between 64-Slice multidetector CT and 1.5-T MRI. Korean J Radiol. 2015; 16:881–888.14. Antoniou J, Epure LM, Michalek AJ, Grant MP, Iatridis JC, Mwale F. Analysis of quantitative magnetic resonance imaging and biomechanical parameters on human discs with different grades of degeneration. J Magn Reson Imaging. 2013; 38:1402–1414.15. Zhou Z, Jiang B, Zhou Z, Pan X, Sun H, Huang B, et al. Intervertebral disk degeneration: T1ρ MR imaging of human and animal models. Radiology. 2013; 268:492–500.16. Lin LI. A concordance correlation coefficient to evaluate reproducibility. Biometrics. 1989; 45:255–268.17. Fischer RA. Statistical methods for research workers. Biological monographs and manuals. 5th ed. Edinburgh: Stechert/Oliver and Boyd;1925.18. Wang YX, Zhao F, Griffith JF, Mok GS, Leung JC, Ahuja AT, et al. T1rho and T2 relaxation times for lumbar disc degeneration: an in vivo comparative study at 3.0-Tesla MRI. Eur Radiol. 2013; 23:228–234.19. Zhang X, Yang L, Gao F, Yuan Z, Lin X, Yao B, et al. Comparison of T1ρ and T2* relaxation mapping in patients with different grades of disc degeneration at 3T MR. Med Sci Monit. 2015; 21:1934–1941.20. Menezes-Reis R, Salmon CE, Carvalho CS, Bonugli GP, Chung CB, Nogueira-Barbosa MH. T1ρ and T2 mapping of the intervertebral disk: comparison of different methods of segmentation. AJNR Am J Neuroradiol. 2015; 36:606–611.21. Jordan CD, McWalter EJ, Monu UD, Watkins RD, Chen W, Bangerter NK, et al. Variability of CubeQuant T1ρ, quantitative DESS T2, and cones sodium MRI in knee cartilage. Osteoarthritis Cartilage. 2014; 22:1559–1567.22. Li X, Wyatt C, Rivoire J, Han E, Chen W, Schooler J, et al. Simultaneous acquisition of T1ρ and T2 quantification in knee cartilage: repeatability and diurnal variation. J Magn Reson Imaging. 2014; 39:1287–1293.23. Rauscher I, Stahl R, Cheng J, Li X, Huber MB, Luke A, et al. Meniscal measurements of T1rho and T2 at MR imaging in healthy subjects and patients with osteoarthritis. Radiology. 2008; 249:591–600.24. Carballido-Gamio J, Link TM, Li X, Han ET, Krug R, Ries MD, et al. Feasibility and reproducibility of relaxometry, morphometric, and geometrical measurements of the hip joint with magnetic resonance imaging at 3T. J Magn Reson Imaging. 2008; 28:227–235.25. Nishii T, Sugano N, Sato Y, Tanaka H, Miki H, Yoshikawa H. Three-dimensional distribution of acetabular cartilage thickness in patients with hip dysplasia: a fully automated computational analysis of MR imaging. Osteoarthritis Cartilage. 2004; 12:650–657.26. Akella SV, Regatte RR, Wheaton AJ, Borthakur A, Reddy R. Reduction of residual dipolar interaction in cartilage by spin-lock technique. Magn Reson Med. 2004; 52:1103–1109.27. Blumenkrantz G, Zuo J, Li X, Kornak J, Link TM, Majumdar S. In vivo 3.0-tesla magnetic resonance T1rho and T2 relaxation mapping in subjects with intervertebral disc degeneration and clinical symptoms. Magn Reson Med. 2010; 63:1193–1200.
- Full Text Links
-
- Actions
-
Cited
- CITED
-
- Close
- Share
-
- Similar articles
-
- Evaluation of Lumbar Intervertebral Disc Degeneration Using T1Ï and T2 Magnetic Resonance Imaging in a Rabbit Disc Injury Model
- Visualization of Disc Degeneration: Comparison between Magnetic Resonance Imaging and Discography
- Correlation of Magnetic Resonance Imaging of Lumbar Herniated Intervertebral Disc with Operative Findings
- Reliable Magnetic Resonance Imaging Based Grading System for Cervical Intervertebral Disc Degeneration
- Comparison of T1rho and T2 Mapping of Knee Articular Cartilage in an Asymptomatic Population
