Spatial and Temporal Characteristics of Visual Field Progression in Glaucoma Assessed by Parallel Factor Analysis
- Affiliations
-
- 1Department of Ophthalmology, Asan Medical Center, University of Ulsan College of Medicine, Seoul, Korea. sungeye@gmail.com
- KMID: 2448868
- DOI: http://doi.org/10.3341/kjo.2019.0004
Abstract
- PURPOSE
To explore spatial and temporal characteristics of glaucomatous visual field (VF) progression through multi-way decomposition of data.
METHODS
Six serial VF exams with intervals of 6.0 ± 1.0 months in 121 pre-perimetric glaucoma eyes and 80 perimetric glaucoma eyes were arranged into a three-dimensional cube. The data were decomposed using parallel factor analysis.
RESULTS
Three tri-linear components (i.e., spatial scores, temporal loadings, and subject-specific loadings) were identified. Component 1 clearly showed differences between superior and inferior hemispheres, linear trends over time, and wide variability in perimetric glaucoma. Findings were compatible with well-known characteristics of glaucomatous VF defects. Component 2 showed nasal and central areas in contrast with superior, inferior, and temporal peripheral locations, whereas component 3 showed a contrast between nasal and temporal hemispheres. Both components 2 and 3 failed to show clear temporal trends.
CONCLUSIONS
Identification of spatio-temporal patterns shows new possibilities for a multi-way decomposition methodology for earlier diagnosis and prediction of glaucomatous VF progression.
Figure
-
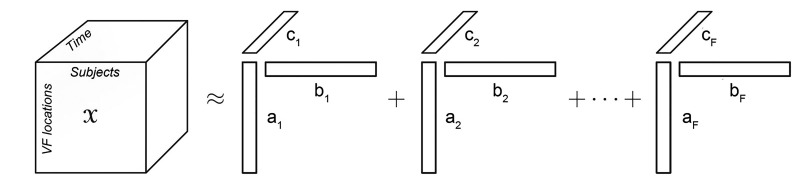
Fig. 1 Diagram representing the parallel factor analysis model. VF = visual field.
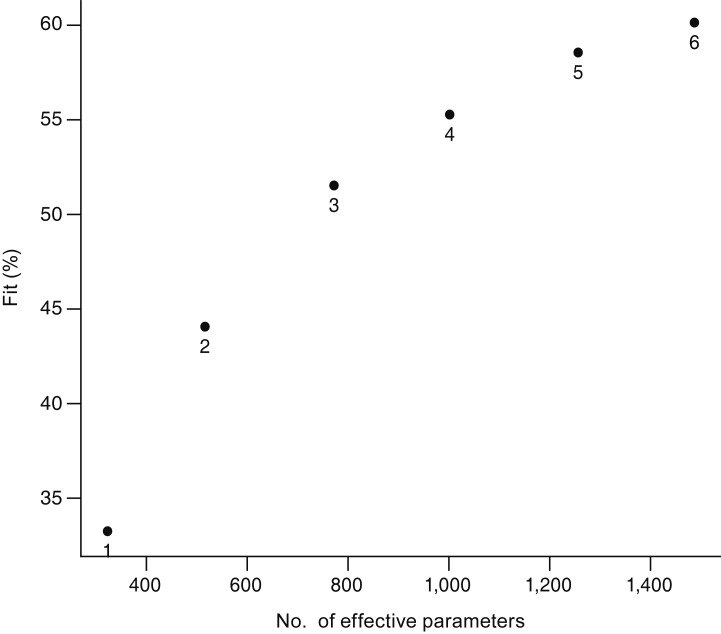
Fig. 2 Goodness of fit (%) with varying number of components (the number under each point denotes the number of components included in the analysis).
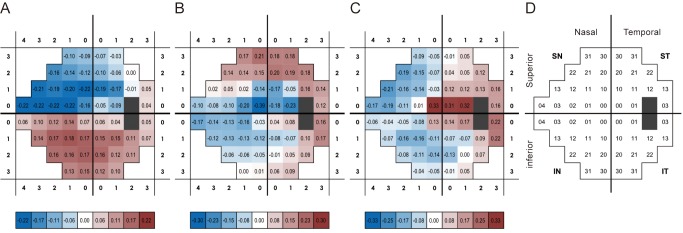
Fig. 3 Spatial scores of three components. (A) Component 1, (B) component 2, and (C) component 3 are arranged to match visual field locations (both eyes presented as the right eye). (D) Reference map of visual field locations. SN = superonasal; ST = superotemporal; IN = inferonasal; IT = inferotemporal.
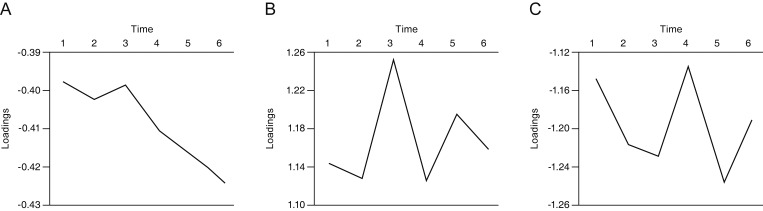
Fig. 4 Temporal loadings of three components. (A) Component 1 showed clear linear pattern. (B) Component 2 and (C) component 3 did not show the same trend (time 1 = initial follow-up, time 6 = last follow-up).
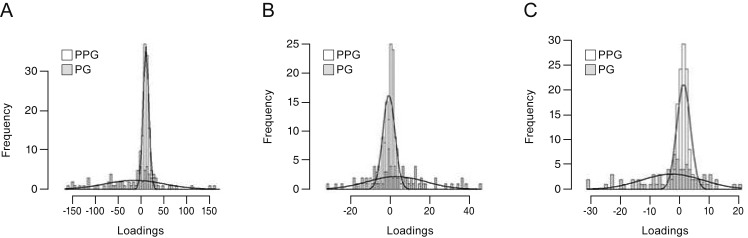
Fig. 5 Histogram of subject loadings by group. PG subjects had wider and subnormal distributions compared to PPG subjects in (A) component 1, (B) component 2, and (C) component 3. (A) Component 1 showed clear variability. PPG = pre-perimetric glaucoma; PG = perimetric glaucoma.
Reference
-
1. Goldbaum MH. Unsupervised learning with independent component analysis can identify patterns of glaucomatous visual field defects. Trans Am Ophthalmol Soc. 2005; 103:270–280. PMID: 17057807.
Article2. Asman P, Heijl A. Glaucoma hemifield test: automated visual field evaluation. Arch Ophthalmol. 1992; 110:812–819. PMID: 1596230.3. Marin-Franch I, Swanson WH, Malinovsky VE. A novel strategy for the estimation of the general height of the visual field in patients with glaucoma. Graefes Arch Clin Exp Ophthalmol. 2014; 252:801–809. PMID: 24638255.
Article4. Iester M, De Feo F, Douglas GR. Visual field loss morphology in high- and normal-tension glaucoma. J Ophthalmol. 2012; 2012:327326. PMID: 22496961.
Article5. Nouri-Mahdavi K, Hoffman D, Gaasterland D, Caprioli J. Prediction of visual field progression in glaucoma. Invest Ophthalmol Vis Sci. 2004; 45:4346–4351. PMID: 15557442.
Article6. Wilkins MR, Fitzke FW, Khaw PT. Pointwise linear progression criteria and the detection of visual field change in a glaucoma trial. Eye (Lond). 2006; 20:98–106. PMID: 15650759.
Article7. De Moraes CG, Liebmann CA, Susanna R Jr, et al. Examination of the performance of different pointwise linear regression progression criteria to detect glaucomatous visual field change. Clin Exp Ophthalmol. 2012; 40:e190–e196. PMID: 21902781.
Article8. Viswanathan AC, Fitzke FW, Hitchings RA. Early detection of visual field progression in glaucoma: a comparison of PROGRESSOR and STATPAC 2. Br J Ophthalmol. 1997; 81:1037–1042. PMID: 9497460.
Article9. Caprioli J, Mock D, Bitrian E, et al. A method to measure and predict rates of regional visual field decay in glaucoma. Invest Ophthalmol Vis Sci. 2011; 52:4765–4773. PMID: 21467178.
Article10. Bengtsson B, Heijl A. A visual field index for calculation of glaucoma rate of progression. Am J Ophthalmol. 2008; 145:343–353. PMID: 18078852.
Article11. Cho JW, Sung KR, Yun SC, et al. Progression detection in different stages of glaucoma: mean deviation versus visual field index. Jpn J Ophthalmol. 2012; 56:128–133. PMID: 22203464.
Article12. Bengtsson B, Patella VM, Heijl A. Prediction of glaucomatous visual field loss by extrapolation of linear trends. Arch Ophthalmol. 2009; 127:1610–1615. PMID: 20008716.
Article13. Nouri-Mahdavi K, Mock D, Hosseini H, et al. Pointwise rates of visual field progression cluster according to retinal nerve fiber layer bundles. Invest Ophthalmol Vis Sci. 2012; 53:2390–2394. PMID: 22427560.
Article14. Strouthidis NG, Vinciotti V, Tucker AJ, et al. Structure and function in glaucoma: the relationship between a functional visual field map and an anatomic retinal map. Invest Ophthalmol Vis Sci. 2006; 47:5356–5362. PMID: 17122124.
Article15. Quigley HA, Dunkelberger GR, Green WR. Retinal ganglion cell atrophy correlated with automated perimetry in human eyes with glaucoma. Am J Ophthalmol. 1989; 107:453–464. PMID: 2712129.
Article16. Yousefi S, Goldbaum MH, Balasubramanian M, et al. Learning from data: recognizing glaucomatous defect patterns and detecting progression from visual field measurements. IEEE Trans Biomed Eng. 2014; 61:2112–2124. PMID: 24710816.
Article17. Bresson-Dumont H, Hatton J, Foucher J, Fonteneau M. Visual field progression in glaucoma: cluster analysis. J Fr Ophtalmol. 2012; 35:735–741. PMID: 22771181.18. Pascual JP, Schiefer U, Paetzold J, et al. Spatial characteristics of visual field progression determined by Monte Carlo simulation: diagnostic innovations in glaucoma study. Invest Ophthalmol Vis Sci. 2007; 48:1642–1650. PMID: 17389495.
Article19. Carroll JD, Chang JJ. Analysis of individual differences in multidimensional scaling via an N-way generalization of “Eckart-Young” decomposition. Psychometrika. 1970; 35:283–319.
Article20. Harshman RA. Foundations of the PARAFAC procedure: models and conditions for an “explanatory” multimodal factor analysis. Los Angeles: University of California at Los Angeles;1970. p. 1–84.21. Bro R. PARAFAC: tutorial and applications. Chemom Intell Lab Syst. 1997; 38:149–171.
Article22. Deburchgraeve W, Cherian PJ, De Vos M, et al. Neonatal seizure localization using PARAFAC decomposition. Clin Neurophysiol. 2009; 120:1787–1796. PMID: 19736043.
Article23. Miwakeichi F, Martinez-Montes E, Valdes-Sosa PA, et al. Decomposing EEG data into space-time-frequency components using Parallel Factor Analysis. Neuroimage. 2004; 22:1035–1045. PMID: 15219576.
Article24. Beckmann CF, Smith SM. Tensorial extensions of independent component analysis for multisubject FMRI analysis. Neuroimage. 2005; 25:294–311. PMID: 15734364.
Article25. Martinez-Montes E, Valdes-Sosa PA, Miwakeichi F, et al. Concurrent EEG/fMRI analysis by multiway Partial Least Squares. Neuroimage. 2004; 22:1023–1034. PMID: 15219575.
Article26. Giordani P, Kiers HA, Del Ferraro MA. Three-way component analysis using the R package ThreeWay. J Stat Softw. 2014; 4. 22. DOI: 10.18637/jss.v057.i07.27. Kruskal JB. Three-way arrays: rank and uniqueness of trilinear decompositions, with application to arithmetic complexity and statistics. Linear Algebra Appl. 1977; 18:95–138.
Article28. Del Ferraro MA, Kiers HA, Giordani P. ThreeWay: three-way component analysis (version 1.1.3) [Internet]. [place unknown]: Comprehensive R Archive Network;2015. cited 2018 Dec 18. Available: https://cran.r-project.org/web/packages/ThreeWay/.29. He B, Liu Z. Multimodal functional neuroimaging: integrating functional MRI and EEG/MEG. IEEE Rev Biomed Eng. 2008; 1:23–40. PMID: 20634915.30. Varoquaux G, Sadaghiani S, Pinel P, et al. A group model for stable multi-subject ICA on fMRI datasets. Neuroimage. 2010; 51:288–299. PMID: 20153834.
Article31. Robinson SD, Schopf V. ICA of f MRI studies: new approaches and cutting edge applications. Front Hum Neurosci. 2013; 7:724. PMID: 24194712.32. Sui J, Pearlson G, Caprihan A, et al. Discriminating schizophrenia and bipolar disorder by fusing f MRI and DTI in a multimodal CCA+ joint ICA model. Neuroimage. 2011; 57:839–855. PMID: 21640835.33. Weis M, Jannek D, Roemer F, et al. Multi-dimensional PARAFAC2 component analysis of multi-channel EEG data including temporal tracking. Conf Proc IEEE Eng Med Biol Soc. 2010; 2010:5375–5378. PMID: 21096263.
Article34. De Moraes CG, Demirel S, Gardiner SK, et al. Effect of treatment on the rate of visual field change in the ocular hypertension treatment study observation group. Invest Ophthalmol Vis Sci. 2012; 53:1704–1709. PMID: 22395889.
Article35. Lee JR, Sung KR, Na JH, et al. Discrepancy between optic disc and nerve fiber layer assessment and optical coherence tomography in detecting glaucomatous progression. Jpn J Ophthalmol. 2013; 57:546–552. PMID: 24097099.
Article36. Na JH, Sung KR, Baek SH, et al. Rates a nd patterns of macular and circumpapillary retinal nerve fiber layer thinning in preperimetric and perimetric glaucomatous eyes. J Glaucoma. 2015; 24:278–285. PMID: 24633086.
- Full Text Links
-
- Actions
-
Cited
- CITED
-
- Close
- Share
-
- Similar articles
-
- Characteristecs of Visual Field Progression in Normal Tension Glaucoma
- Visual Field Defects and Disc Findings in Glaucoma
- Longitudinal Analysis of Retinal Nerve Fiber Layer Thickness With GDx-VCC in Glaucoma Suspect
- Correlation Between Nocturnal Dip and Progression of Glaucoma
- Visual Field Changes after Internal Limiting Membrane Peeling in Glaucoma Patients with Epiretinal Membrane
