Healthc Inform Res.
2019 Jan;25(1):27-32. 10.4258/hir.2019.25.1.27.
Modification of the Conventional Influenza Epidemic Models Using Environmental Parameters in Iran
- Affiliations
-
- 1Department of Health Information Management, School of Allied Medical Sciences, Tehran University of Medical Sciences, Tehran, Iran. niakan2@gmail.com
- 2Department of Health Information Management, School of Allied Medical Sciences, Lorestan University of Medical Sciences, Khorramabad, Iran.
- KMID: 2434533
- DOI: http://doi.org/10.4258/hir.2019.25.1.27
Abstract
OBJECTIVES
The association between the spread of infectious diseases and climate parameters has been widely studied in recent decades. In this paper, we formulate, exploit, and compare three variations of the susceptible-infected-recovered (SIR) model incorporating climate data. The SIR model is a well-studied model to investigate the dynamics of influenza viruses; however, the improved versions of the classic model have been developed by introducing external factors into the model.
METHODS
The modification models are derived by multiplying a linear combination of three complementary factors, namely, temperature (T), precipitation (P), and humidity (H) by the transmission rate. The performance of these proposed models is evaluated against the standard model for two outbreak seasons.
RESULTS
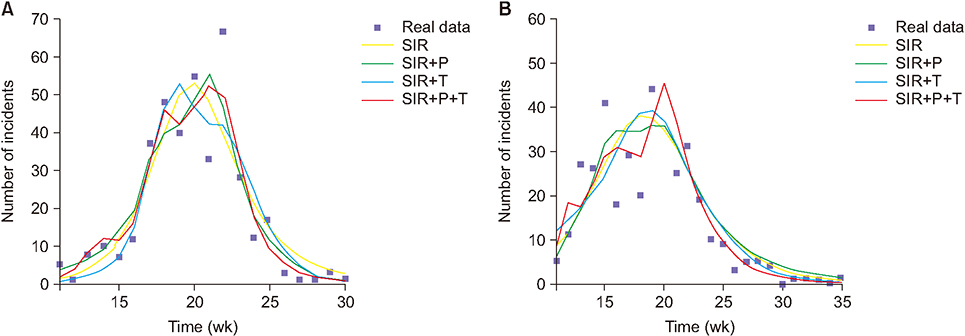
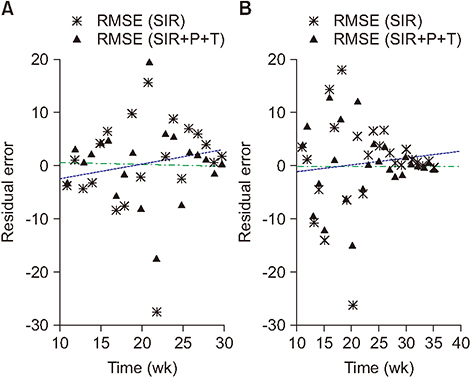
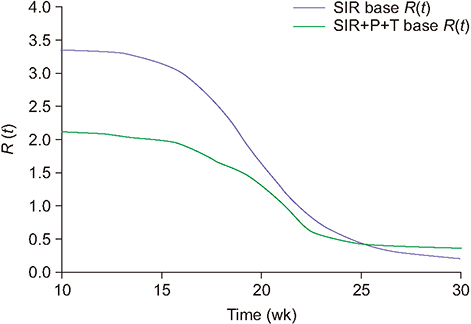
The values of the root-mean-square error (RMSE) and the Akaike information criterion (AIC) improved as they declined from 8.76 to 7.05 and from 98.12 to 93.01 for season 2013/14, respectively. Similarly, for season 2014/15, the RMSE and AIC decreased from 8.10 to 6.45 and from 117.73 to 107.91, respectively. The estimated values of R(t) in the framework of the standard and modified SIR models are also compared.
CONCLUSIONS
Through simulations, we determined that among the studied environmental factors, precipitation showed the strongest correlation with the transmission dynamics of influenza. Moreover, the SIR+P+T model is the most efficient for simulating the behavioral dynamics of influenza in the area of interest.
MeSH Terms
Figure
Reference
-
1. World Health Organization. Immunization, vaccines and biologicals [Internet]. Geneva, Switzerland: World Health Organization;2019. cited at 2019 Jan 15. Available from: https://www.who.int/immunization/en/.2. Paul MJ, Dredze M, Broniatowski D. Twitter improves influenza forecasting. PLoS Curr. 2014; 10. 28. DOI: 10.1371/currents.outbreaks.90b9ed0f59bae4ccaa683a39865d9117. [Epub].
Article3. Tchuenche JM, Dube N, Bhunu CP, Smith RJ, Bauch CT. The impact of media coverage on the transmission dynamics of human influenza. BMC Public Health. 2011; 11:Suppl 1. S5.
Article4. Shaman J, Pitzer VE, Viboud C, Grenfell BT, Lipsitch M. Absolute humidity and the seasonal onset of influenza in the continental United States. PLoS Biol. 2010; 8(2):e1000316.
Article5. McDevitt J, Rudnick S, First M, Spengler J. Role of absolute humidity in the inactivation of influenza viruses on stainless steel surfaces at elevated temperatures. Appl Environ Microbiol. 2010; 76(12):3943–3947.
Article6. Tamm I, Fluke DJ. The effect of monochromatic ultraviolet radiation on the infectivity and hemagglutinating ability of the influenza virus type A strain PR-8. J Bacteriol. 1950; 59(4):449–461.
Article7. Iha Y, Higa F, Sunagawa S, Naka M, Cash HL, Miyagi K, et al. Effect of climatic conditions on epidemic patterns of influenza in Okinawa, Japan, during the pandemic of 2009: surveillance of rapid antigen test results. Jpn J Infect Dis. 2012; 65(4):295–300.
Article8. Barreca AI, Shimshack JP. Absolute humidity, temperature, and influenza mortality: 30 years of countylevel evidence from the United States. Am J Epidemiol. 2012; 176:Suppl 7. S114–S122.
Article9. Soebiyanto RP, Clara WA, Jara J, Balmaseda A, Lara J, Lopez Moya M, et al. Associations between seasonal influenza and meteorological parameters in Costa Rica, Honduras and Nicaragua. Geospat Health. 2015; 10(2):372.
Article10. Soebiyanto RP, Clara W, Jara J, Castillo L, Sorto OR, Marinero S, et al. The role of temperature and humidity on seasonal influenza in tropical areas: Guatemala, El Salvador and Panama, 2008-2013. PLoS One. 2014; 9(6):e100659.
Article11. Heffernan JM, Smith RJ, Wahl LM. Perspectives on the basic reproductive ratio. J R Soc Interface. 2005; 2(4):281–293.
Article12. Li J, Blakeley D, Smith RJ. The failure of R0. Comput Math Methods Med. 2011; 2011:527610.13. Mozhgani SH, Zarei Ghobadi M, Moeini S, Pakzad R, Kananizadeh P, Behzadian F. Prevalence of human influenza virus in Iran: Evidence from a systematic review and meta-analysis. Microb Pathog. 2018; 115:168–174.
Article14. World Health Organization. Weekly Influenza Data for Iran [Internet]. Geneva, Switzerland: World Health Organization;c2019. cited at 2019 Jan 15. Available from: http://apps.who.int/flumart/Default?ReportNo=12.15. Earth System Research Laboratory. Physical Sciences Division (PSD) Web Transition Information [Internet]. Boulder (CO): Earth System Research Laboratory;c2018. cited at 2019 Jan 15. Available from: https://www.esrl.noaa.gov/psd/webswitch.html.16. Kanamitsu M, Ebisuzaki W, Woollen J, Yang SK, Hnilo J, Fiorino M, et al. Ncep-doe amip-ii reanalysis (r-2). Bull Am Meteorol Soc. 2002; 83(11):1631–1644.
Article17. Hethcote HW. The mathematics of infectious diseases. SIAM Rev. 2000; 42(4):599–653.
Article18. Endo A, Ejima K, Nishiura H. Capturing the transmission dynamics of the 2009 Japanese pandemic influenza H1N1 in the presence of heterogeneous immunity. Ann Epidemiol. 2018; 28(5):293–300.
Article19. Seo DW, Shin SY. Methods using social media and search queries to predict infectious disease outbreaks. Healthc Inform Res. 2017; 23(4):343–348.
Article
- Full Text Links
- Actions
-
Cited
- CITED
-
- Close
- Share
- Similar articles
-
- Using an influenza epidemic threshold different from those in the United States and Europe caused longer epidemic periods in Korea during the 2018– 2019, 2019–2020, and 2022–2023 seasons: a comparative study
- Prevention and Treatment of Influenza
- Application of the Time Derivative (TD) Method for Early Alert of Influenza Epidemics
- Social Distancing against COVID-19: Implication for the Control of Influenza
- Modification of the effect of ambient air temperature on cardiovascular and respiratory mortality by air pollution in Ahvaz, Iran


