Quality of Radiomic Features in Glioblastoma Multiforme: Impact of Semi-Automated Tumor Segmentation Software
- Affiliations
-
- 1Center for Medical-IT Convergence Technology Research, Advanced Institutes of Convergence Technology, Seoul National University, Suwon 16229, Korea. kimjhyo@snu.ac.kr
- 2Department of Radiology, Seoul National University Hospital, Seoul 03080, Korea.
- 3Department of Transdisciplinary Studies, Graduate School of Convergence Science and Technology, Seoul National University, Suwon 16229, Korea.
- 4Department of Electronic and Computer Engineering, National Chiao Tung University, Hsinchu 300, Taiwan.
- 5Department of Radiological Sciences, University of California, Los Angeles, Los Angeles, CA 90095, USA.
- KMID: 2427305
- DOI: http://doi.org/10.3348/kjr.2017.18.3.498
Abstract
OBJECTIVE
The purpose of this study was to evaluate the reliability and quality of radiomic features in glioblastoma multiforme (GBM) derived from tumor volumes obtained with semi-automated tumor segmentation software.
MATERIALS AND METHODS
MR images of 45 GBM patients (29 males, 16 females) were downloaded from The Cancer Imaging Archive, in which post-contrast T1-weighted imaging and fluid-attenuated inversion recovery MR sequences were used. Two raters independently segmented the tumors using two semi-automated segmentation tools (TumorPrism3D and 3D Slicer). Regions of interest corresponding to contrast-enhancing lesion, necrotic portions, and non-enhancing T2 high signal intensity component were segmented for each tumor. A total of 180 imaging features were extracted, and their quality was evaluated in terms of stability, normalized dynamic range (NDR), and redundancy, using intra-class correlation coefficients, cluster consensus, and Rand Statistic.
RESULTS
Our study results showed that most of the radiomic features in GBM were highly stable. Over 90% of 180 features showed good stability (intra-class correlation coefficient [ICC] ≥ 0.8), whereas only 7 features were of poor stability (ICC < 0.5). Most first order statistics and morphometric features showed moderate-to-high NDR (4 > NDR ≥1), while above 35% of the texture features showed poor NDR (< 1). Features were shown to cluster into only 5 groups, indicating that they were highly redundant.
CONCLUSION
The use of semi-automated software tools provided sufficiently reliable tumor segmentation and feature stability; thus helping to overcome the inherent inter-rater and intra-rater variability of user intervention. However, certain aspects of feature quality, including NDR and redundancy, need to be assessed for determination of representative signature features before further development of radiomics.
Keyword
MeSH Terms
Figure
-
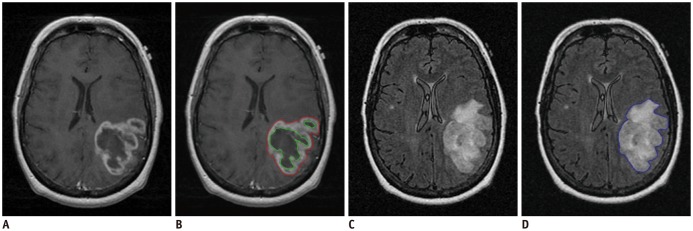
Fig. 1 MR images of example TCGA GBM case (TCGA-06-0213, 55-year-old female patient).Tumor segmentation was performed semi-automatically with TumorPrism3D.A. T1W post-contrast image. B. Segmented ROIs for enhancement (red) and necrosis (green) components. C. FLAIR image. D. Segmented ROI for non-enhancing T2 high signal intensity component (blue). FLAIR = fluid-attenuated inversion recovery, GBM = glioblastoma multiforme, ROI = region of interest, TCGA = The Cancer Genome Atlas, T1W = T1-weighted
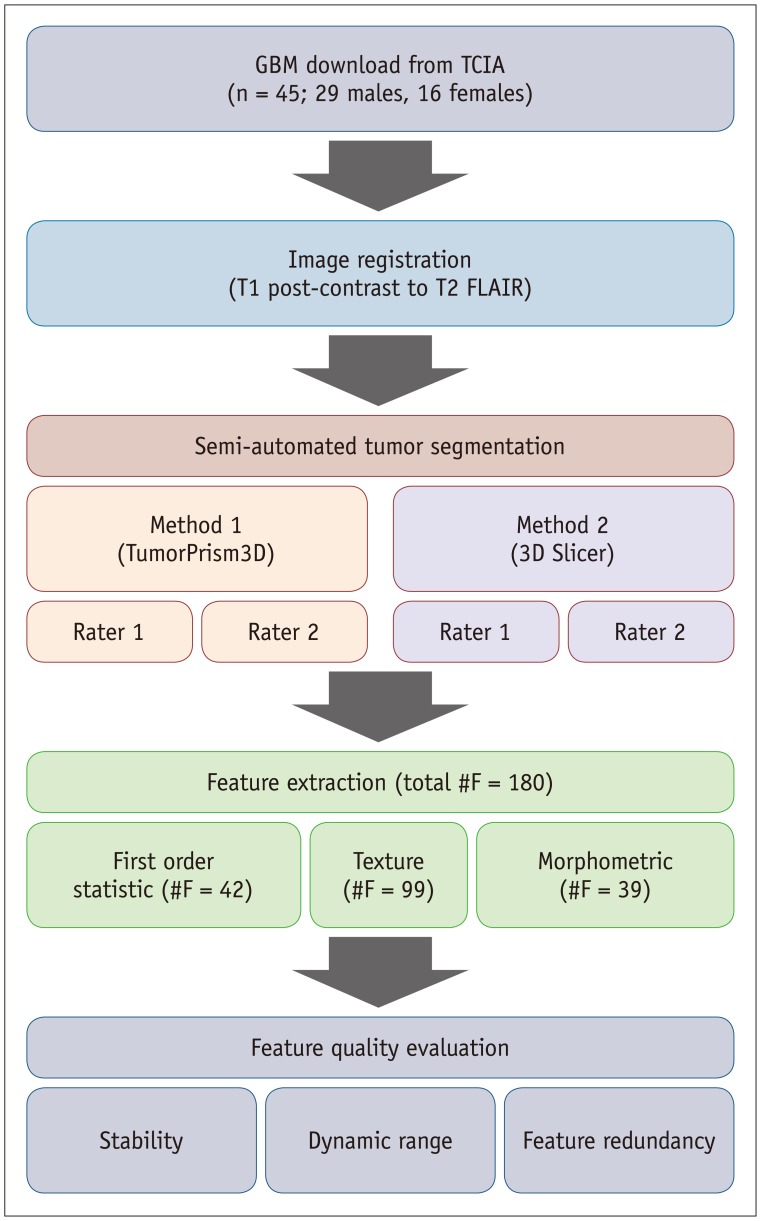
Fig. 2 Overall procedure of this study.Contrast enhanced-T1W and T2 FLAIR images were registered, followed by tumor segmentation by two different raters using two different semi-automated software tools. Subsequently, total of 180 imaging features were extracted from segmented ROIs and used for evaluating feature quality. FLAIR = fluid-attenuated inversion recovery, GBM = glioblastoma multiforme, ROIs = regions of interest, TCIA = The Cancer Imaging Archive, T1W = T1-weighted
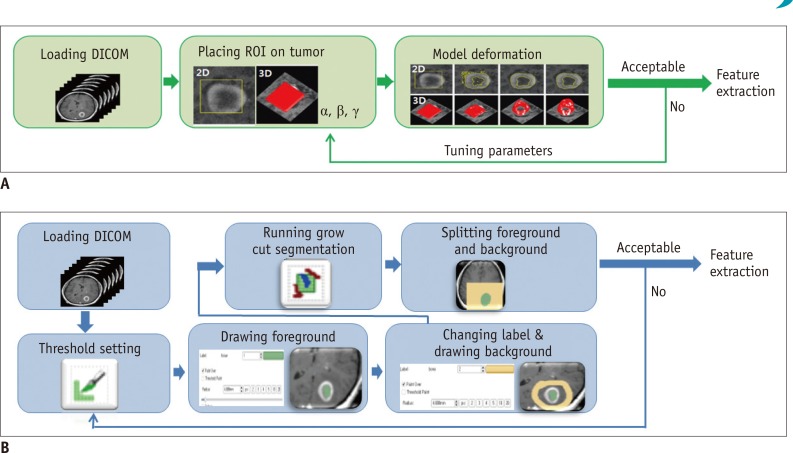
Fig. 3 Tumor segmentation procedures.A. TumorPrism3D. B. 3D Slicer. ROI = region of interest
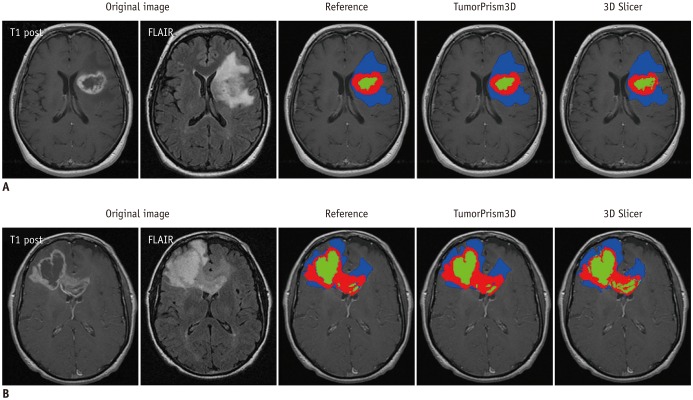
Fig. 4 Example of segmentation results with two semi-automated software tools.Contrast-enhanced, necrotic, and non-enhancing T2 high signal intensity components are indicated by red, green, and blue color, respectively.A. Represents case in which similar segmentation results were produced. B. Represents case in which difference was observed in segmentation results. FLAIR = fluid-attenuated inversion recovery
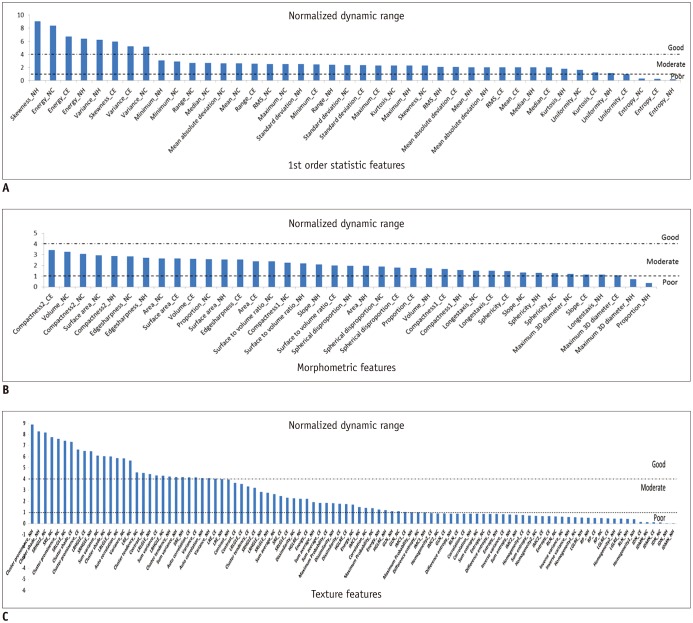
Fig. 5 Waterfall diagram of normalized dynamic range for three feature groups extracted from segmented tumor volumes with TumorPrism3D.A. 1st order statistic feature. B. Morphometric feature. C. Texture features. CE = contrast-enhancing, NC = necrotic, NH = non-enhancing T2 high signal intensity
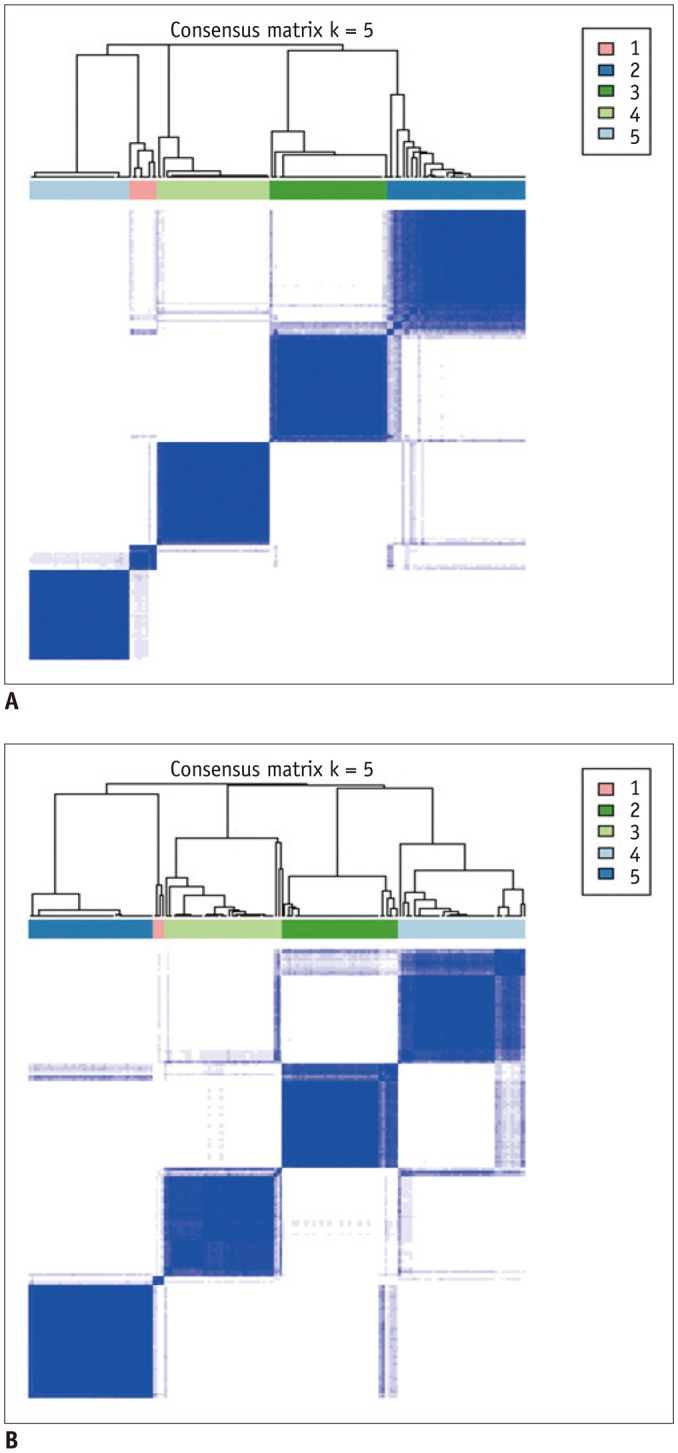
Fig. 6 Consensus maps of feature clusters.A. TumorPrism3D. B. 3D Slicer.
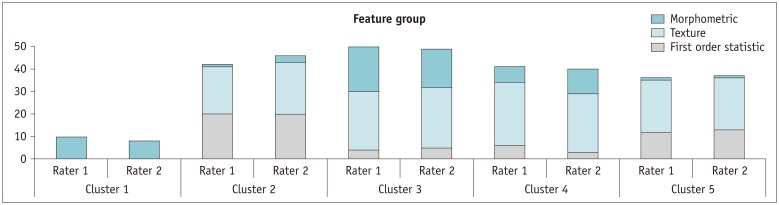
Fig. 7 Proportion of each feature group in 5 clusters.
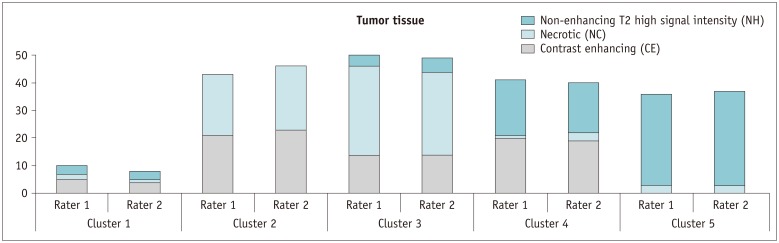
Fig. 8 Proportion of features related to each tumor component in 5 clusters.
Cited by 2 articles
-
Radiomics MRI Phenotyping with Machine Learning to Predict the Grade of Lower-Grade Gliomas: A Study Focused on Nonenhancing Tumors
Yae Won Park, Yoon Seong Choi, Sung Soo Ahn, Jong Hee Chang, Se Hoon Kim, Seung-Koo Lee
Korean J Radiol. 2019;20(9):1381-1389. doi: 10.3348/kjr.2018.0814.Imaging Informatics: A New Horizon for Radiologyin the Era of Artificial Intelligence, Big Data, and Data Science
Jong Hyo Kim
J Korean Soc Radiol. 2019;80(2):176-201. doi: 10.3348/jksr.2019.80.2.176.
Reference
-
1. Ohgaki H, Kleihues P. Epidemiology and etiology of gliomas. Acta Neuropathol. 2005; 109:93–108. PMID: 15685439.
Article2. Verhaak RG, Hoadley KA, Purdom E, Wang V, Qi Y, Wilkerson MD, et al. Integrated genomic analysis identifies clinically relevant subtypes of glioblastoma characterized by abnormalities in PDGFRA, IDH1, EGFR, and NF1. Cancer Cell. 2010; 17:98–110. PMID: 20129251.
Article3. Aerts HJ, Velazquez ER, Leijenaar RT, Parmar C, Grossmann P, Carvalho S, et al. Decoding tumour phenotype by noninvasive imaging using a quantitative radiomics approach. Nat Commun. 2014; 5:4006. PMID: 24892406.
Article4. Parmar C, Rios Velazquez E, Leijenaar R, Jermoumi M, Carvalho S, Mak RH, et al. Robust radiomics feature quantification using semiautomatic volumetric segmentation. PLoS One. 2014; 9:e102107. PMID: 25025374.
Article5. Kim M, Kim HS. Emerging techniques in brain tumor imaging: what radiologists need to know. Korean J Radiol. 2016; 17:598–619. PMID: 27587949.
Article6. Tixier F, Le Rest CC, Hatt M, Albarghach N, Pradier O, Metges JP, et al. Intratumor heterogeneity characterized by textural features on baseline 18F-FDG PET images predicts response to concomitant radiochemotherapy in esophageal cancer. J Nucl Med. 2011; 52:369–378. PMID: 21321270.
Article7. El Naqa I, Grigsby P, Apte A, Kidd E, Donnelly E, Khullar D, et al. Exploring feature-based approaches in PET images for predicting cancer treatment outcomes. Pattern Recognit. 2009; 42:1162–1171. PMID: 20161266.
Article8. Diehn M, Nardini C, Wang DS, McGovern S, Jayaraman M, Liang Y, et al. Identification of noninvasive imaging surrogates for brain tumor gene-expression modules. Proc Natl Acad Sci U S A. 2008; 105:5213–5218. PMID: 18362333.
Article9. Zinn PO, Mahajan B, Sathyan P, Singh SK, Majumder S, Jolesz FA, et al. Radiogenomic mapping of edema/cellular invasion MRI-phenotypes in glioblastoma multiforme. PLoS One. 2011; 6:e25451. PMID: 21998659.
Article10. Cancer Genome Atlas Research Network. Comprehensive genomic characterization defines human glioblastoma genes and core pathways. Nature. 2008; 455:1061–1068. PMID: 18772890.11. Gevaert O, Mitchell LA, Achrol AS, Xu J, Echegaray S, Steinberg GK, et al. Glioblastoma multiforme: exploratory radiogenomic analysis by using quantitative image features. Radiology. 2014; 273:168–174. PMID: 24827998.
Article12. Gutman DA, Cooper LA, Hwang SN, Holder CA, Gao J, Aurora TD, et al. MR imaging predictors of molecular profile and survival: multi-institutional study of the TCGA glioblastoma data set. Radiology. 2013; 267:560–569. PMID: 23392431.
Article13. Yang D, Rao G, Martinez J, Veeraraghavan A, Rao A. Evaluation of tumor-derived MRI-texture features for discrimination of molecular subtypes and prediction of 12-month survival status in glioblastoma. Med Phys. 2015; 42:6725–6735. PMID: 26520762.
Article14. Itakura H, Achrol AS, Mitchell LA, Loya JJ, Liu T, Westbroek EM, et al. Magnetic resonance image features identify glioblastoma phenotypic subtypes with distinct molecular pathway activities. Sci Transl Med. 2015; 7:303ra138.
Article15. The Cancer Imaging Archive (TCIA). Web site. March 5, 2016. http://www.cancerimagingarchive.net/.16. 3D Slicer. Web site. March 15, 2016. http://www.slicer.org/.17. Lee M, Cho W, Kim S, Park S, Kim JH. Segmentation of interest region in medical volume images using geometric deformable model. Comput Biol Med. 2012; 42:523–537. PMID: 22402196.
Article18. Balagurunathan Y, Gu Y, Wang H, Kumar V, Grove O, Hawkins S, et al. Reproducibility and prognosis of quantitative features extracted from CT images. Transl Oncol. 2014; 7:72–87. PMID: 24772210.
Article19. Kim H, Park CM, Lee SM, Lee HJ, Goo JM. A comparison of two commercial volumetry software programs in the analysis of pulmonary ground-glass nodules: segmentation capability and measurement accuracy. Korean J Radiol. 2013; 14:683–691. PMID: 23901328.
Article20. Egger J, Kapur T, Fedorov A, Pieper S, Miller JV, Veeraraghavan H, et al. GBM volumetry using the 3D Slicer medical image computing platform. Sci Rep. 2013; 3:1364. PMID: 23455483.
Article21. Zhu Y, Young GS, Xue Z, Huang RY, You H, Setayesh K, et al. Semi-automatic segmentation software for quantitative clinical brain glioblastoma evaluation. Acad Radiol. 2012; 19:977–985. PMID: 22591720.
Article22. Wilkerson MD. ConsensusClusterPlus (Tutorial). 2016. July 1, 2016. Available at: https://www.bioconductor.org/packages/devel/bioc/vignettes/ConsensusClusterPlus/inst/doc/ConsensusClusterPlus.pdf.23. de Hoop B, Gietema H, van Ginneken B, Zanen P, Groenewegen G, Prokop M. A comparison of six software packages for evaluation of solid lung nodules using semiautomated volumetry: what is the minimum increase in size to detect growth in repeated CT examinations. Eur Radiol. 2009; 19:800–808. PMID: 19018537.
Article24. Jung SC, Choi SH, Yeom JA, Kim JH, Ryoo I, Kim SC, et al. Cerebral blood volume analysis in glioblastomas using dynamic susceptibility contrast-enhanced perfusion MRI: a comparison of manual and semiautomatic segmentation methods. PLoS One. 2013; 8:e69323. PMID: 23950891.
Article25. Zou KH, Warfield SK, Bharatha A, Tempany CM, Kaus MR, Haker SJ, et al. Statistical validation of image segmentation quality based on a spatial overlap index. Acad Radiol. 2004; 11:178–189. PMID: 14974593.
- Full Text Links
-
- Actions
-
Cited
- CITED
-
- Close
- Share
-
- Similar articles
-
- Interobserver delineation variability of computed tomography-based radiomic features of the parotid gland
- A Case of Meningioma Compatible with Metastatic Glioblastoma Multiforme
- Inter-observer and intra-observer reliability between manual segmentation and semi-automated segmentation for carotid vessel wall volume measurements on three-dimensional ultrasonography
- A Case of Multicentric Glioblastoma Multiforme
- A Case of Glioblastoma Multiforme of the Cerebellum
