Development and Validation of Generalized Linear Regression Models to Predict Vessel Enhancement on Coronary CT Angiography
- Affiliations
-
- 1Department of Radiological Technology, Tsuchiya General Hospital, Hiroshima 730-8655, Japan. takanorimasuda@yahoo.co.jp
- 2Department of Diagnostic Radiology, Tsuchiya General Hospital, Hiroshima 730-8655, Japan.
- 3Department of Diagnostic Radiology, Graduate School of Medical Sciences, Kumamoto University, Kumamoto 860-8556, Japan.
- 4Department of Medical Physics, Faculty of Life Sciences, Kumamoto University, Kumamoto 860-0811, Japan.
- 5Department of Diagnostic Radiology, Graduate School of Biomedical Sciences, Hiroshima University, Hiroshima 734-8553, Japan.
- KMID: 2424842
- DOI: http://doi.org/10.3348/kjr.2018.19.6.1021
Abstract
OBJECTIVE
We evaluated the effect of various patient characteristics and time-density curve (TDC)-factors on the test bolus-affected vessel enhancement on coronary computed tomography angiography (CCTA). We also assessed the value of generalized linear regression models (GLMs) for predicting enhancement on CCTA.
MATERIALS AND METHODS
We performed univariate and multivariate regression analysis to evaluate the effect of patient characteristics and to compare contrast enhancement per gram of iodine on test bolus (ΔHUTEST) and CCTA (ΔHUCCTA). We developed GLMs to predict ΔHUCCTA. GLMs including independent variables were validated with 6-fold cross-validation using the correlation coefficient and Bland-Altman analysis.
RESULTS
In multivariate analysis, only total body weight (TBW) and ΔHUTEST maintained their independent predictive value (p < 0.001). In validation analysis, the highest correlation coefficient between ΔHUCCTA and the prediction values was seen in the GLM (r = 0.75), followed by TDC (r = 0.69) and TBW (r = 0.62). The lowest Bland-Altman limit of agreement was observed with GLM-3 (mean difference, −0.0 ± 5.1 Hounsfield units/grams of iodine [HU/gI]; 95% confidence interval [CI], −10.1, 10.1), followed by ΔHUCCTA (−0.0 ± 5.9 HU/gI; 95% CI, −11.9, 11.9) and TBW (1.1 ± 6.2 HU/gI; 95% CI, −11.2, 13.4).
CONCLUSION
We demonstrated that the patient's TBW and ΔHUTEST significantly affected contrast enhancement on CCTA images and that the combined use of clinical information and test bolus results is useful for predicting aortic enhancement.
MeSH Terms
Figure
-
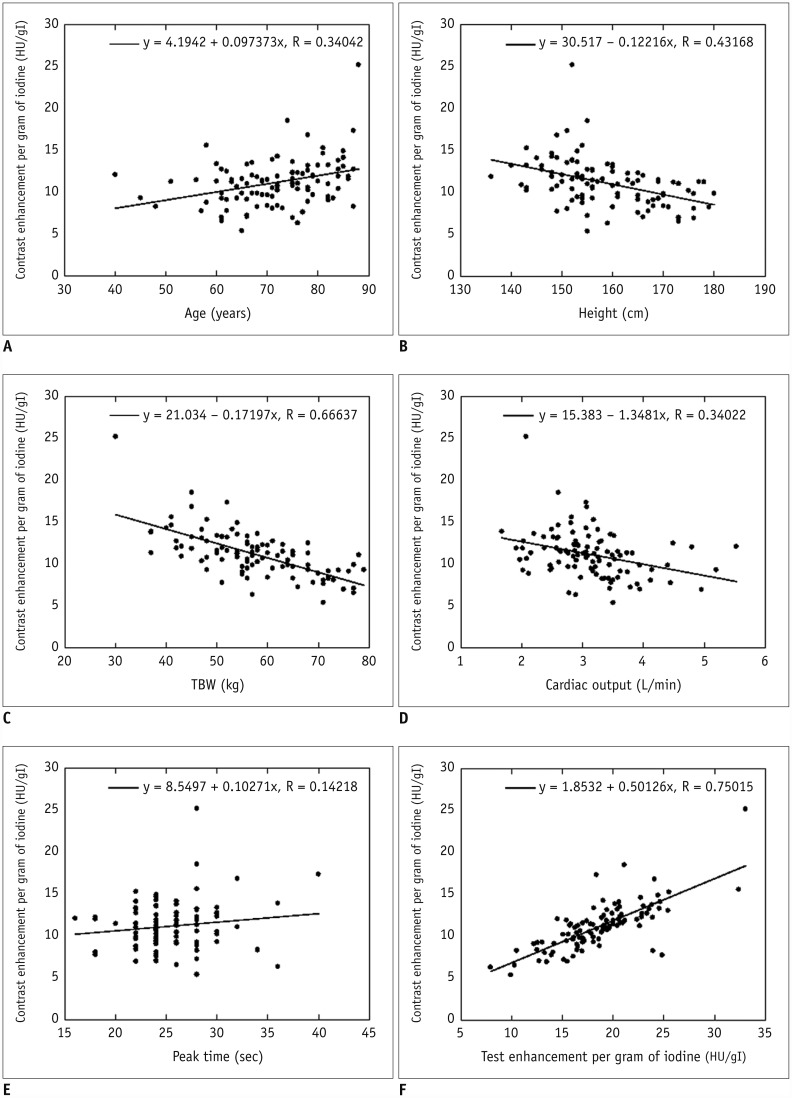
Fig. 1 Scattergrams of relationship between aortic enhancement and scan protocols using TBW for selecting iodinated contrast material dose and patient age (A), height (B), TBW (C), cardiac output (D), peak time (E), and ΔHUTEST (F).There was significant positive correlation between ΔHUCCTA and age (r = 0.34). Inverse correlation was seen between ΔHUCCTA and TBW (r = 0.67), height (r = 0.43), CO (r = 0.34), and ΔHUTEST (r = 0.75) by linear regression analysis (p < 0.01 for all). There was no significant correlation between peak time of test bolus and ΔHUCCTA (r = 0.14, p = 0.142). gI = grams of iodine, HU = Hounsfield units, TBW = total body weight, ΔHUCCTA = per gram of iodine on coronary computed tomography angiography, ΔHUTEST = per gram of iodine on test bolus
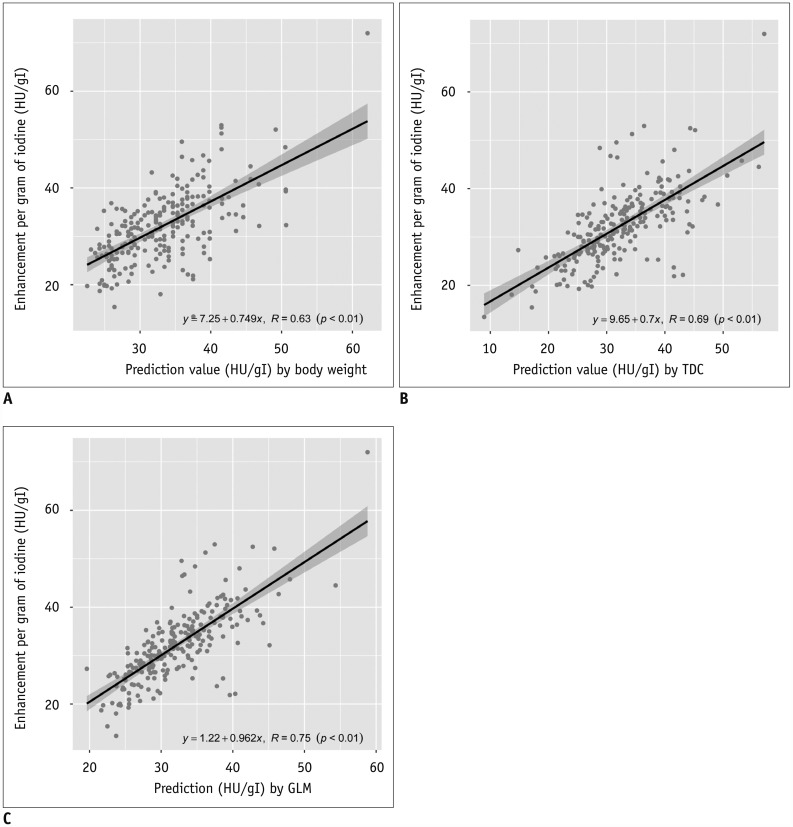
Fig. 2 Scattergrams of relationship between ΔHUCCTA and GLMs using TBW (A), TDC (B), and GLMs (C).By validation analysis, GLMs manifested highest correlation coefficient with prediction values (r = 0.75), followed by TDC (r = 0.69) and TBW (r = 0.62). GLMs = generalized linear regression models, TDC = time-density curve
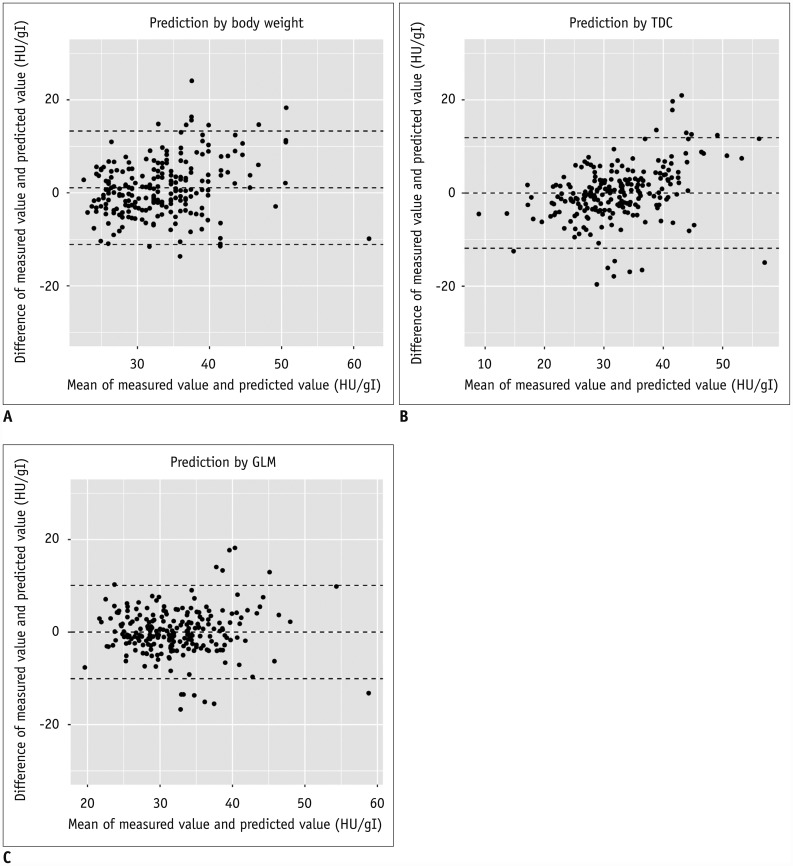
Fig. 3 Bland–Altman limit of relationship between difference in measured value and predicted value, and mean of measured value and predicted value obtained for GLMs using TBW (A), TDC (B), and GLMs (C).Lowest Bland–Altman limit of agreement observed with GLMs (mean difference −0.0 ± 5.0 HU/gI, 95% CI: −10.1, 10.1 HU/gI), ΔHUCCTA (−0.0 ± 5.9 HU/gI, 95% CI: −11.9, 11.9 HU/gI), and TBW (1.1 ± 6.1 HU/gI, 95% CI: −11.1, 13.3 HU/gI). CI = confidence interval
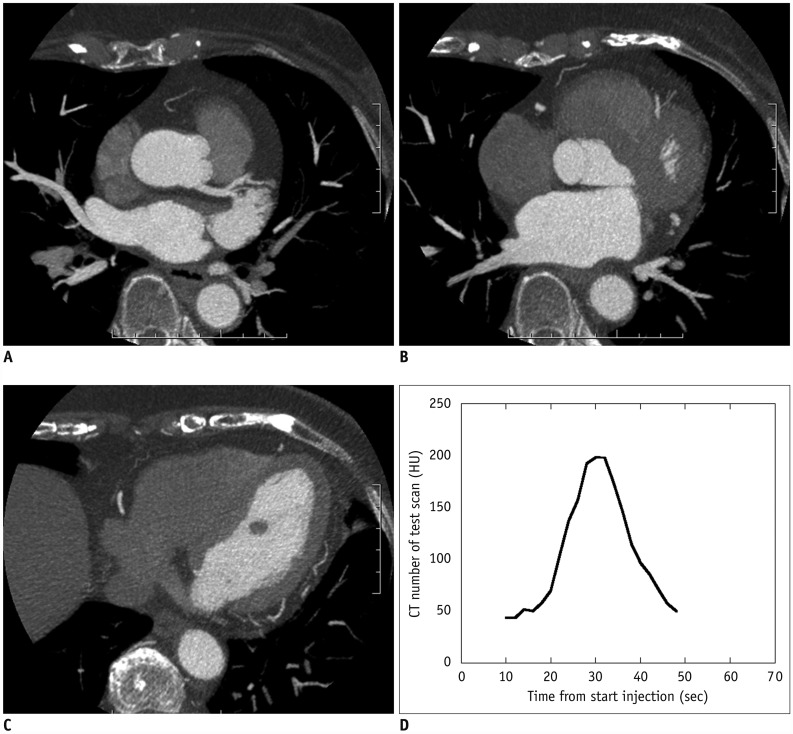
Fig. 4 67-year-old woman with chest pain.Axial images (A–C) and TDC (D) are shown. ΔHUTEST was 60.2 HU/mgI and TBW was 67 kg. Predicted ΔHUCCTA was calculated with GLM-1 (ΔHUTEST) as 43.7 HU/gI, with GLM-2 (TBW) as 27.9 HU/gI, and with GLM-3 as 35.6 HU/gI. Actual ΔHUCCTA was 35.3 HU/gI.
Reference
-
1. Gilard M, Cornily JC, Pennec PY, Joret C, Le Gal G, Mansourati J, et al. Accuracy of multislice computed tomography in the preoperative assessment of coronary disease in patients with aortic valve stenosis. J Am Coll Cardiol. 2006; 47:2020–2024. PMID: 16697319.2. Cademartiri F, Mollet NR, Lemos PA, Saia F, Midiri M, de Feyter PJ, et al. Higher intracoronary attenuation improves diagnostic accuracy in MDCT coronary angiography. AJR Am J Roentgenol. 2006; 187:W430–W433. PMID: 16985117.3. Becker CR, Hong C, Knez A, Leber A, Bruening R, Schoepf UJ, et al. Optimal contrast application for cardiac 4-detector-row computed tomography. Invest Radiol. 2003; 38:690–694. PMID: 14566178.4. Fei X, Du X, Yang Q, Shen Y, Li P, Liao J, et al. 64-MDCT coronary angiography: phantom study of effects of vascular attenuation on detection of coronary stenosis. AJR Am J Roentgenol. 2008; 191:43–49. PMID: 18562723.5. Bae KT, Heiken JP, Brink JA. Aortic and hepatic contrast medium enhancement at CT. Part I. Prediction with a computer model. Radiology. 1998; 207:647–655. PMID: 9609886.6. Bae KT, Heiken JP, Brink JA. Aortic and hepatic peak enhancement at CT: effect of contrast medium injection rate--pharmacokinetic analysis and experimental porcine model. Radiology. 1998; 206:455–464. PMID: 9457200.7. Fleischmann D, Hittmair K. Mathematical analysis of arterial enhancement and optimization of bolus geometry for CT angiography using the discrete fourier transform. J Comput Assist Tomogr. 1999; 23:474–484. PMID: 10348458.8. Fleischmann D, Rubin GD, Bankier AA, Hittmair K. Improved uniformity of aortic enhancement with customized contrast medium injection protocols at CT angiography. Radiology. 2000; 214:363–371. PMID: 10671582.9. Awai K, Hiraishi K, Hori S. Effect of contrast material injection duration and rate on aortic peak time and peak enhancement at dynamic CT involving injection protocol with dose tailored to patient weight. Radiology. 2004; 230:142–150. PMID: 14695390.10. Bae KT, Seeck BA, Hildebolt CF, Tao C, Zhu F, Kanematsu M, et al. Contrast enhancement in cardiovascular MDCT: effect of body weight, height, body surface area, body mass index, and obesity. AJR Am J Roentgenol. 2008; 190:777–784. PMID: 18287452.11. Kondo H, Kanematsu M, Goshima S, Tomita Y, Kim MJ, Moriyama N, et al. Body size indexes for optimizing iodine dose for aortic and hepatic enhancement at multidetector CT: comparison of total body weight, lean body weight, and blood volume. Radiology. 2010; 254:163–169. PMID: 20019137.12. Nakaura T, Awai K, Yanaga Y, Namimoto T, Utsunomiya D, Hirai T, et al. Low-dose contrast protocol using the test bolus technique for 64-detector computed tomography coronary angiography. Jpn J Radiol. 2011; 29:457–465. PMID: 21882087.13. Imai E, Horio M, Nitta K, Yamagata K, Iseki K, Tsukamoto Y, et al. Modification of the Modification of Diet in Renal Disease (MDRD) study equation for Japan. Am J Kidney Dis. 2007; 50:927–937. PMID: 18037093.14. Matsuo S, Imai E, Horio M, Yasuda Y, Tomita K, Nitta K, et al. Collaborators developing the Japanese equation for estimated GFR. Revised equations for estimated GFR from serum creatinine in Japan. Am J Kidney Dis. 2009; 53:982–999. PMID: 19339088.15. Hendel RC, Patel MR, Kramer CM, Poon M, Hendel RC, Carr JC, et al. ACCF/ACR/SCCT/SCMR/ASNC/NASCI/SCAI/SIR 2006 appropriateness criteria for cardiac computed tomography and cardiac magnetic resonance imaging: a report of the American College of Cardiology Foundation Quality Strategic Directions Committee Appropriateness Criteria Working Group, American College of Radiology, Society of Cardiovascular Computed Tomography, Society for Cardiovascular Magnetic Resonance, American Society of Nuclear Cardiology, North American Society for Cardiac Imaging, Society for Cardiovascular Angiography and Interventions, and Society of Interventional Radiology. J Am Coll Cardiol. 2006; 48:1475–1497. PMID: 17010819.16. Kidoh M, Nakaura T, Awai K, Utsunomiya D, Sakaino N, Harada K, et al. Compact-bolus dynamic CT protocol with a test bolus technique in 64-MDCT coronary angiography: comparison of fixed injection rate and duration protocol. Jpn J Radiol. 2013; 31:115–122. PMID: 23196822.17. Awai K, Kanematsu M, Kim T, Ichikawa T, Nakamura Y, Nakamoto A, et al. The optimal body size index with which to determine iodine dose for hepatic dynamic CT: a prospective multicenter study. Radiology. 2016; 278:773–781. PMID: 26356063.18. Fleischmann D. How to design injection protocols for multiple detector-row CT angiography (MDCTA). Eur Radiol. 2005; 15(Suppl 5):E60–E65. PMID: 18637231.19. Masuda T, Funama Y, Imada N, Sato T, Yamagami T, Tatsugami F, et al. Prediction of aortic enhancement on coronary CTA images using a test bolus of diluted contrast material. Acad Radiol. 2014; 21:1542–1546. PMID: 25442352.20. Bae KT. Intravenous contrast medium administration and scan timing at CT: considerations and approaches. Radiology. 2010; 256:32–61. PMID: 20574084.21. Svensson A, Ripsweden J, Rück A, Aspelin P, Cederlund K, Brismar BT. Heart rate variability and heat sensation during CT coronary angiography: low-osmolar versus iso-osmolar contrast media. Acta Radiol. 2010; 51:722–726. PMID: 20568977.
- Full Text Links
-
- Actions
-
Cited
- CITED
-
- Close
- Share
-
- Similar articles
-
- Optimizing Contrast Medium Injection for Coronary CT Angiography Using Myocardial CT Perfusion Data
- Variation of the Degree of Coronary Artery Stenosis during the Cardiac Cycle: Influence of Heart Rate or Calcium Score on Coronary CT Angiography
- Coronary Artery Anomaly, What Radiologist Should Know?
- Coronary CT Angiography
- An Unusual Pattern of All Three Coronary Arteries Originating from a Single Coronary Artery Arising from the Right Sinus of Valsalva
