Interactive Visualization of Healthcare Data Using Tableau
- Affiliations
-
- 1Division of Biomedical Informatics, Seoul National University College of Medicine, Seoul, Korea.
- 2School of Management, Kyung Hee University, Seoul, Korea. hjchang@khu.ac.kr
- KMID: 2396429
- DOI: http://doi.org/10.4258/hir.2017.23.4.349
Abstract
OBJECTIVES
Big data analysis is receiving increasing attention in many industries, including healthcare. Visualization plays an important role not only in intuitively showing the results of data analysis but also in the whole process of collecting, cleaning, analyzing, and sharing data. This paper presents a procedure for the interactive visualization and analysis of healthcare data using Tableau as a business intelligence tool.
METHODS
Starting with installation of the Tableau Desktop Personal version 10.3, this paper describes the process of understanding and visualizing healthcare data using an example. The example data of colon cancer patients were obtained from health insurance claims in years 2012 and 2013, provided by the Health Insurance Review and Assessment Service.
RESULTS
To explore the visualization of healthcare data using Tableau for beginners, this paper describes the creation of a simple view for the average length of stay of colon cancer patients. Since Tableau provides various visualizations and customizations, the level of analysis can be increased with small multiples, view filtering, mark cards, and Tableau charts.
CONCLUSIONS
Tableau is a software that can help users explore and understand their data by creating interactive visualizations. The software has the advantages that it can be used in conjunction with almost any database, and it is easy to use by dragging and dropping to create an interactive visualization expressing the desired format.
Keyword
MeSH Terms
Figure
-

Figure 1 Downloading a trial of Tableau Desktop (https://www.tableau.com/products/desktop/download).

Figure 2 Interface of workspace in Tableau Desktop.

Figure 3 Getting started with a basic view.
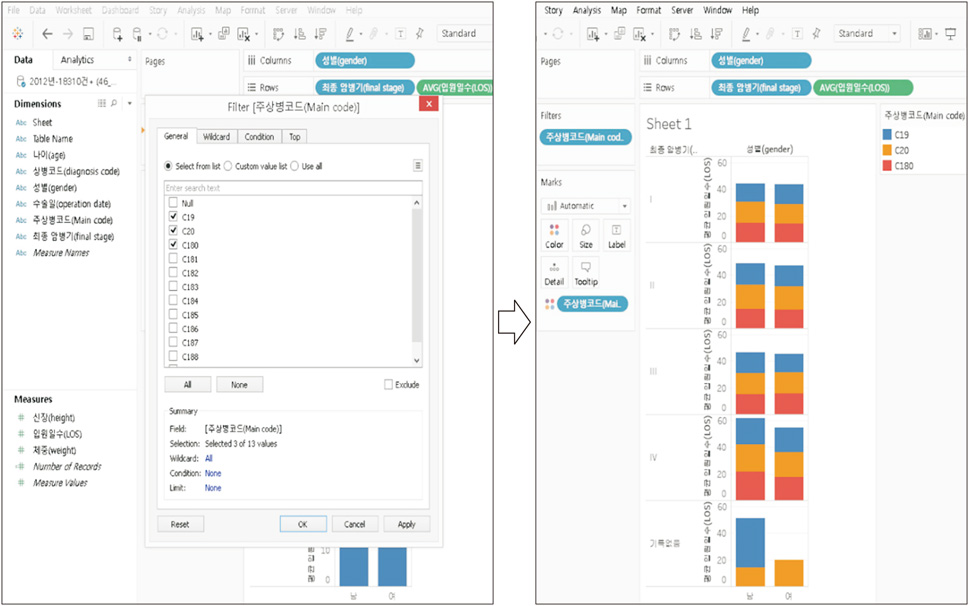
Figure 4 Example of filtering views and using mark cards.
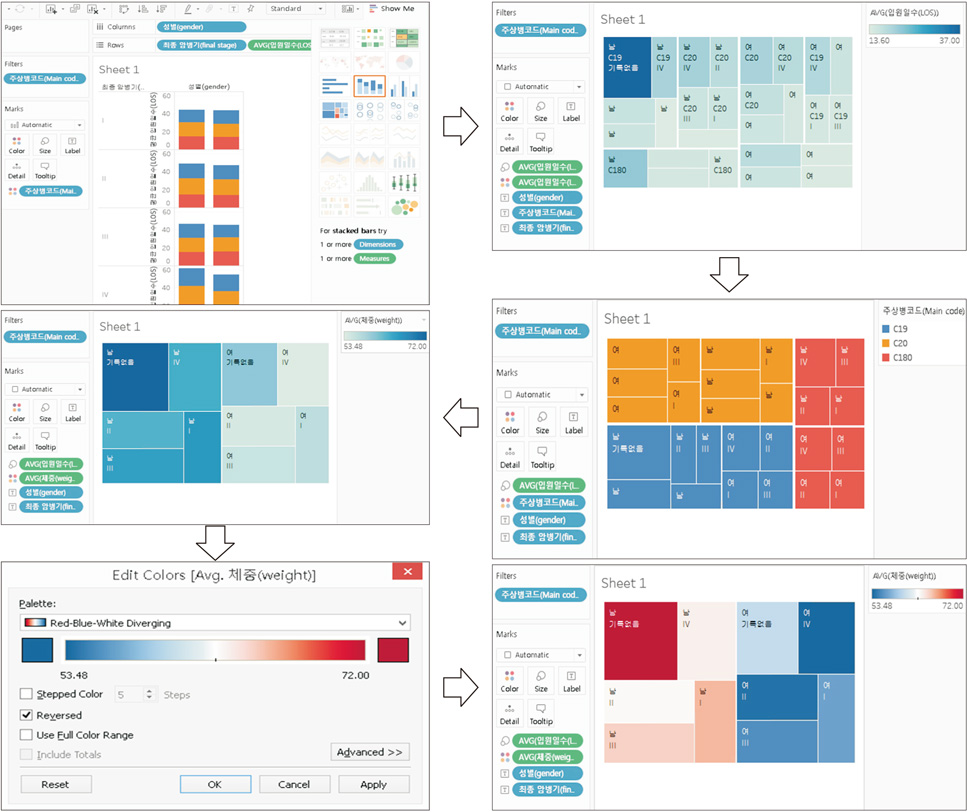
Figure 5 Example of a Tableau chart, Treemap.
Cited by 1 articles
-
Establishment of the Seoul National University Prospectively Enrolled Registry for Genitourinary Cancer (SUPER-GUC): A prospective, multidisciplinary, bio-bank linked cohort and research platform
Chang Wook Jeong, Jungyo Suh, Hyeong Dong Yuk, Bum Sik Tae, Miso Kim, Bhumsuk Keam, Jin Ho Kim, Sang Youn Kim, Jeong Yeon Cho, Seung Hyup Kim, Kyung Chul Moon, Gi Jeong Cheon, Ja Hyeon Ku, Hyeon Hoe Kim, Cheol Kwak
Investig Clin Urol. 2019;60(4):235-243. doi: 10.4111/icu.2019.60.4.235.
Reference
-
1. Wang L, Wang G, Alexander CA. Big data and visualization: methods, challenges and technology progress. Digit Technol. 2015; 1(1):33–38.2. Janvrin DJ, Raschke RL, Dilla WN. Making sense of complex data using interactive data visualization. J Account Educ. 2014; 32(4):31–48.
Article3. Martinez R, Ordunez P, Soliz PN, Ballesteros MF. Data visualisation in surveillance for injury prevention and control: conceptual bases and case studies. Inj Prev. 2016; 22:Suppl 1. i27–i33.
Article4. Tableau. Meet the Tableau Desktop family [Internet]. Seattle (WA): Tableau;c2017. cited at 2017 Sep 2. Available from: https://public.tableau.com/en-us/s/download.5. Tableau. Downloading a trial of Tableau Desktop [Internet]. Seattle (WA): Tableau;c2017. cited at 2017 Sep 2. Available from: https://www.tableau.com/products/desktop/download.6. Tableau. Academic programs [Internet]. Seattle (WA): Tableau;c2017. cited at 2017 Sep 2. Avaiable from: https://www.tableau.com/academic.7. Healthcare Bigdata Hub. Public data of colorectal cancer patients in 2012 and 2013 [Internet]. Wonju, Korea: Health Insurance Review and Assessment Service;c2017. cited at 2017 Sep 2. Available from: http://opendata.hira.or.kr/op/opc/selectOpenData.do?sno=1&publDataTpCd=&searchCnd=&searchWrd=&pageIndex=4.8. Mackinlay J, Hanrahan P, Stolte C. Show me: automatic presentation for visual analysis. IEEE Trans Vis Comput Graph. 2007; 13(6):1137–1144.
Article
- Full Text Links
-
- Actions
-
Cited
- CITED
-
- Close
- Share
-
- Similar articles
-
- Developing a Data Visualization Program for Transfusion Appropriateness Management
- Interactive Visualization for Patient-to-Patient Comparison
- QCanvas: An Advanced Tool for Data Clustering and Visualization of Genomics Data
- Mastering data visualization with Python: practical tips for researchers
- Exploring Interaction between Interactive Services and Presenteeism of Korean Service Workers: The Moderating Effects of Supervisor Support
