Evaluating Correlation between Geometrical Relationship and Dose Difference Caused by Respiratory Motion Using Statistical Analysis
- Affiliations
-
- 1Department of Biomedical Engineering, Research Institute of Biomedical Engineering, College of Medicine, The Catholic University of Korea, Seoul, Korea. suhsanta@catholic.ac.kr
- 2Department of Radiation Oncology, Asan Medical Center, Seoul, Korea.
- KMID: 2376553
- DOI: http://doi.org/10.14316/pmp.2016.27.4.203
Abstract
- Dose differences between three-dimensional (3D) and four-dimensional (4D) doses could be varied according to the geometrical relationship between a planning target volume (PTV) and an organ at risk (OAR). The purpose of this study is to evaluate the correlation between the overlap volume histogram (OVH), which quantitatively shows the geometrical relationship between the PTV and OAR, and the dose differences. 4D computed tomography (4DCT) images were acquired for 10 liver cancer patients. Internal target volume-based treatment planning was performed. A 3D dose was calculated on a reference phase (end-exhalation). A 4D dose was accumulated using deformation vector fields between the reference and other phase images of 4DCT from deformable image registration, and dose differences between the 3D and 4D doses were calculated. An OVH between the PTV and selected OAR (duodenum) was calculated and quantified on the basis of specific overlap volumes that corresponded to 10%, 20%, 30%, 40%, and 50% of the OAR volume overlapped with the expanded PTV. Statistical analysis was performed to verify the correlation with the OVH and dose difference for the OAR. The minimum mean dose difference was 0.50 Gy from case 3, and the maximum mean dose difference was 4.96 Gy from case 2. The calculated range of the correlation coefficients between the OVH and dose difference was from −0.720 to −0.712, and the R-square range for regression analysis was from 0.506 to 0.518 (p-value <0.05). However, when the 10% overlap volume was applied in the six cases that had OVH value ≤2, the average percent mean dose differences were 34.80±12.42%. Cases with quantified OVH values of 2 or more had mean dose differences of 29.16±11.36%. In conclusion, no significant statistical correlation was found between the OVH and dose differences. However, it was confirmed that a higher difference between the 3D and 4D doses could occur in cases that have smaller OVH value.
Figure
-
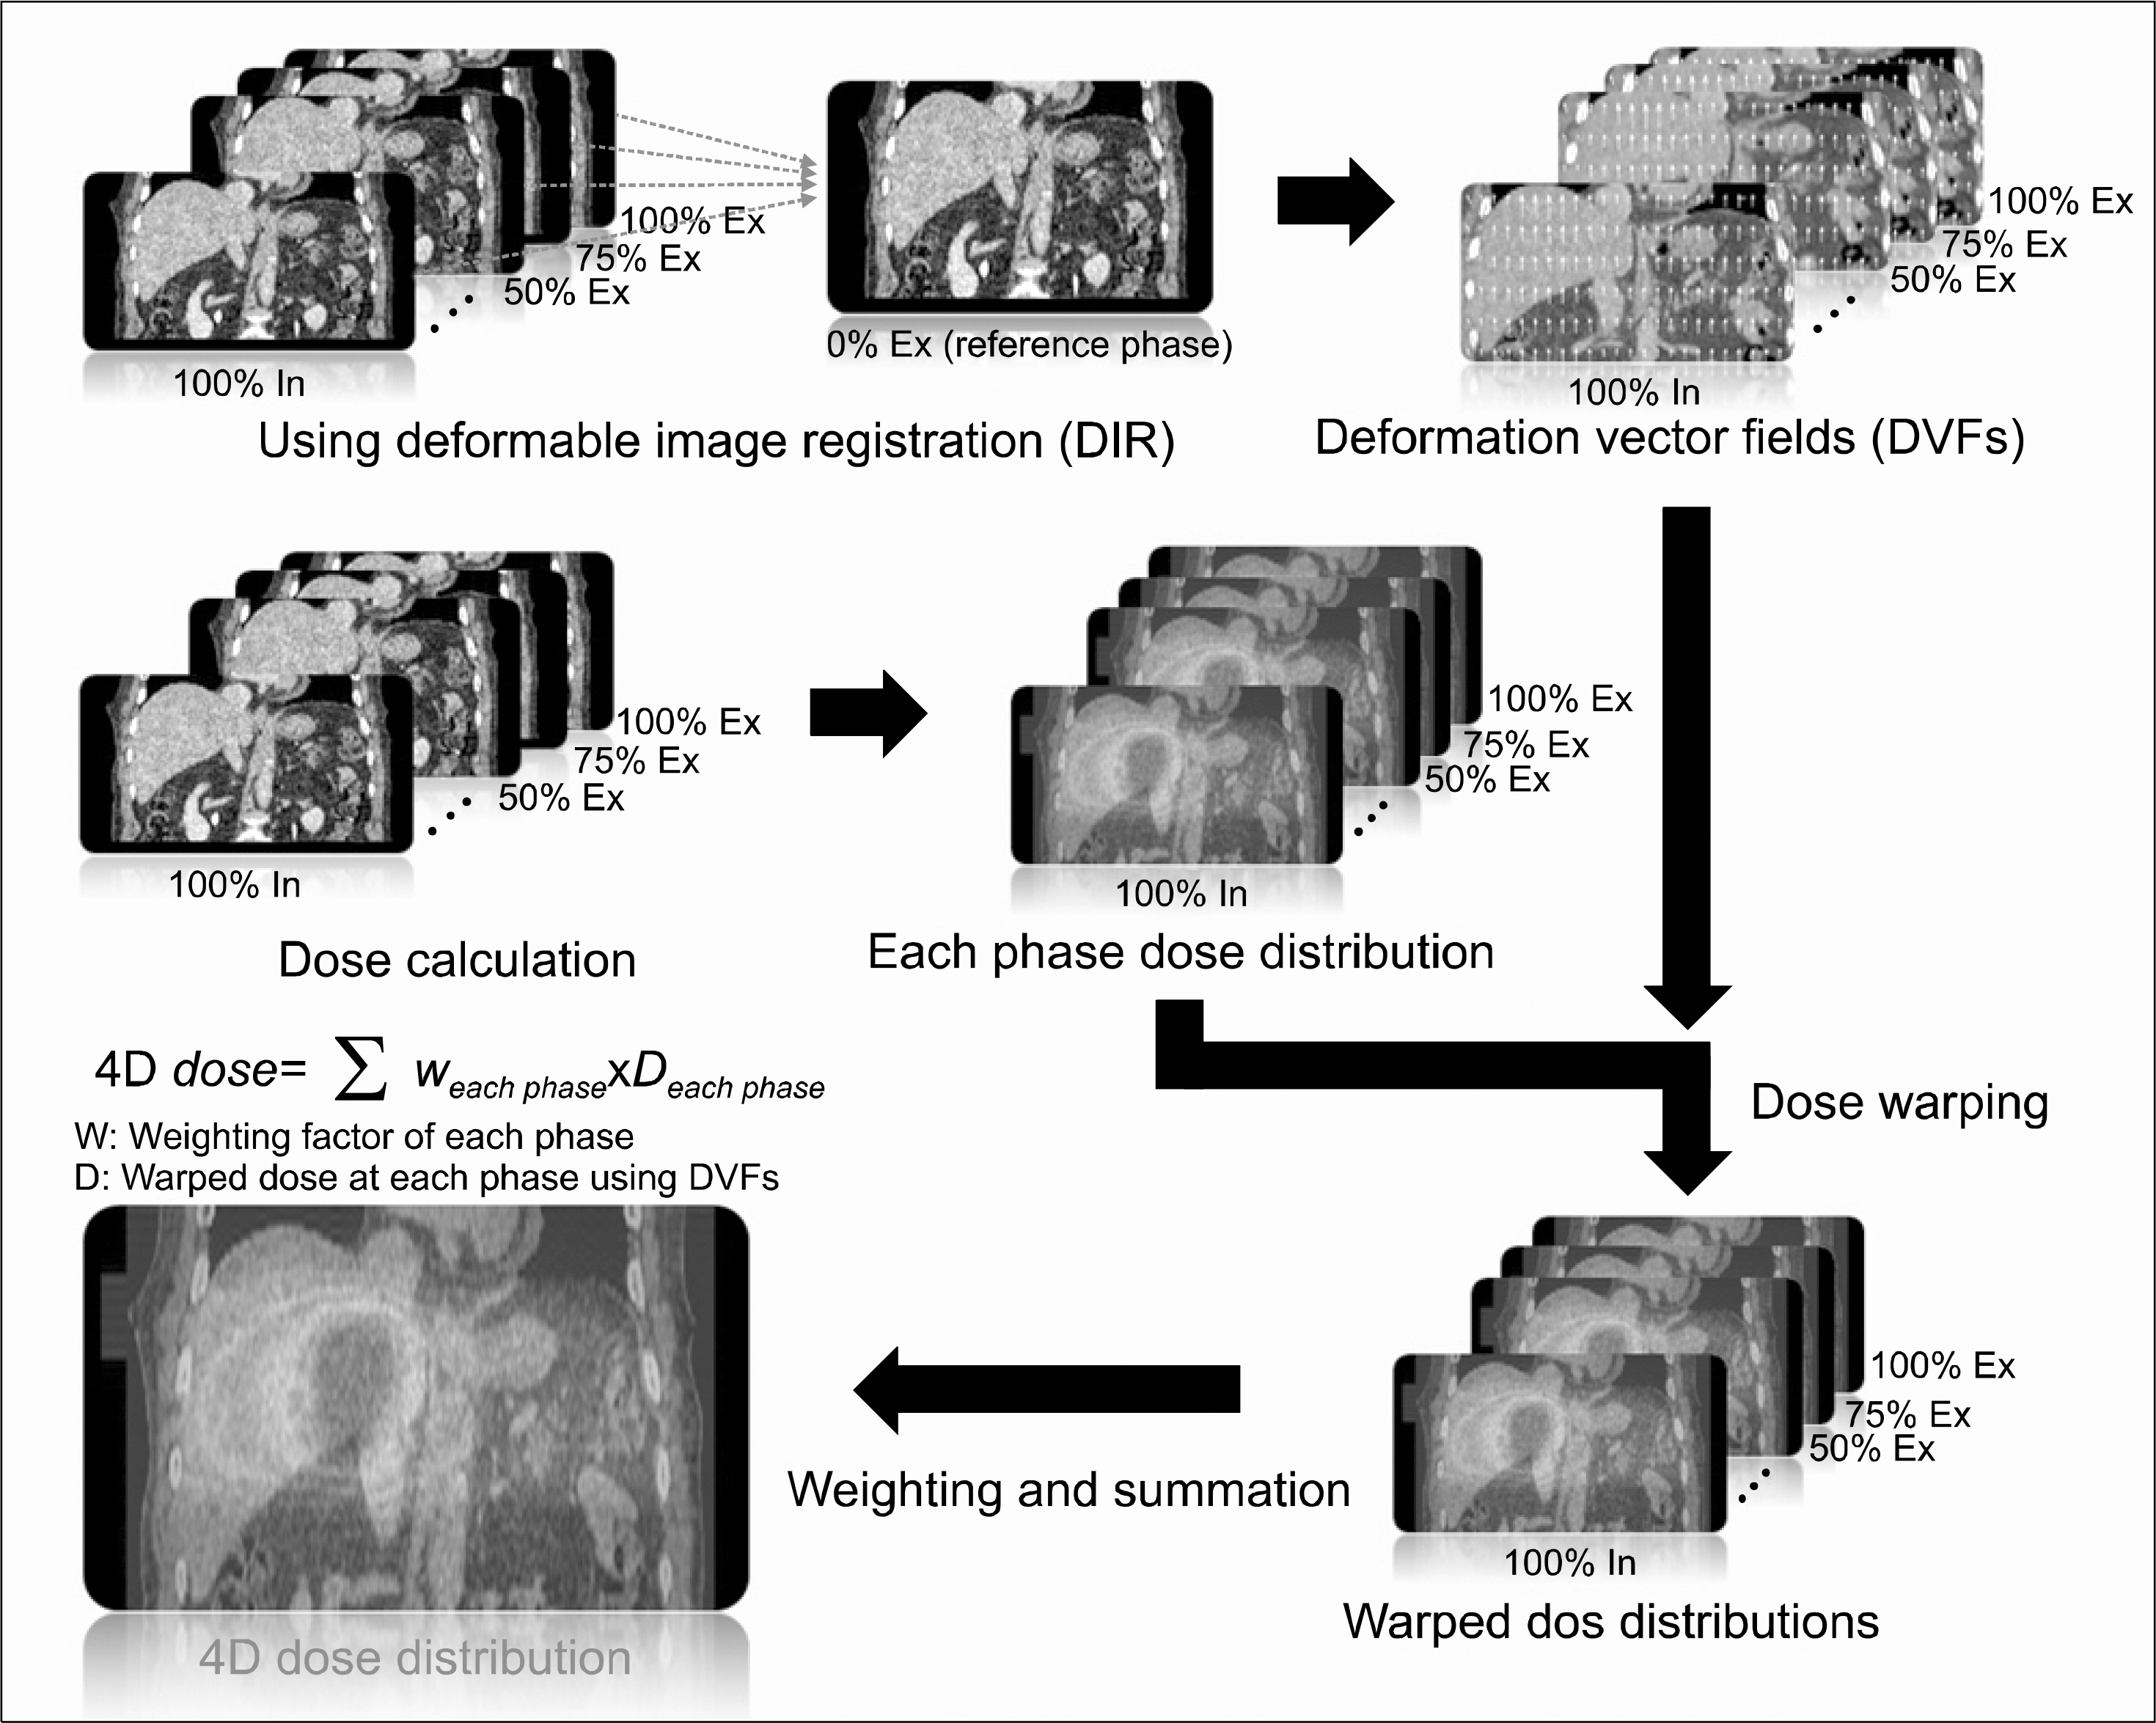
Fig. 1. Ssimple calculation process for four-dimensional doses (4D doses). First, deformable image registration was used to calculate the deformation vector fields (DVFs) for each phase image based on the end-exhalation phase image from four-dimensional computed tomography (4DCT). Second, the calculated DVFs were applied to each dose distribution that was calculated from each phase image to obtain the warped dose distributions. Finally, the warped dose distributions were weighted and summed up to calculate the 4D doses.
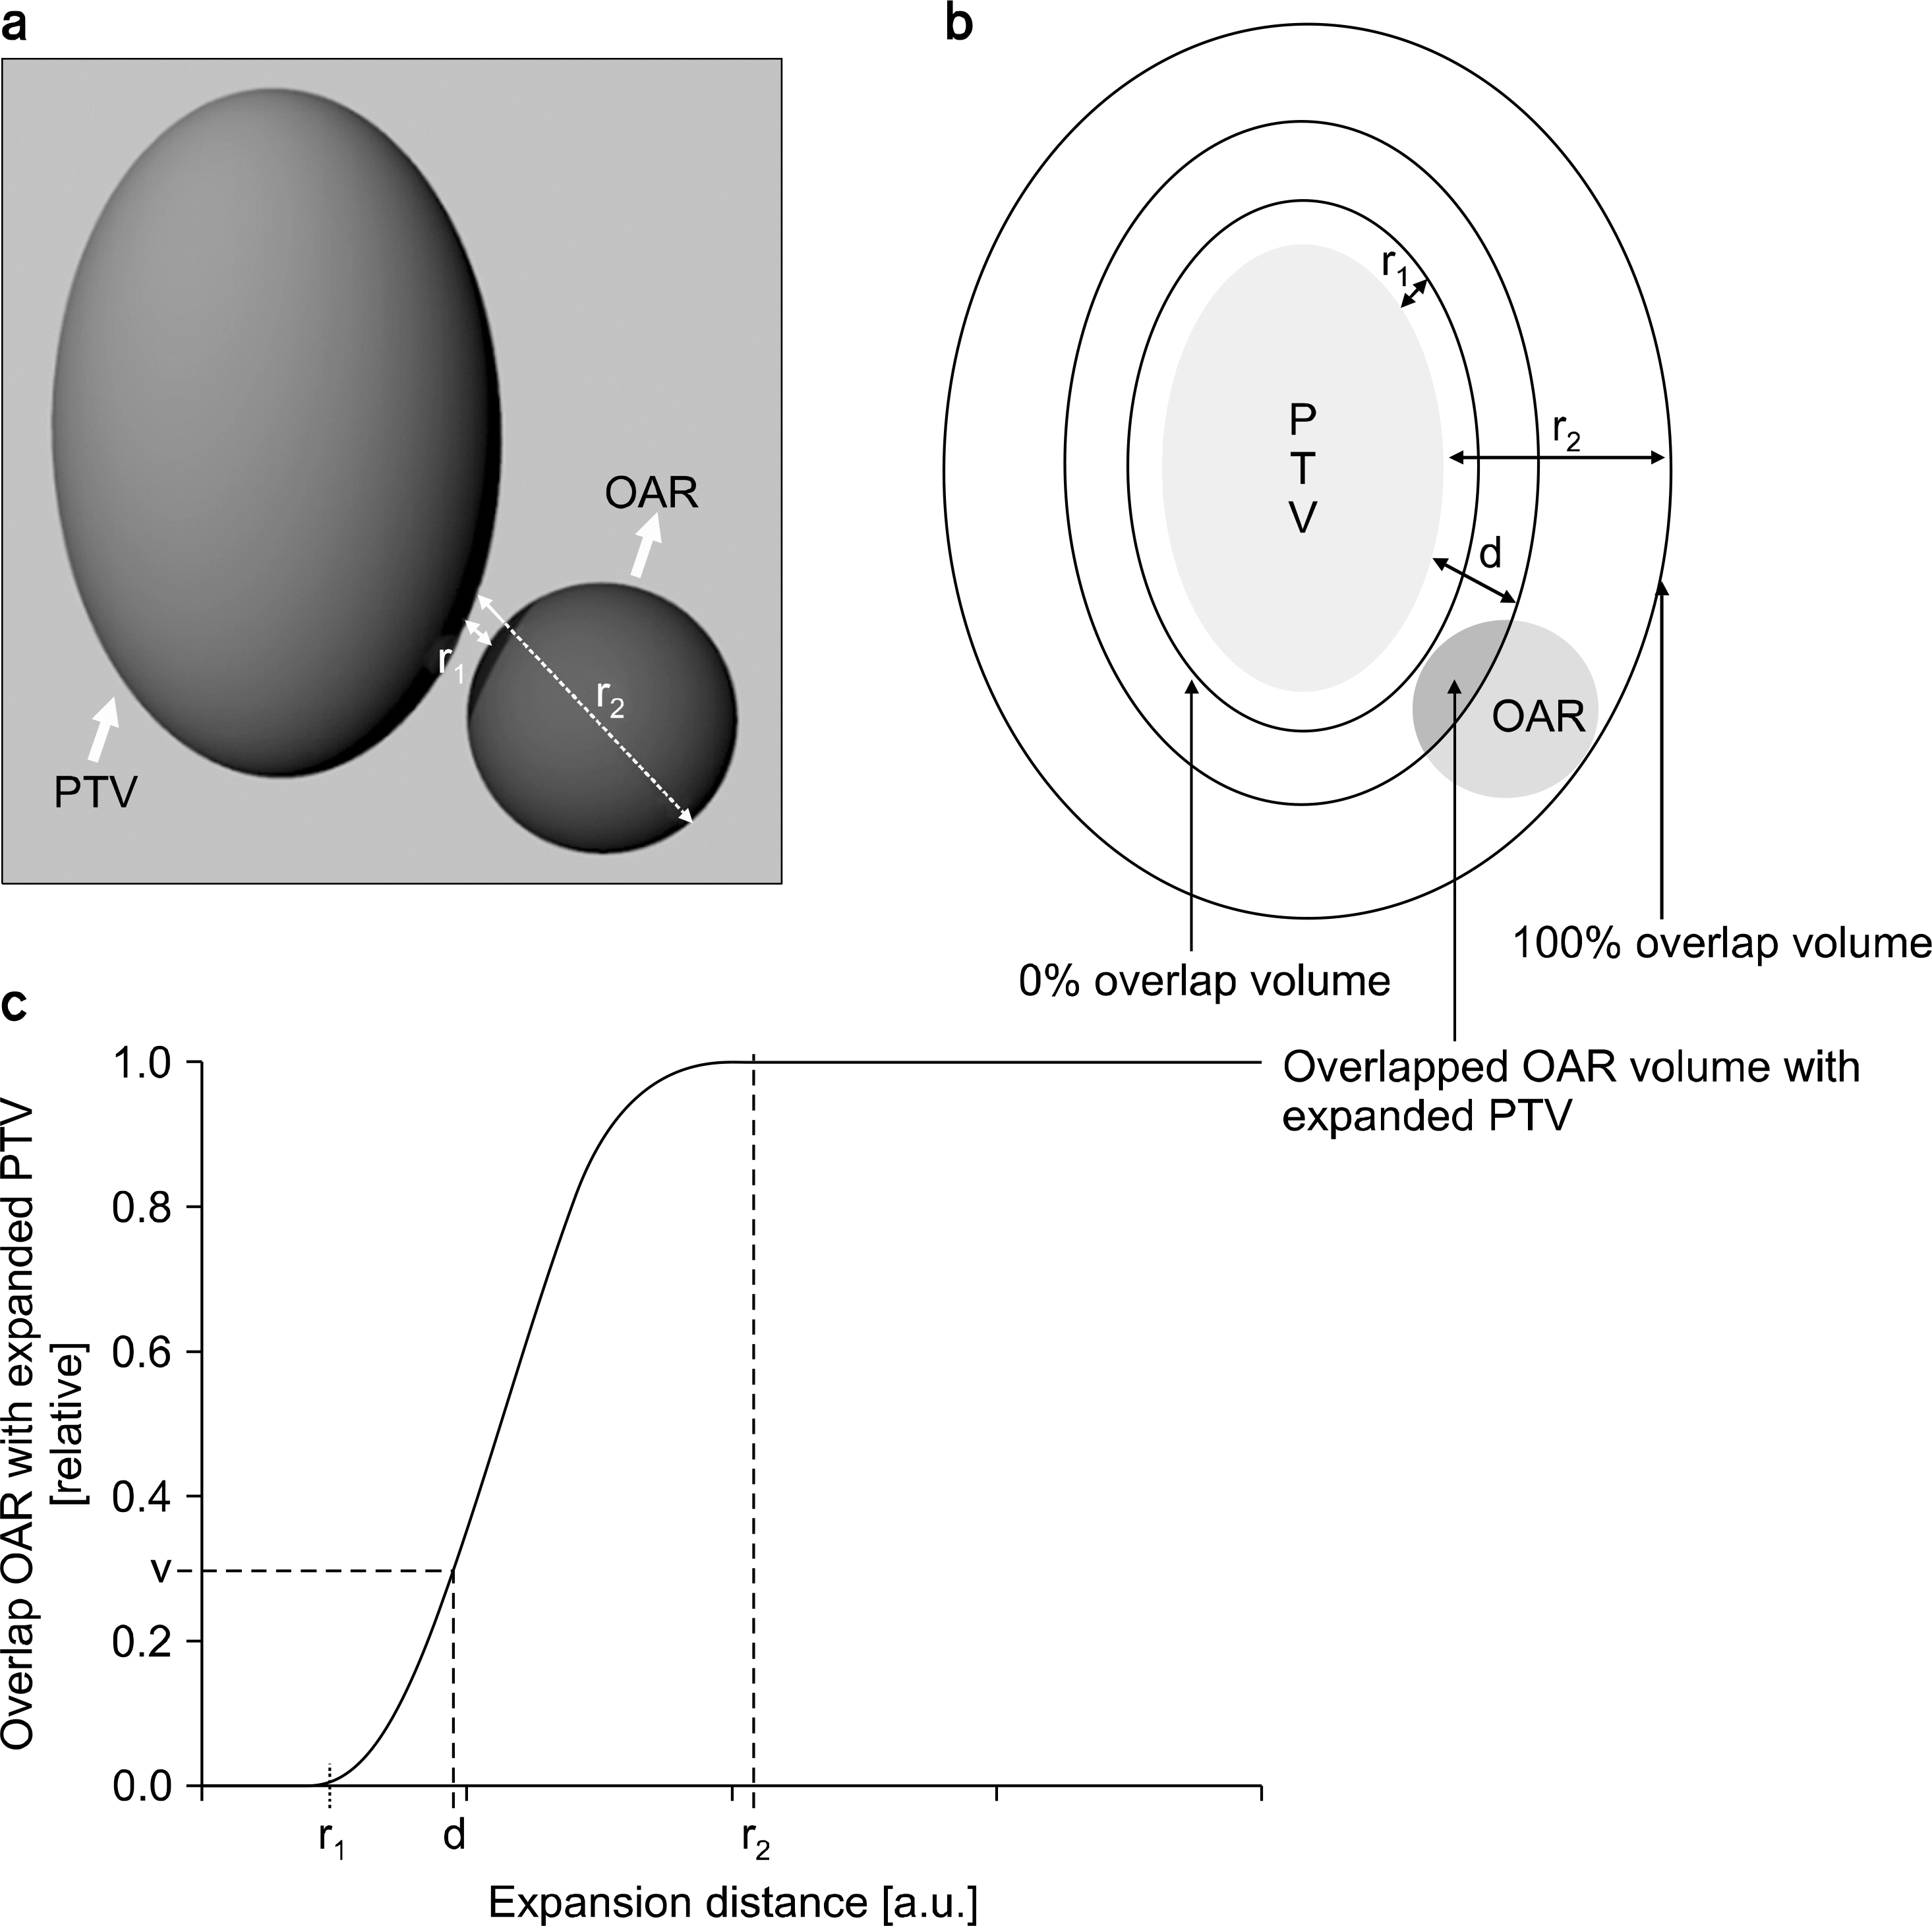
Fig. 2. Example of an overlap volume histogram (OVH). (a) three-dimensional view showing the geometrical relationship between the planning target volume (PTV) and the organ at risk (OAR), (b) two-dimensional view on the given PTV and OAR: r1 is the maximum expansion distance where the expanded PTV and OAR did not overlap when PTV was expanded by an arbitrary margin. r2 is the minimum expansion distance where the OAR was perfectly overlapped by the PTV expanded by an arbitrary margin. d is the margin size when the ratio of the overlapped volume (red area) between the expanded PTV and OAR to the volume of OAR was v, (c) OVH of given PTV and OAR.
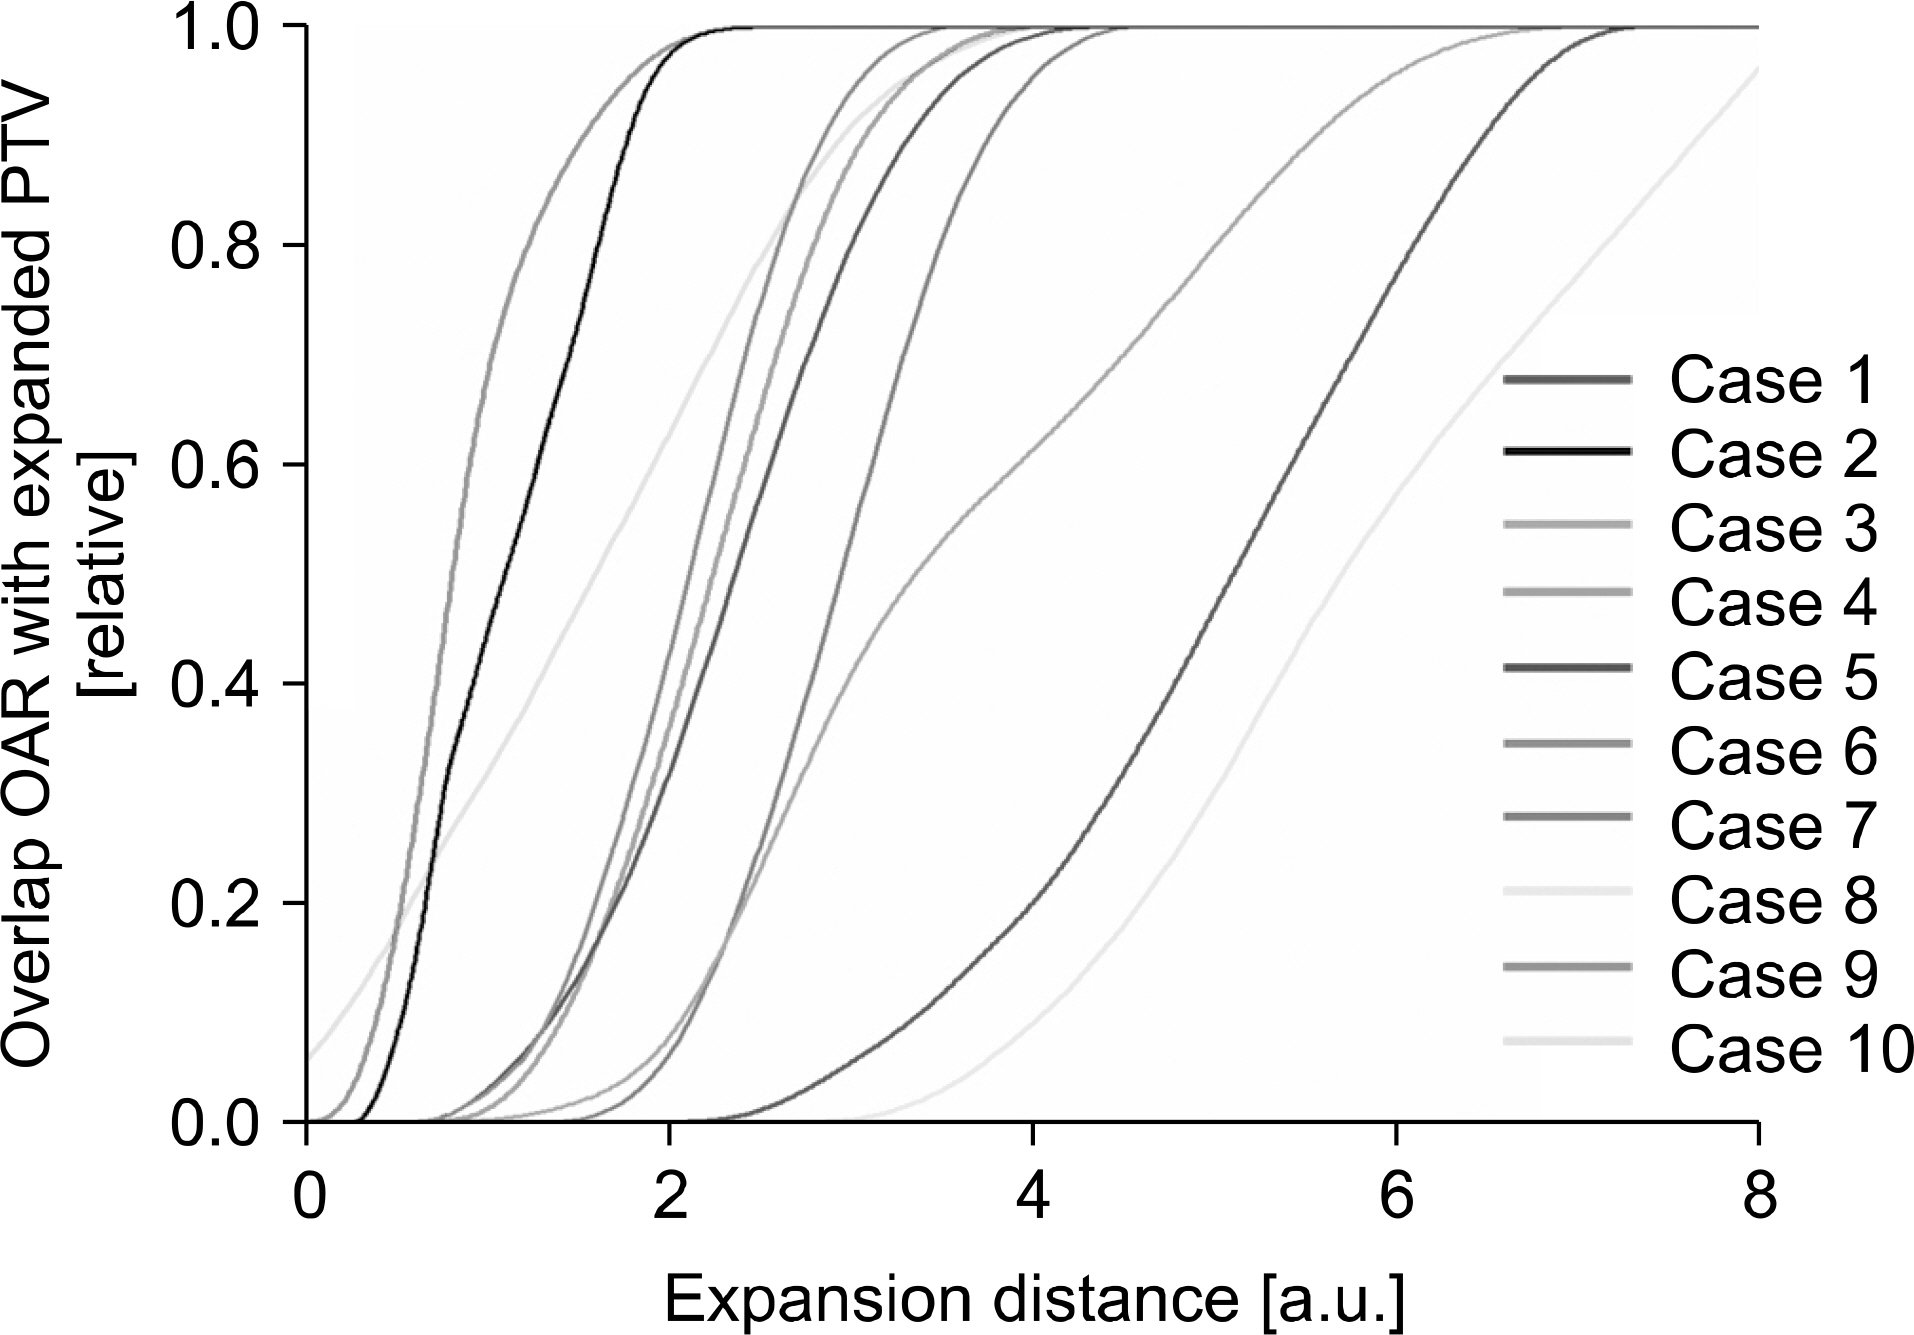
Fig. 3. Overlap volume histogram (OVH) for each case. The expansion distance of the horizontal axis represents the size of the margin used when the planning target volume (PTV) was expanded by an arbitrary margin. The vertical axis represents the ratio of the overlapped volume between the organ at risk (OAR) and expanded PTV, which was expanded by an arbitrary margin, to the volume of OAR.
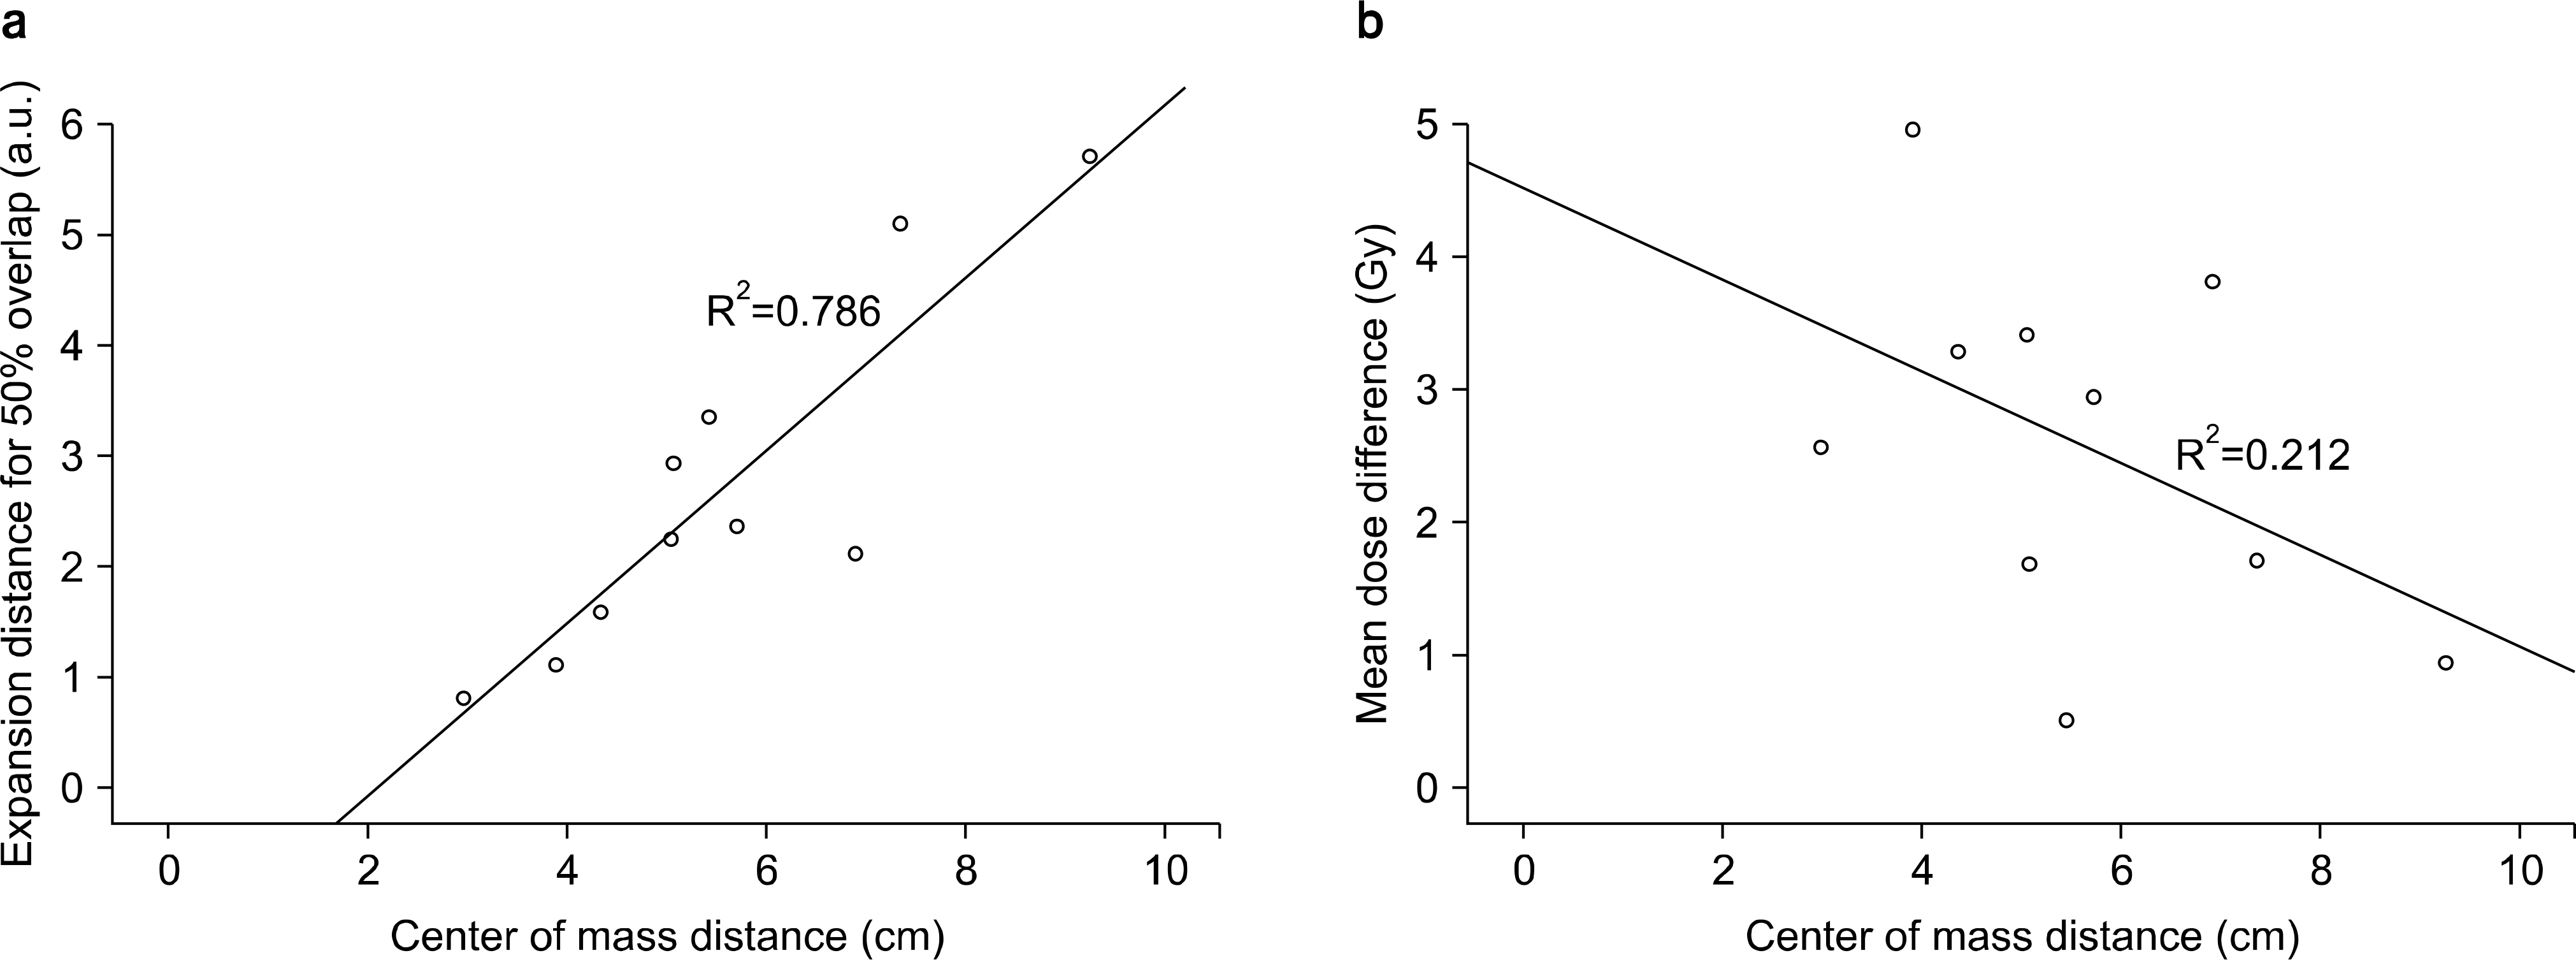
Fig. 4. Regression line and scatter diagram for the overlap volume histogram (OVH) and the center-of-mass (COM) distance between the planning target volume (PTV) and the organ at risk (OAR), and the mean dose differences between the four-dimensional dose (4D dose) and three-dimensional dose (3D dose) at the OAR. (a) Linear regression line and scatter diagram between the expansion distance and COM distance when the ratio of the OAR volume to the overlapped volume between the OAR and PTV expanded by an arbitrary margin was 50% (OVH50), (b) Linear regression line and the scatter diagram between the mean dose difference and COM distance.
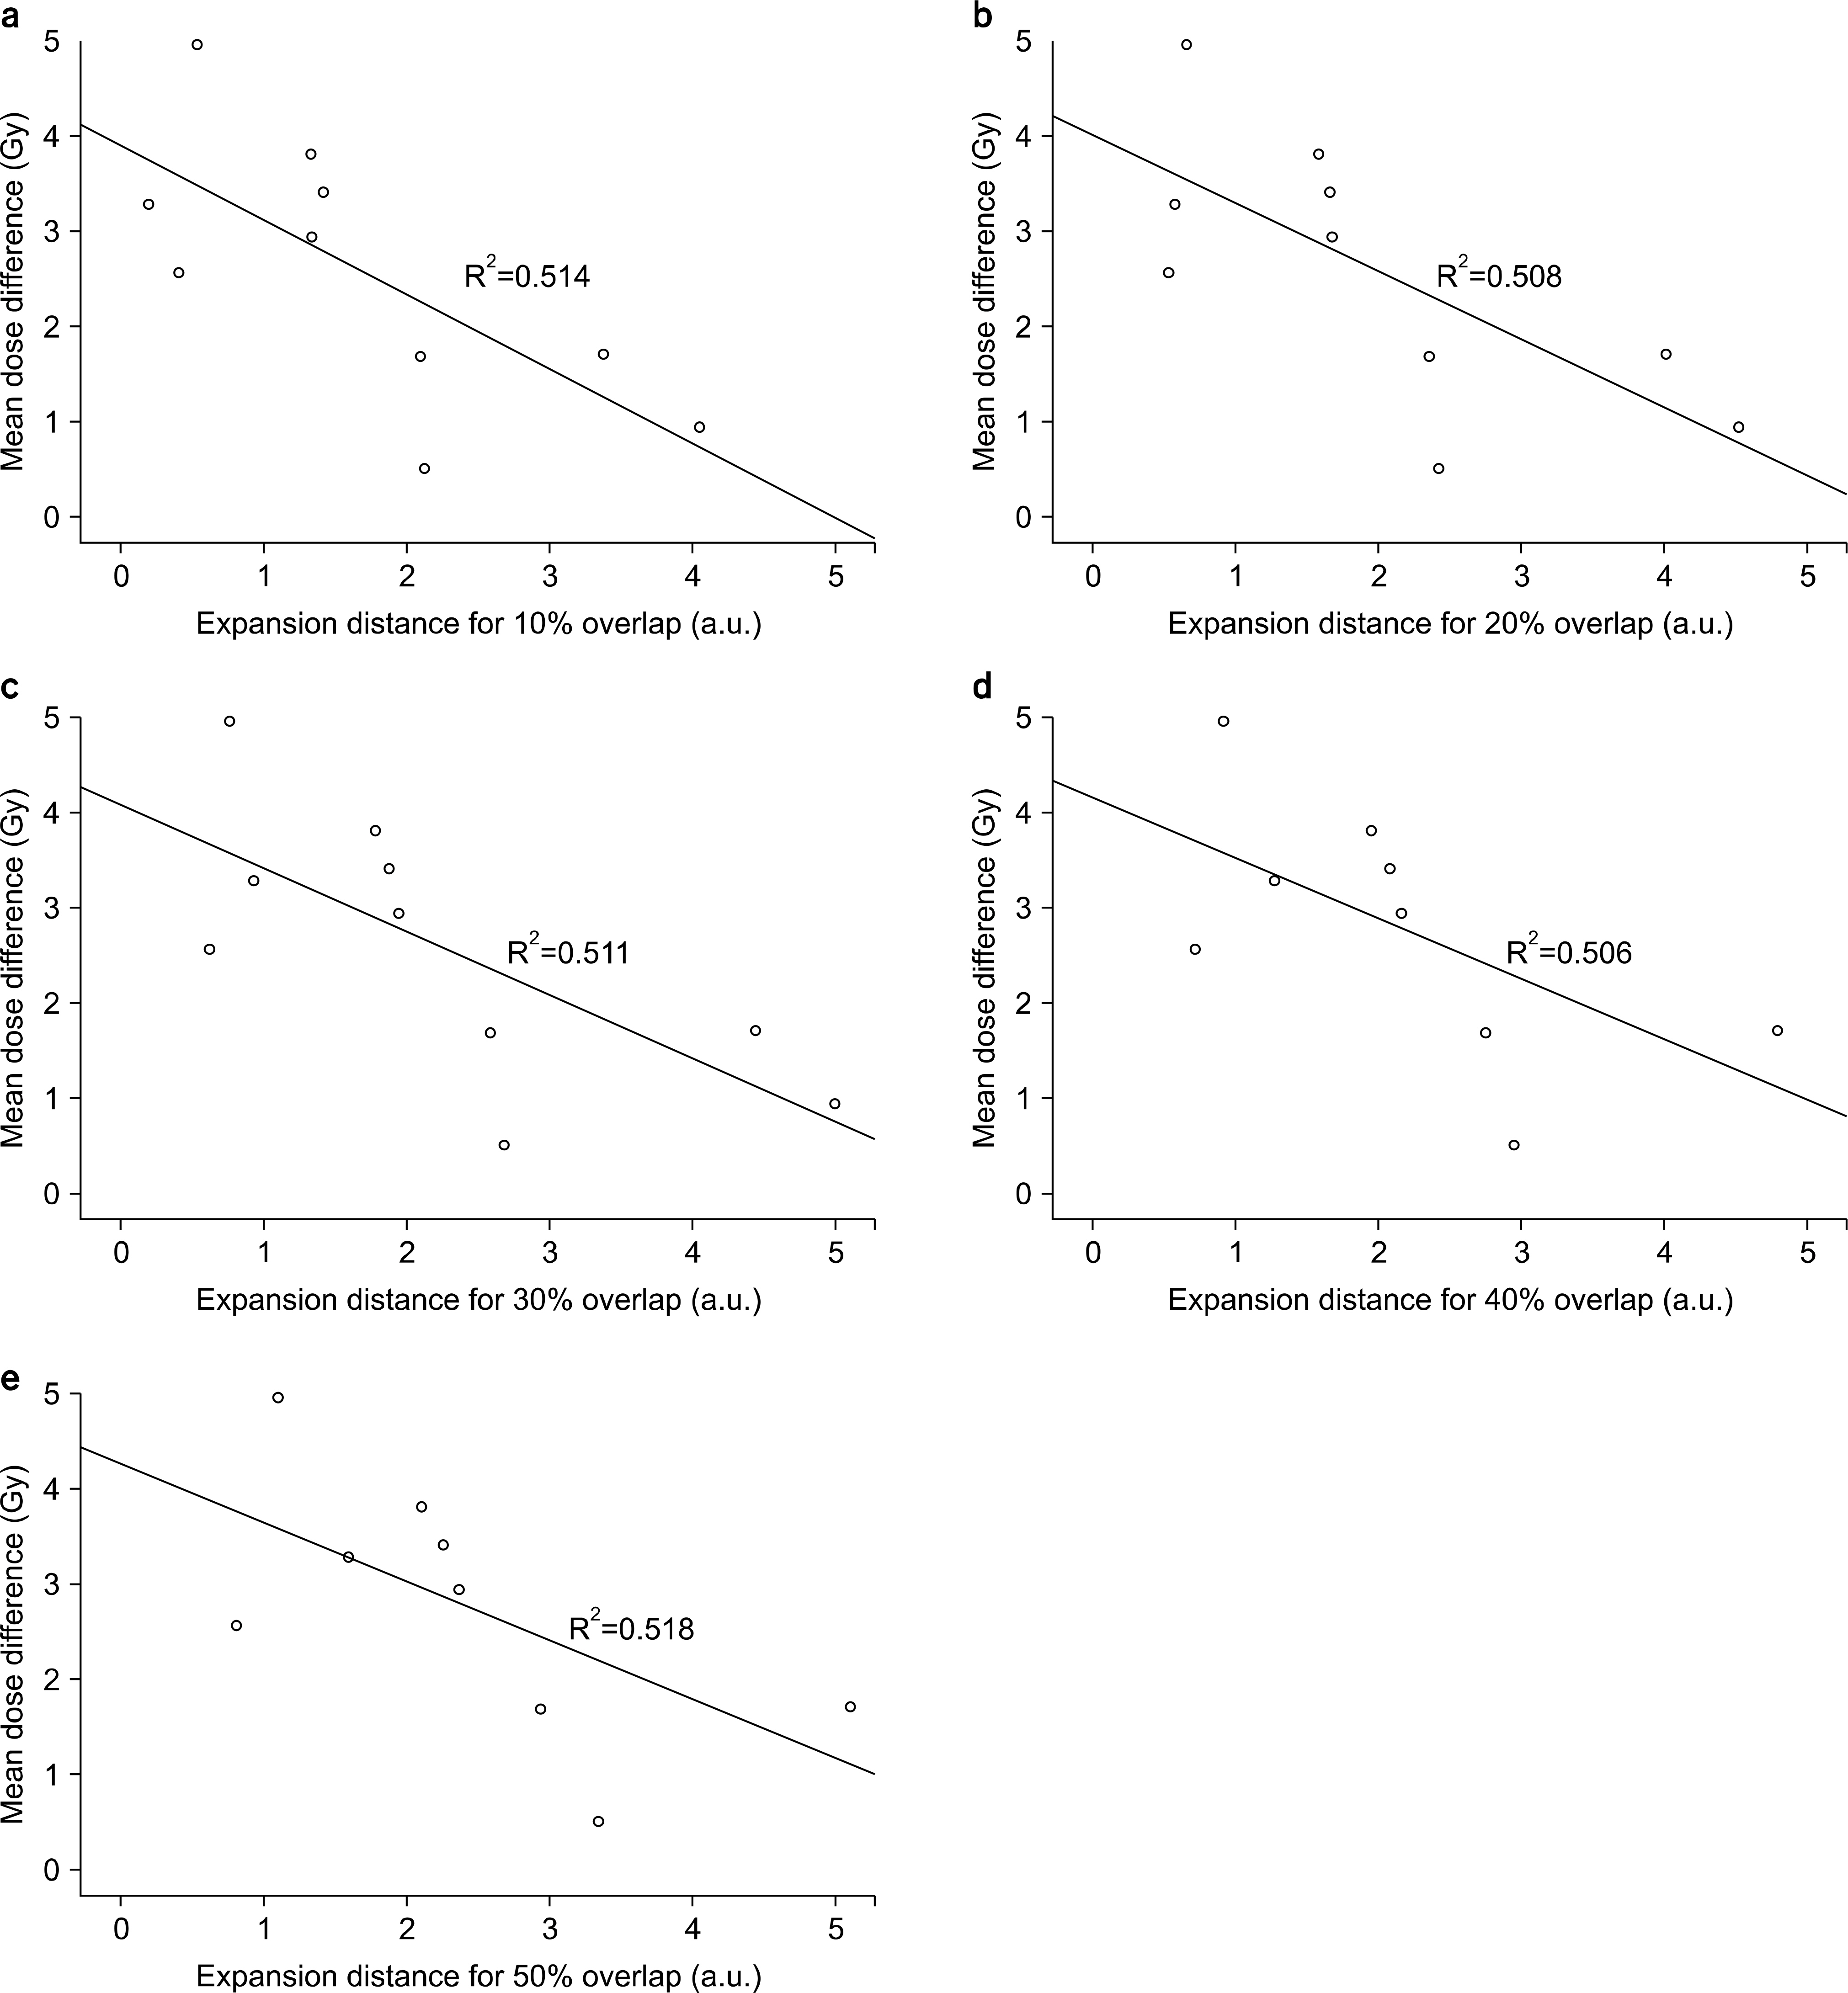
Fig. 5. Regression line and scatter diagram for the mean dose difference between three-dimensional doses (3D doses) and four-dimensional doses (4D doses); expansion distance according to each volume ratio standard when the ratio of the overlapped volume between the organ at risk (OAR) and the planning target volume (PTV) expanded by an arbitrary margin to the OAR volume ranges from 10% to 50% (OVH10, OVH20, OVH30, OVH40, OVH50). (a) Standard at OVH10, (b) standard at OVH20, (c) standard at OVH30, (d) standard at OVH40, (e) standard at OVH50.
Cited by 1 articles
-
Characteristic Evaluation of Pressure Mapping System for Patient Position Monitoring in Radiation Therapy
Seonghee Kang, Chang Heon Choi, Jong Min Park, Jin-Beom Chung, Keun-Yong Eom, Jung-in Kim
Prog Med Phys. 2021;32(4):153-158. doi: 10.14316/pmp.2021.32.4.153.
Reference
-
1. Low DA, Nystrom M, Kalinin E, et al. A method for the reconstruction of four-dimensional synchronized CT scans acquired during free breathing. Med Phys. 30(6):1254–1263. 2003.
Article2. Pan T, Lee T-Y, Rietzel E, Chen GTY. 4D-CT imaging of a volume influenced by respiratory motion on multislice CT. Med Phys. 31(2):333–340. 2004.
Article3. Keall P. 4-dimensional computed tomography imaging and treatment planning. Semin Radiat Oncol. 14(1):81–90. 2004.
Article4. Ohara K, Okumura T, Akisada M, et al. Irradiation synchronized with respiration gate. Int J Radiat Oncol Biol Phys. 17(4):853–857. 1989.
Article5. Hideo DK, Bruce CH. Respiration gated radiotherapy treatment: a technical study. Phys Med Biol. 41(1):83. 1996.6. Hanley J, Debois MM, Mah D, et al. Deep inspiration breath-hold technique for lung tumors: the potential value of target immobilization and reduced lung density in dose escalation. Int J Radiat Oncol Biol Phys. 45(3):603–611. 1999.
Article7. Underberg RWM, Lagerwaard FJ, Cuijpers JP, Slotman BJ, van Sörnsen de Koste Jr, Senan S, et al. Four-dimensional CT scans for treatment planning in stereotactic radiotherapy for stage I lung cancer. Int J Radiat Oncol Biol Phys. 60(4):1283–1290. 2004.
Article8. Wu B, Pang D, Simari P, Taylor R, Sanguineti G, McNutt T. Using overlap volume histogram and IMRT plan data to guide and automate VMAT planning: A head-and-neck case study. Med Phys. 40(2):021714. 2013.
Article9. Brock KK, McShan DL, Ten Haken RK, Hollister SJ, Dawson LA, Balter JM. Inclusion of organ deformation in dose calculations. Med Phys. 30(3):290–295. 2003.
Article10. Starkschall G, Britton K, McAleer MF, et al. Potential dosimetric benefits of four-dimensional radiation treatment planning. Int J Radiat Oncol Biol Phys. 73(5):1560–1565. 2009.
Article11. Valdes G, Robinson C, Lee P, et al. Tumor control probability and the utility of 4D vs 3D dose calculations for stereotactic body radiotherapy for lung cancer. Med Dosim. 40(1):64–69. 2015.
Article12. Yeo UA, Taylor ML, Supple JR, et al. Evaluation of dosi metric misrepresentations from 3D conventional planning of liver SBRT using 4D deformable dose integration. J Appl Clin Med Phys. 15(6):188–203. 2014.13. Jung SH, Yoon SM, Park SH, et al. Four-dimensional dose evaluation using deformable image registration in radiotherapy for liver cancer. Med Phys. 40(1):011706. 2013.14. Starkschall G, Gibbons JP, Orton CG. To ensure that target volumes are not underirradiated when respiratory motion may affect the dose distribution, 4D dose calculations should be performed. Med Phys. 36(1):1–3. 2009.
Article15. Kazhdan M, Simari P, McNutt T, et al. A shape relationship descriptor for radiation therapy planning. Med Image Comput Comput Assist Interv 12(Pt 2): 100-108. 2009.16. Wu B, Ricchetti F, Sanguineti G, et al. Patient geometry-driven information retrieval for IMRT treatment plan quality control. Med Phys. 36(12):5497–5505. 2009.
Article17. Yang D, Brame S, El Naqa I, et al. Technical Note: DIRART – A software suite for deformable image registration and adaptive radiotherapy research. Med Phys. 38(1):67–77. 2011.18. Wang J, Jin X, Zhao K, et al. Patient feature based dosimetric Pareto front prediction in esophageal cancer radiotherapy. Med Phys. 42(2):1005–1011. 2015.
Article19. Remouchamps VM, Vicini FA, Sharpe MB, Kestin LL, Marinez AA, Wong JW. Significant reductions in heart and lung doses using deep inspiration breath hold with active breathing control and intensity-modulated radiation therapy for patients treated with locoregional breast irradiation. Int J Radiat Oncol Biol Phys. 55(2):392–406. 2003.
Article20. Liu HH, Balter P, Tutt T, et al. Assessing Respiration- Induced Tumor Motion and Internal Target Volume Using Four-Dimensional Computed Tomography for Radiotherapy of Lung Cancer. Int J Radiat Oncol Biol Phys. 68(2):531–540. 2007.21. Yang Y, Ford EC, Wu B, et al. An overlap-volume-histogram based method for rectal dose prediction and automated treatment planning in the external beam prostate radiotherapy following hydrogel injection. Med Phys. 40(1):011709. 2013.
Article22. Wu B, Ricchetti F, Sanguineti G, et al. Data-driven approach to generating achievable dose-volume histogram objectives in intensity-modulated radiotherapy planning. Int J Radiat Oncol Biol Phys. 79(4):1241–1247. 2011.
Article23. Wu B, Pang D, Lei S, et al. Improved robotic stereotactic body radiation therapy plan quality and planning efficacy for organ-confined prostate cancer utilizing overlap-volume histogram-driven planning methodology. Radiother Oncol. 112(2):221–226. 2014.
Article24. Petit SF, Wu B, Kazhdan M, et al. Increased organ sparing using shape-based treatment plan optimization for intensity modulated radiation therapy of pancreatic adenocarcinoma. Radiother Oncol. 102(1):38–44. 2012.
Article
- Full Text Links
-
- Actions
-
Cited
- CITED
-
- Close
- Share
-
- Similar articles
-
- Dosimetric Analysis on the Effect of Target Motion in the Delivery of Conventional IMRT, RapidArc and Tomotherapy
- Development of an Advanced Deformable Phantom to Analyze Dose Differences due to Respiratory Motion
- Study of Motion-induced Dose Error Caused by Irregular Tumor Motion in Helical Tomotherapy
- Expressing Cobb Angle as Linear Measurement in Scoliosis and Its Significance: A Clinical and Geometrical Analysis of Scoliosis
- Study of Respiration Simulating Phantom using Thermocouple-based Respiration Monitoring Mask
