Foveal Microvascular Changes Based on Optical Coherence Tomography Angiography in Mild Nonproliferative Diabetic Retinopathy
- Affiliations
-
- 1Department of Ophthalmology, Konkuk University School of Medicine, Seoul, Korea. eyekim@kuh.ac.kr
- KMID: 2357727
- DOI: http://doi.org/10.3341/jkos.2016.57.11.1723
Abstract
- PURPOSE
To investigate the microvascular change in diabetic patients with no diabetic retinopathy (DR) and mild nonproliferative DR (NPDR) using optical coherence tomography angiography (OCTA).
METHODS
We retrospectively reviewed the medical records of 44 eyes of 22 patients with no DR and 34 eyes of 17 patients with mild NPDR. OCTA was performed on a 3 × 3 mm region centered in the fovea and parafoveal areas. The foveal avascular zone (FAZ) and foveal and parafoveal flow density (FD) in superficial and deep vascular plexuses were analyzed using OCTA.
RESULTS
The FAZ of deep capillary plexus in patients with mild NPDR was significantly larger than in patients with no DR (p = 0.008). The parafoveal deep FD, foveal and parafoveal thickness in patients with no DR was significantly larger than in patients with mild NPDR (p = 0.013, p = 0.018 and p = 0.003, respectively). Superficial FAZ, superficial foveal FD, superficial parafoveal FD and deep foveal FD were not significantly different between the patients with no DR and those with mild NPDR.
CONCLUSIONS
OCTA allows detection of deep FAZ enlargement, reduction in parafoveal deep FD as well as foveal and parafoveal thickness in patients with mild NPDR compared with patients with no DR.
Keyword
MeSH Terms
Figure
-
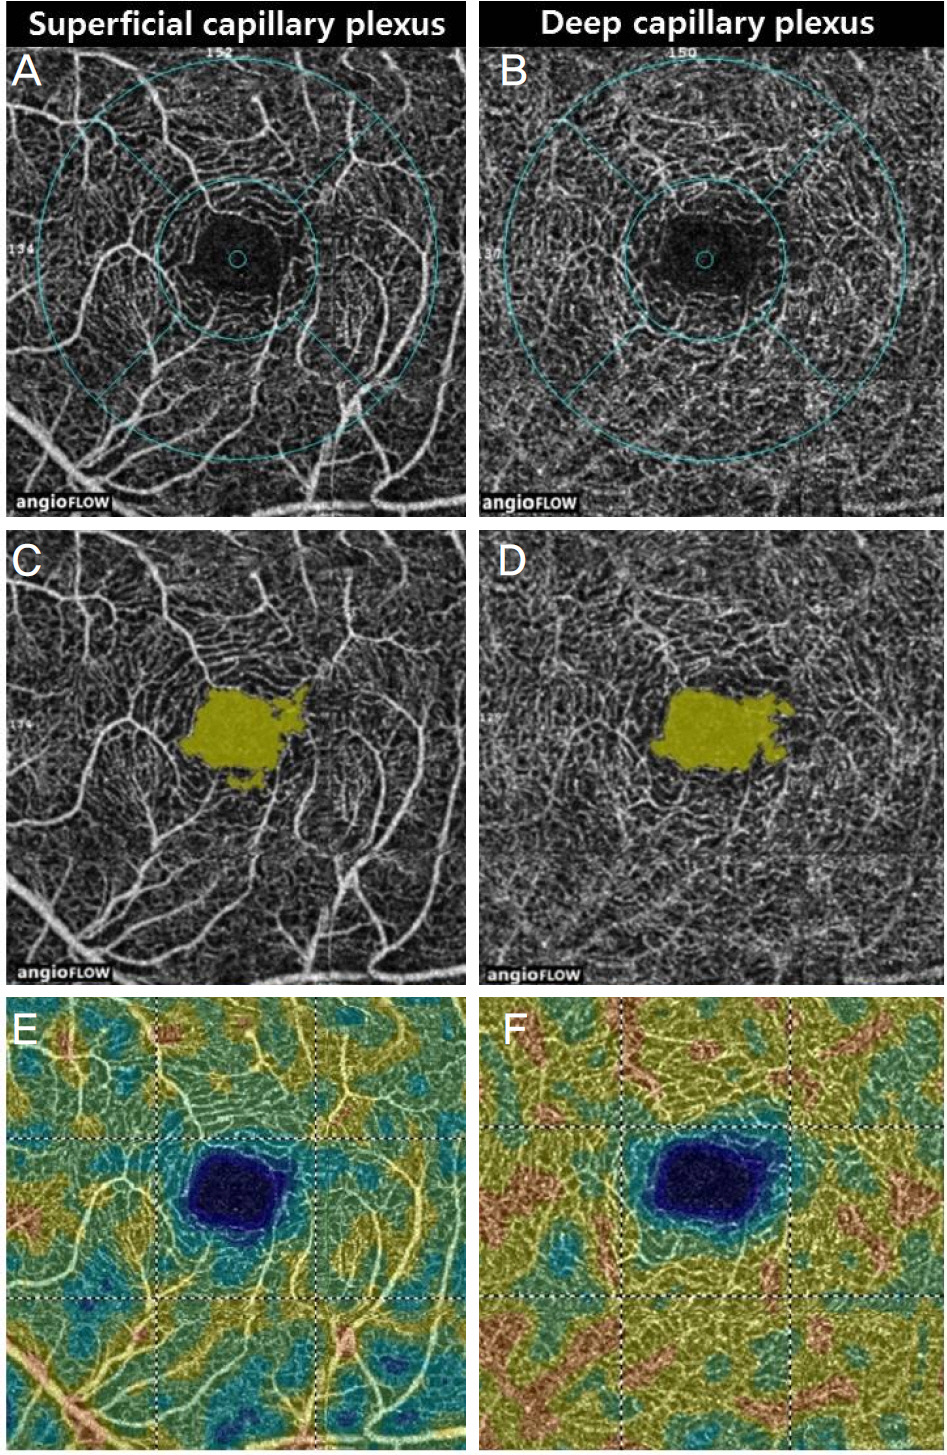
Figure 1. Optical coherence tomography angiography images of no diabetic retinopathy. 3 × 3 mm optical coherence tomography angiogram in superficial capillary plexus (A, C, E) and in deep capillary plexus (B, D, F). (A, B) Fovea and parafovea area in superficial and deep capillary plexus (inner ring: diameter 1 mm, fovea area, outer ring: diameter 2.5 mm, parafovea area). (C, D) Automated foveal avascular zone measurement of superficial and deep capillary plexus. (E, F) Peudo-color map of flow density of superficial and deep capillary plexus.
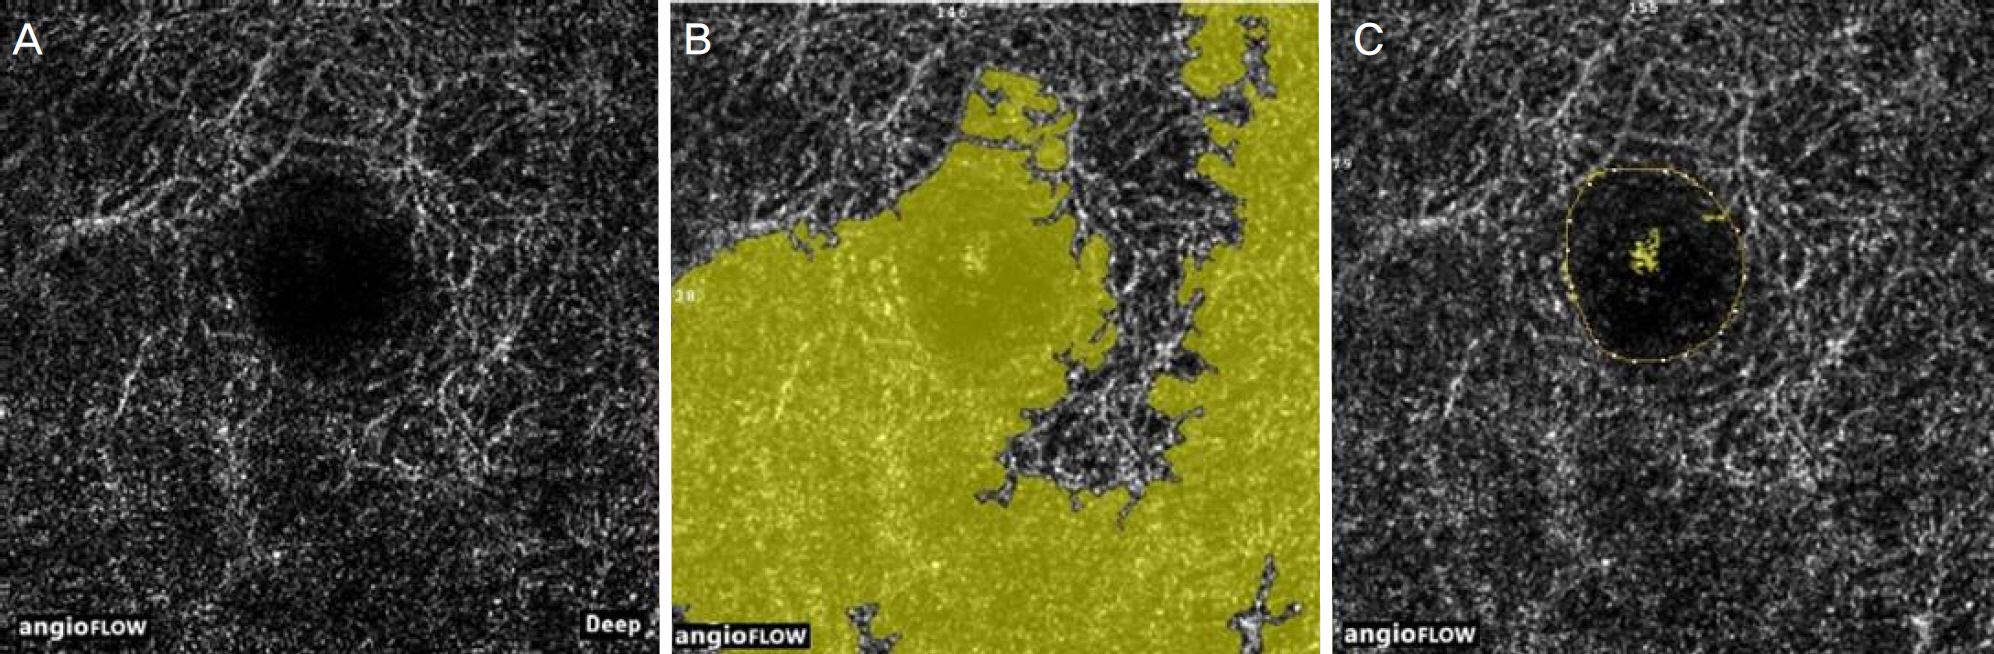
Figure 2. Manual adjustment of the foveal avascular zone (FAZ) boundary. (A) optical coherence tomography angiogram of the macula in the deep capillary plexus. (B) FAZ boundary misidentification by automated program. (C) Manually corrected boundary of FAZ using built-in software.
Cited by 1 articles
-
The Changes of Macular Microvasculature and Related Systemic Parameters in Diabetic Patients without Diabetic Retinopathy
Sang Wook Choi, Joon Hee Cho, Ha Kyung Kim, So Hyun Bae
J Korean Ophthalmol Soc. 2017;58(7):811-817. doi: 10.3341/jkos.2017.58.7.811.
Reference
-
References
1. Arend O, Wolf S, Jung F, et al. Retinal microcirculation in patients with diabetes mellitus: dynamic and morphological analysis of perifoveal capillary network. Br J Ophthalmol. 1991; 75:514–8.
Article2. Grant MB, Afzal A, Spoerri P, et al. The role of growth factors in the pathogenesis of diabetic retinopathy. Expert Opin Investig Drugs. 2004; 13:1275–93.
Article3. Sim DA, Keane PA, Fung S, et al. Quantitative analysis of diabetic macular ischemia using optical coherence tomography. Invest Ophthalmol Vis Sci. 2014; 55:417–23.
Article4. Ip MS, Domalpally A, Sun JK, Ehrlich JS. abdominal effects of therapy with ranibizumab on diabetic retinopathy severity and baseline risk factors for worsening retinopathy. Ophthalmology. 2015; 122:367–74.5. Sim DA, Keane PA, Zarranz-Ventura J, et al. Predictive factors for the progression of diabetic macular ischemia. Am J Ophthalmol. 2013; 156:684–92.
Article6. Conrath J, Giorgi R, Raccah D, Ridings B. Foveal avascular zone in diabetic retinopathy: quantitative vs qualitative assessment. Eye (Lond). 2005; 19:322–6.
Article7. Bresnick GH, Condit R, Syrjala S, et al. Abnormalities of the abdominal avascular zone in diabetic retinopathy. Arch Ophthalmol. 1984; 102:1286–93.8. Kwiterovich KA, Maguire MG, Murphy RP, et al. Frequency of abdominal systemic reactions after fluorescein angiography. Results of a prospective study. Ophthalmology. 1991; 98:1139–42.9. Yannuzzi LA, Rohrer KT, Tindel LJ, et al. Fluorescein abdominal complication survey. Ophthalmology. 1986; 93:611–7.10. Reznicek L, Kernt M, Haritoglou C, et al. In vivo characterization of ischemic retina in diabetic retinopathy. Clin Ophthalmol. 2010; 5:31–5.
Article11. Lee DH, Kim JT, Jung DW, et al. The relationship between foveal ischemia and spectraldomain optical coherence tomography abdominal in ischemic diabetic macular edema. Invest Ophthalmol Vis Sci. 2013; 54:1080–5.12. de Carlo TE, Bonini Filho MA, Chin AT, et al. Spectral-domain optical coherence tomography angiography of choroidal neovascularization. Ophthalmology. 2015; 122:1228–38.
Article13. Savastano MC, Lumbroso B, Rispoli M. In vivo characterization of retinal vascularization morphology using optical coherence abdominal angiography. Retina. 2015; 35:2196–203.14. Spaide RF, Klancnik JM Jr, Cooney MJ. Retinal vascular layers imaged by fluorescein angiography and optical coherence abdominal angiography. JAMA Ophthalmol. 2015; 133:45–50.15. Ishibazawa A, Nagaoka T, Takahashi A, et al. Optical coherence tomography angiography in diabetic retinopathy: a prospective abdominal study. Am J Ophthalmol. 2015; 160:35–44.e1.16. Couturier A, Mané V, Bonnin S, et al. Capillary plexus anomalies in diabetic retinopathy on optical coherence tomography angiography. Retina. 2015; 35:2384–91.
Article17. de Carlo TE, Chin AT, Bonini Filho MA, et al. Detection of abdominal changes in eyes of patients with diabetes but not clinical diabetic retinopathy using optical coherence tomography angiography. Retina. 2015; 35:2364–70.18. Takase N, Nozaki M, Kato A, et al. Enlargement of foveal abdominal zone in diabetic eyes evaluated by en face optical coherence tomography angiography. Retina. 2015; 35:2377–83.19. Wilkinson CP, Ferris FL 3rd, Klein RE, et al. Proposed international clinical diabetic retinopathy and diabetic macular edema abdominal severity scales. Ophthalmology. 2003; 110:1677–82.20. Samara WA, Say EA, Khoo CT, et al. Correlation of foveal abdominal zone size with foveal morphology in normal eyes using abdominal coherence tomography angiography. Retina. 2015; 35:2188–95.21. Coscas F, Glacet-Bernard A, Miere A, et al. Optical coherence abdominal angiography in retinal vein occlusion: evaluation of abdominal and deep capillary plexa. Am J Ophthalmol. 2016; 161:160–71.e1–2.22. Wu LZ, Huang ZS, Wu DZ, Chan E. Characteristics of the abdominal-free zone in the normal human macula. Jpn J Ophthalmol. 1985; 29:406–11.23. Sakata K, Funatsu H, Harino S, et al. Relationship between abdominal microcirculation and progression of diabetic macular edema. Ophthalmology. 2006; 113:1385–91.
- Full Text Links
-
- Actions
-
Cited
- CITED
-
- Close
- Share
-
- Similar articles
-
- Evaluation of Foveal Avascular Zone and Capillary Plexuses in Diabetic Patients by Optical Coherence Tomography Angiography
- Optical Coherence Tomography-angiography: Comparison of the Foveal Avascular Zone between Diabetic Retinopathy and Normal Subjects
- Optical Coherence Tomography Angiography According to Severity of Diabetic Retinopathy
- The Changes in Macular Thickness after Phacoemulsification in Patients with Non-diabetes and Nonproliferative Diabetic Retinopathy
- Choroidal Thickness at the Outside of Fovea in Diabetic Retinopathy Using Spectral-Domain Optical Coherence Tomography
