MRI Findings of Lipiodol Uptake in Hepatocellular Carcinomas: A Focus on Signal Intensity
- Affiliations
-
- 1Department of Radiology, Ewha Womans University School of Medicine, Seoul, Korea. bbaek@ewha.ac.kr
- KMID: 2356382
- DOI: http://doi.org/10.12771/emj.2016.39.4.110
Abstract
OBJECTIVES
To evaluate MRI findings of non-recurrent hepatocellular carcinomas with lipiodol uptake (LHCCs) treated with transarterial chemoembolization.
METHODS
28 LHCCs were divided into two groups according to amount of lipiodol uptake and tumor size, retrospectively. According to amount of lipiodol uptake, HCCs were classified into group A with dense lipiodol uptake (more than 90%) and group B with partial lipiodol uptake (between 50% and 90%). For HCC size analysis, group I was defined by a longest diameter of less than 2 cm, and group II was defined by a longest diameter of greater than or equal to 2 cm.
RESULTS
In group A (n=16), eight LHCCs showed high signal intensity (SI) on T2-weighted images (T2WI), ten LHCCs showed low SI on T1-weighted imaged (T1WI), six LHCCs showed decreased SI at higher b value of diffusion-weighted images (DWI). In group B (n=12), six LHCCs revealed high SI on T2WI, six LHCCs revealed low SI on T1WI, ten LHCCs decreased SI at higher b value of DWI. As compared with tumor size and SI, six of 12 LHCCs in group I and eight of 16 LHCCs in group II showed high SI on T2WI. Six LHCCs in group I and ten LHCCs in group II showed low SI on T1WI. All LHCCs were not enhanced.
CONCLUSION
Signal intensities of LHCCs were variable, but more than half of LHCCs showed high SI on T2WI, low SI on T1WI, decreased SI at higher b value of DWI, regardless of lipiodol uptake or tumor size.
Keyword
MeSH Terms
Figure
-
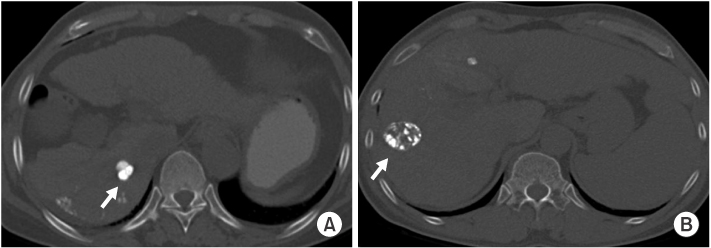
Fig. 1 Hepatocellular carcinomas with lipiodol uptake on precontrast computed tomography with bone window setting. (A) The hepatocellular carcinoma (arrow) shows dense uptake of lipiodol in more than 90% of the area of the lesion in hepatic segment 6 and is classified into group A. (B) The hepatocellular carcinoma (arrow) reveals partial uptake of lipiodol in 50% to 90% of the area of the lesion in hepatic segment 5 and is classified into group B.
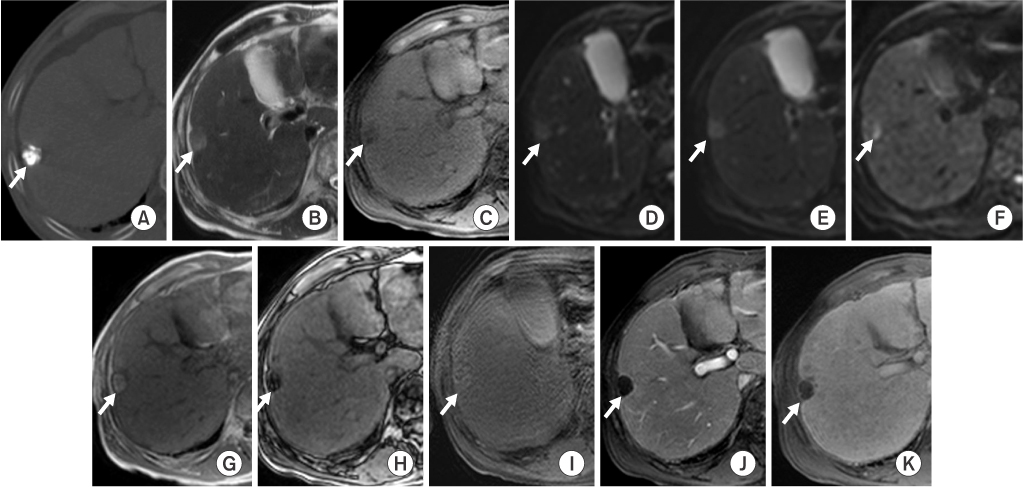
Fig. 2 MR images of a 69-year-old patient with a 1.9×1.3 cm-sized dense hepatocellular carcinoma with lipiodol uptake in hepatic segment 5. Hepatocellular carcinoma (arrows) shows dense uptake of lipiodol on precontrast computed tomography with bone window setting (A), high signal intensity on T2-weighted images (B), and low signal intensity on T1-weighted images (C). On diffusion-weighted images, it reveals high signal intensity at lower b factors (b=0 and b=50) (D and E, respectively) and decreased signal intensity at a higher b factor (b=800) (F). The lesion shows high signal intensity on in-phase gradient-echo images (G) and low signal intensity on out-of-phase gradient-echo images (H). It is not enhanced on dynamic contrast-enhanced arterial phase (I), portal phase (J) or 10-minute delayed phase (K) images.
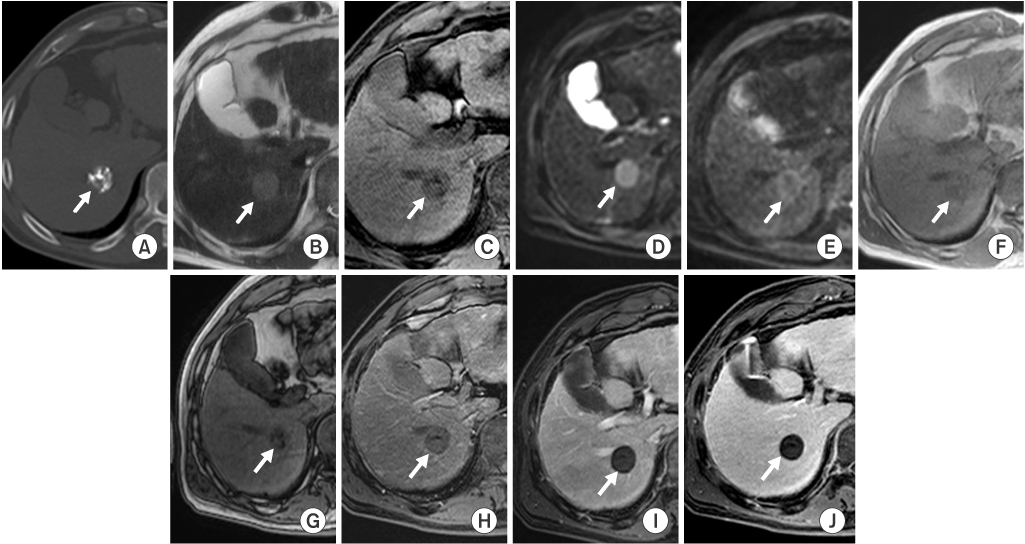
Fig. 3 MR images of a 57-year-old patient with a 2.3×2.3 cm-sized hepatocellular carcinoma with partial lipiodol uptake in hepatic segment 6. Hepatocellular carcinoma (arrows) shows partial uptake of lipiodol on precontrast computed tomography with bone window setting (A), high signal intensity on T2-weighted images (B), and low signal intensity on T1-weighted images (C). On diffusion-weighted images, the lesion reveals high signal intensity at a lower b factor (b=0) (D) and decreased signal intensity at a higher b factor (b=800) (E) images. It shows low signal intensity on in-phase (F) and out-of-phase (G) gradient-echo images. Hepatocellular carcinomas is not enhanced on dynamic contrast-enhanced arterial phase (H), portal phase (I) or 20-minute delayed phase (J) images.
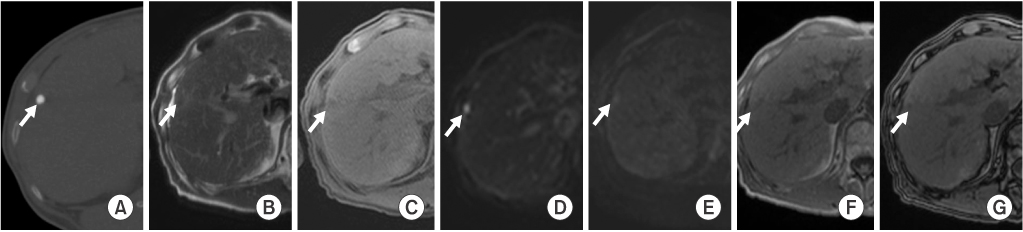
Fig. 4 MR images of a 73-year-old patient with a 0.7×0.6 cm-sized, small, hepatocellular carcinomas with dense lipiodol uptake in the hepatic segment 5. Hepatocellular carcinoma (arrows) shows dense uptake of lipiodol on precontrast computed tomography with bone window setting (A), low signal intensity on T2-weighted images (B) and T1-weighted images (C). Diffusion-weighted images reveals high signal intensity at a lower b factor (b=0) (D) and decreased signal intensity at a higher b factor (b=800) (E). Hepatocellular carcinoma with dense lipiodol uptake shows isointensity on in-phase gradient-echo images (F) and low signal intensity on out-of-phase gradient-echo images (G).
Reference
-
1. Parkin DM, Bray F, Ferlay J, Pisani P. Global cancer statistics, 2002. CA Cancer J Clin. 2005; 55:74–108.2. Jan CF, Chen CJ, Chen HH. Causes of increased mortality from hepatocellular carcinoma in high incidence country: Taiwan experience. J Gastroenterol Hepatol. 2005; 20:521–526.3. Llovet JM, Fuster J, Bruix J. Barcelona-Clinic Liver Cancer Group. The Barcelona approach: diagnosis, staging, and treatment of hepatocellular carcinoma. Liver Transpl. 2004; 10:2 Suppl 1. S115–S120.4. Carr BI. Hepatic artery chemoembolization for advanced stage HCC: experience of 650 patients. Hepatogastroenterology. 2002; 49:79–86.5. Chapman WC, Majella Doyle MB, Stuart JE, Vachharajani N, Crippin JS, Anderson CD, et al. Outcomes of neoadjuvant transarterial chemoembolization to downstage hepatocellular carcinoma before liver transplantation. Ann Surg. 2008; 248:617–625.6. Nakamura H, Hashimoto T, Oi H, Sawada S. Transcatheter oily chemoembolization of hepatocellular carcinoma. Radiology. 1989; 170(3 Pt 1):783–786.7. Hwang J, Kim SH, Kim YS, Lee MW, Woo JY, Lee WJ, et al. Gadoxetic acid-enhanced MRI versus multiphase multidetector row computed tomography for evaluating the viable tumor of hepatocellular carcinomas treated with image-guided tumor therapy. J Magn Reson Imaging. 2010; 32:629–638.8. Brennan IM, Ahmed M. Imaging features following transarterial chemoembolization and radiofrequency ablation of hepatocellular carcinoma. Semin Ultrasound CT MR. 2013; 34:336–351.9. Gervais DA, Kalva S, Thabet A. Percutaneous image-guided therapy of intra-abdominal malignancy: imaging evaluation of treatment response. Abdom Imaging. 2009; 34:593–609.10. Solomon B, Soulen MC, Baum RA, Haskal ZJ, Shlansky-Goldberg RD, Cope C. Chemoembolization of hepatocellular carcinoma with cisplatin, doxorubicin, mitomycin-C, ethiodol, and polyvinyl alcohol: prospective evaluation of response and survival in a U.S. population. J Vasc Interv Radiol. 1999; 10:793–798.11. Ngan H, Lai CL, Fan ST, Lai EC, Yuen WK, Tso WK. Transcatheter arterial chemoembolization in inoperable hepatocellular carcinoma: four-year follow-up. J Vasc Interv Radiol. 1996; 7:419–425.12. Lim HS, Jeong YY, Kang HK, Kim JK, Park JG. Imaging features of hepatocellular carcinoma after transcatheter arterial chemoembolization and radiofrequency ablation. AJR Am J Roentgenol. 2006; 187:W341–W349.13. Buckwalter KA, Ellis JH, Baker DE, Borello JA, Glazer GM. Pitfall in MR imaging of lymphadenopathy after lymphangiography. Radiology. 1986; 161:831–832.14. De Santis M, Alborino S, Tartoni PL, Torricelli P, Casolo A, Romagnoli R. Effects of lipiodol retention on MRI signal intensity from hepatocellular carcinoma and surrounding liver treated by chemoembolization. Eur Radiol. 1997; 7:10–16.15. Kubota K, Hisa N, Nishikawa T, Fujiwara Y, Murata Y, Itoh S, et al. Evaluation of hepatocellular carcinoma after treatment with transcatheter arterial chemoembolization: comparison of Lipiodol-CT, power Doppler sonography, and dynamic MRI. Abdom Imaging. 2001; 26:184–190.16. Dromain C, de Baere T, Elias D, Kuoch V, Ducreux M, Boige V, et al. Hepatic tumors treated with percutaneous radiofrequency ablation: CT and MR imaging follow-up. Radiology. 2002; 223:255–262.17. Geschwind JF, Artemov D, Abraham S, Omdal D, Huncharek MS, McGee C, et al. Chemoembolization of liver tumor in a rabbit model: assessment of tumor cell death with diffusion-weighted MR imaging and histologic analysis. J Vasc Interv Radiol. 2000; 11:1245–1255.18. Galban CJ, Chenevert TL, Meyer CR, Tsien C, Lawrence TS, Hamstra DA, et al. The parametric response map is an imaging biomarker for early cancer treatment outcome. Nat Med. 2009; 15:572–576.19. Talwalkar JA, Limburg PJ. Quantitative dynamic contrast-enhanced magnetic resonance imaging for assessing treatment response in hepatocellular carcinoma. Gastroenterology. 2008; 135:1007–1009.20. Bonekamp S, Jolepalem P, Lazo M, Gulsun MA, Kiraly AP, Kamel IR. Hepatocellular carcinoma: response to TACE assessed with semiautomated volumetric and functional analysis of diffusion-weighted and contrast-enhanced MR imaging data. Radiology. 2011; 260:752–761.21. Kamel IR, Liapi E, Reyes DK, Zahurak M, Bluemke DA, Geschwind JF. Unresectable hepatocellular carcinoma: serial early vascular and cellular changes after transarterial chemoembolization as detected with MR imaging. Radiology. 2009; 250:466–473.
- Full Text Links
-
- Actions
-
Cited
- CITED
-
- Close
- Share
-
- Similar articles
-
- Diagnostic Value of Immediate CT after Chemoembolization in Patients with Hepatocellular Carcinoma: Comparison with 2-3 Week Delayed CT
- Imaging Findings of Adenomatous Hyperplasia of the Liver
- MR imaging of hepatocellular carcinoma
- Focal hepatic lesions:Differential diagnosis with MRI
- Inflammatory myofibroblastic tumor mimicking hepatocellular carcinoma with dense lipiodol uptake
